Abstract
We present a two-photon microscope that is approximately 2.9 g in mass and 2.0×1.9×1.1 cm3 in size and based on a microelectromechanical systems (MEMS) laser-scanning mirror. The microscope has a focusing motor and a micro-optical assembly composed of four gradient refractive index lenses and a dichroic micro-prism. Fluorescence is captured without the detected emissions reflecting off the MEMS mirror, by use of separate optical fibers for fluorescence collection and delivery of ultrashort excitation pulses. Using this microscope we imaged neocortical microvasculature and tracked the flow of erythrocytes in live mice.
An important aim of recent research on nonlinear optical microscopy has been to create miniaturized laser-scanning microscopes and endoscopes for biomedical investigation and clinical purposes. Such devices would propel a range of applications benefiting from portable instrumentation and should ultimately be more economical than tabletop instrumentation. Among key potential applications are imaging microvascular function or cellular dynamics in live or behaving animals [1], minimally invasive diagnostics [2], and image-guided therapeutic intervention [3]. Promising nonlinear contrast modalities for use in miniaturized microscopes include two-photon fluorescence [1,4,5], second-harmonic generation [2,6], coherent anti-Stokes Raman scattering [7], and stimulated Raman scattering [8].
Crucial design issues with miniaturized nonlinear imaging devices concern laser-scanning mechanisms. Several mechanisms have been explored for two-photon imaging, including cantilever fiber-scanners operating at resonant [9,10] or non-resonant [11–13] frequencies, as well as microelectromechanical systems (MEMS) scanning mirrors [3,6,14,15]. Cantilever scanners generally have longer lengths than MEMS scanners and if operated at resonance also restrict the choice of scanning frequencies. MEMS scanners allow batch fabrication, generally at least modest abilities to zoom and pan across the imaging field, and flexibility in the adjustment of scan rates. To date, two endoscopes for two-photon imaging based on MEMS scanners have been described [3,16], both of which are larger than the microscope we present below. One endoscope involved a double-clad optical fiber and routed fluorescence signals in reflection off the MEMS mirror [16], which aids miniaturization but reduces robustness to light scattering when imaging deep in optically dense tissue. The report on the other endoscope included only spatially filtered images [3]. Neither device was shown capable of imaging in live subjects or to have sufficient sensitivity for fast physiological measurements. Here, we describe a 2.9 g microscope based on a two-dimensional MEMS scanner and the use of this instrument for tracking erythrocyte flow in live mice.
We constructed a portable two-photon microscope that is 2.9 g in mass and ~2.0×1.9×1.1 cm3 in volume. A hollow-core bandgap fiber (Blaze Photonics) delivers ultrashort excitation pulses (~110 fs FWHM) from a tunable Ti:sapphire laser (Tsunami, Spectra-Physics) to the microscope. In this fiber the pulses incur negligible self-phase modulation [17], which arises in conventional single-mode or double-clad fibers with the 0.01–1 nJ pulse energies commonly used for two-photon excitation. Group-velocity dispersion in the bandgap fiber vanishes at ~800 nm, so we tuned the laser emission to ~790–810 nm to obviate dispersion precompensation [17].
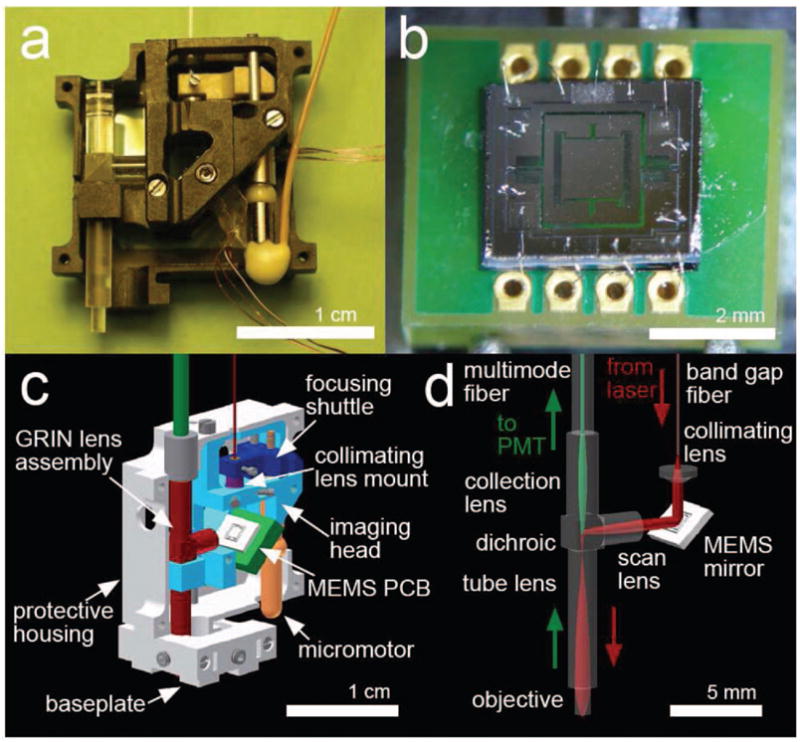
The light delivered to the microscope passes through an aspherical collimating lens (LightPath) and reflects off the MEMS scanner Figs. 1a–d. The scanner is 1 mm×1 mm, has a gimbal design, and contains six banks of electrostatic vertical comb actuators for steering the laser beam in two angular dimensions (Fig. 1b). We batch fabricated scanners of this type on a double-side polished, double-silicon-on-insulator wafer using four deep reactive ion-etching steps [14]. A double-sided printed circuit board (Figs. 1b and 1c) holds the scanner die and attaches to its voltage control wires.
Fig. 1.

a, Portable two-photon microscope. Electrical lines control the MEMS scanner and focusing micromotor. b, The scanner die is wirebonded onto electrodes on the printed circuit board (PCB). c, Computer-aided-design model of the microscope, in a cut-away view. d, Laser illumination (red arrows) and fluorescence collection (green arrows) pathways.
After reflecting off the scanner, the illumination enters a micro-optical assembly (made to our design by GRINTECH, GmbH) of four gradient refractive index (GRIN) lenses and a 2-mm-wide dichroic micro-prism (short pass, <700 nm) that separates the IR excitation and visible emission (Fig. 1d). Two of the GRIN lenses, a 2 mm diameter scan lens (0.5 NA, 0.14 pitch, Ag doped) and a 1.8 mm diameter tube lens (0.2 NA, 0.22 pitch, Li doped), serve together as a beam expander. The illumination under fills the back aperture of the objective, a 1 mm diameter GRIN lens (0.58 NA, 0.23 pitch, Th doped), and is focused to the specimen with a lower NA than that for fluorescence collection. The working distance from the tip of the objective to the specimen plane is 280 μm in air.
The full aperture of fluorescence emissions collected by the objective returns through the tube lens, the microprism, and a GRIN collection lens (0.5 NA, 0.27 pitch, Ag doped) that projects the emissions onto a multimode polymer fiber (1.96 mm diameter core, 0.51 NA, Edmund Optics). This fiber guides the light to a remotely placed photomultiplier tube. Our detection configuration, in which emissions are not routed back though the scanner, differs from that of several prior fiber-optic two-photon microscopes that used a double-clad fiber for both illumination delivery and fluorescence collection and thus required emission descanning [6,10,13,16].
The microscope’s housing, base plate, and internal imaging head are composed of carbon-fiber filled polyetheretherketone (PEEK), a conductive plastic chosen to minimize static charge accumulation that could damage the scanner. The base plate permits coarse lateral adjustments in the microscope’s mounting position. The housing allows axial adjustments in the position of the imaging head, for coarse focusing. For fine focusing, a dc micromotor (Faulhaber) drives a shuttle, made of PEEK, that adjusts the axial position of the bandgap fiber. The shuttle’s range of movement is 1.5 mm, yielding 270 μm of focal adjustment in the specimen.
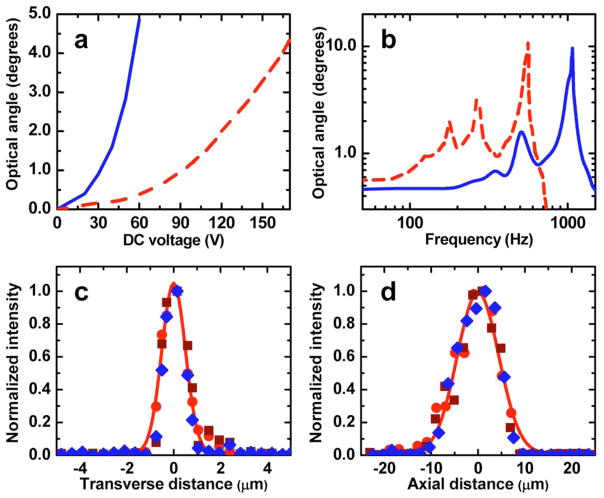
We generally used a raster-scanning pattern, with one axis of the scanner oscillating at resonance and the other at the frame rate of 1–15 Hz. In dc operation, the maximum optical angular ranges for the inner and outer axes of the scanner are about ±5° and ±4.3°, respectively (Fig. 2a). In ac operation, scan rates can be adjusted from near dc to over the mechanical resonant frequencies of 1.08 kHz and 0.56 kHz for the inner and outer axes, respectively (Fig. 2b).
Fig. 2.
(Color online) a, Optical deflection angle versus dc voltage, and b, frequency response function for inner (blue solid curve) and outer (red dashed curve) axes of a 1 mm ×1 mm MEMS scanner. For each axis time-varying signals were applied to one of the two opposing comb banks. c, Lateral and d, axial resolutions were determined as the FWHM of curve fits (Airy function squared, c, and Gaussian, d) to normalized, cross-sectional images of 100 nm diameter fluorescent beads. Data from three beads (circle, square, and diamond symbols) and fits from one bead (solid curves) are shown.
To characterize the microscope’s resolution, we imaged 100 nm diameter fluorescent beads. The FWHM of bead images in cross section yielded transverse and axial resolutions of 1.29±0.05 μm and 10.3±0.3 μm (mean±s.e.m.; n=3 beads), respectively (Figs. 2c and 2d). These values are comparable to those we reported for a 0.48 NA resonant fiber-scanning two-photon microendoscope [4]. Images had 400×135 pixels, and the maximum field of view was 295 μm×100 μm.
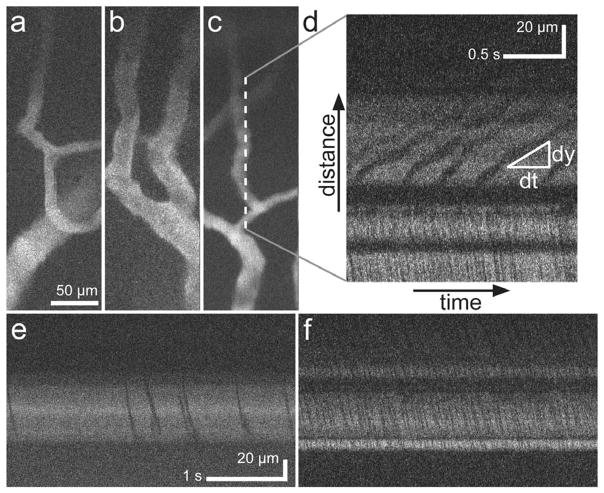
To demonstrate in vivo usage, we studied neocortical microvasculature in adult mice anesthetized during imaging by intraperitoneal injection of ketamine and xylazine (80–100 and 16–20 mg/kg body mass, respectively). We made a 2.5 mm diameter craniotomy (stereotactic coordinates: −2 mm relative to lambda, −2.5 mm lateral) and injected into a tail vein 200 μL of fluorescein isothiocyanate-dextran dye (MW 2,000,000) diluted in saline solution (58.3 mg/mL) to brightly label the blood plasma. After placing the microscope atop the mouse’s head, we imaged vessels near the neocortical surface (Figs. 3a–3c).
Fig. 3.
a–c, Images of neocortical capillaries, averaged over eight frames acquired over 2 s at 4 Hz. d–f, Line images taken by driving only the scanner’s outer axis, at its resonant frequency (560 Hz). Flowing erythrocytes appear as dark streaks in relief. Flow velocities were found from the slopes of the dark streaks at the central region of the line scan. Illumination power was 27 mW at the sample. Scale bar in a also applies to b and c. Scale bar in e also applies to f.
To observe microcirculation, we switched to a line-scanning mode in which the outer axis was scanned at resonance (560 Hz) but the inner axis was held fixed. This allowed tracking of individual erythrocytes in vessels in which flow was parallel to the line scanning. Individual erythrocytes appeared as dark diagonal streaks against the labeled blood plasma in the resulting plots of space (y) versus time (t)(Figs. 3d–3f). The streaks’ slopes (dy/dt)yielded velocity measurements for individual erythrocytes, with steeper streaks indicating faster velocities (Fig. 3d). In the examples of Figs. 3d–3f, flow speeds were 52±12, 305±103, and 243±40 μm/s (mean ±s.d.), respectively, within ranges reported previously for mouse [18] and rat [19] neocortical capillaries.
In summary, we created a portable, 2.9 g two-photon microscope based on a two-dimensional MEMS scanner and made the initial demonstration of physiological measurements using a MEMS-based two-photon imaging device. Future applications of miniaturized two-photon microscopes based on MEMS scanners likely include physiological studies in alert animals or human subjects, as well as cellular level diagnostics. Our approach of using a MEMS mirror for laser scanning should also be applicable to other nonlinear optical contrast modalities.
Acknowledgments
This work was supported by grants to M. J. S. from the Office of Naval Research (ONR), the National Science Foundation (NSF), the NSF Center for Biophotonics, the National Institutes of Health (NIH) Nano-medicine Development Center for Optical Control of Biological Function, and the Packard and Beckman Foundations, NSF and Stanford Graduate Research fellowships (L. D. B.), training grants from NIH (E. C. and R. P. J. B.), and NECTEC (W. P.).
References
- 1.Helmchen F, Fee MS, Tank DW, Denk W. Neuron. 2001;31:903. doi: 10.1016/s0896-6273(01)00421-4. [DOI] [PubMed] [Google Scholar]
- 2.Llewellyn ME, Barretto RP, Delp SL, Schnitzer MJ. Nature. 2008;454:784. doi: 10.1038/nature07104. [DOI] [PMC free article] [PubMed] [Google Scholar]
- 3.Hoy CL, Durr NJ, Chen P, Piyawattanametha W, Ra H, Solgaard O, Ben-Yakar A. Opt Express. 2008;16:9996. doi: 10.1364/oe.16.009996. [DOI] [PMC free article] [PubMed] [Google Scholar]
- 4.Flusberg BA, Jung JC, Cocker ED, Anderson EP, Schnitzer MJ. Opt Lett. 2005;30:2272. doi: 10.1364/ol.30.002272. [DOI] [PubMed] [Google Scholar]
- 5.Göbel W, Kerr JN, Nimmerjahn A, Helmchen F. Opt Lett. 2004;29:2521. doi: 10.1364/ol.29.002521. [DOI] [PubMed] [Google Scholar]
- 6.Fu L, Jain A, Xie H, Cranfield C, Gu M. Opt Express. 2006;14:1027. doi: 10.1364/oe.14.001027. [DOI] [PubMed] [Google Scholar]
- 7.Legare F, Evans C, Ganikhanov F, Xie XS. Opt Express. 2006;14:4427. doi: 10.1364/oe.14.004427. [DOI] [PubMed] [Google Scholar]
- 8.Freudiger CW, Min W, Saar BG, Lu S, Holtom GR, He C, Tsai JC, Kang JX, Xie XS. Science. 2008;322:1857. doi: 10.1126/science.1165758. [DOI] [PMC free article] [PubMed] [Google Scholar]
- 9.Engelbrecht CJ, Johnston RS, Seibel EJ, Helmchen F. Opt Express. 2008;16:5556. doi: 10.1364/oe.16.005556. [DOI] [PubMed] [Google Scholar]
- 10.Myaing MT, MacDonald DJ, Li X. Opt Lett. 2006;31:1076. doi: 10.1364/ol.31.001076. [DOI] [PubMed] [Google Scholar]
- 11.Le Harzic R, Weinigel M, Riemann I, König K, Messerschmidt B. Opt Express. 2008;16:20588. doi: 10.1364/oe.16.020588. [DOI] [PubMed] [Google Scholar]
- 12.Sawinski J, Denk W. J Appl Phys. 2007;102:034701. [Google Scholar]
- 13.Bao H, Allen J, Pattie R, Vance R, Gu M. Opt Lett. 2008;33:1333. doi: 10.1364/ol.33.001333. [DOI] [PubMed] [Google Scholar]
- 14.Piyawattanametha W, Barretto RP, Ko TH, Flusberg BA, Cocker ED, Ra H, Lee D, Solgaard O, Schnitzer MJ. Opt Lett. 2006;31:2018. doi: 10.1364/ol.31.002018. [DOI] [PMC free article] [PubMed] [Google Scholar]
- 15.Liu TM, Chan MC, Chen IH, Chia SH, Sun CK. Opt Express. 2008;16:10501. doi: 10.1364/oe.16.010501. [DOI] [PubMed] [Google Scholar]
- 16.Jung W, Tang S, McCormic DT, Xie T, Ahn YC, Su J, Tomov IV, Krasieva TB, Tromberg BJ, Chen Z. Opt Lett. 2008;33:1324. doi: 10.1364/ol.33.001324. [DOI] [PMC free article] [PubMed] [Google Scholar]
- 17.Göbel W, Nimmerjahn A, Helmchen F. Opt Lett. 2004;29:1285. doi: 10.1364/ol.29.001285. [DOI] [PubMed] [Google Scholar]
- 18.Flusberg BA, Nimmerjahn A, Cocker ED, Mukamel EA, Barretto RP, Ko TH, Burns LD, Jung JC, Schnitzer MJ. Nat Methods. 2008;5:935. doi: 10.1038/nmeth.1256. [DOI] [PMC free article] [PubMed] [Google Scholar]
- 19.Kleinfeld D, Mitra PP, Helmchen F, Denk W. Proc Natl Acad Sci USA. 1998;95:15741. doi: 10.1073/pnas.95.26.15741. [DOI] [PMC free article] [PubMed] [Google Scholar]


