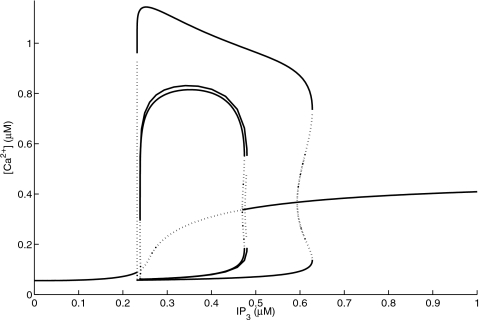
Figure 4.
The bifurcation diagram for the Ca2+ concentration c as a function of the IP3 concentration for the six-state model, the four-state reduction, and the two-state reduction at v1=120 and cER=11 μM. All other parameters are described in the text. Solid and dotted lines represent stable and unstable states, respectively.

