

Abstract
An appreciable fraction of the transcriptome differs in level of expression among individuals. Transcription factor (TF) expression and DNA binding causes cell-specific activation and repression of downstream targets, and TF expression levels vary across individuals. However, it is not clear how the strength of DNA binding for individual TFs translates into regulatory control, or whether a different set of binding motifs is used for strongly regulated modules. Here we integrate two publicly available data sets in Drosophila melanogaster, as well as conduct novel analyses, to address these questions.
Abundant genetic variation in early development transcription
All flies are not born the same; the genomes of two unrelated individuals randomly sampled in a natural population differ by >1 MB of DNA [1]. Even with imperfect tools to measure expression levels, transcript level differences among genotypes are also apparent for ∼10% of whole body transcriptome [2, 3]. Part of this expression variation might be neutral, that is compensated through the redundant structure of genetic networks. Transient deleterious or beneficial mutations, on their way to be selected out of the population or fixed, can explain some of the variation. Finally, some variation might be beneficial in a subset of fly environments, sexes, or social groups, and therefore maintained due to balancing selection. From general principles, one might expect less variation in expression during early embryonic development. Deviations might be more frequently deleterious than neutral, as this stage is important for formation of the basic body structure. We, however, found an abundance of expression variation among nine homozygous genotypes during the 5- and 8-hour timepoints of early development, including in segmentation genes and their downstream targets [4]. There might be multiple causes of this variation besides heritable differences, including maternal conditions, deviations in timing of egg development, other environmental and genetic factors, and interactions among them.
No matter what the causes of variation are, they give us tools to study how genes are co-perturbed in relation to each other. We found that TFs and the genes they control had been affected. Of the 5065 genes expressed in a majority of lines, 3754 showed significant variation among lines across both time points at P<0.05 (which corresponds to a false discovery rate of 6.7%). When genes regulate each other, their transcript levels are frequently co-affected, or they co-vary among the genotypes: for example, higher expression in upstream genes corresponds to higher expression in known downstream genes. We have seen similar patterns in the cascade of alternative-splicing that takes place in sex determination [5]. Although correlation does not equal causation, we are tempted to speculate that a larger amount of transcription (or splicing) factor results in stronger activation or repression (or more efficient splicing) of a downstream target. Here, we evaluate this hypothesis using publicly available data on the strengths of TF binding to thousands of their downstream targets.
Early development TFs are bound to thousands of targets, only some of which they regulate
The segmentation regulatory cascade is arguably one of the best-studied pathways in Drosophila melanogaster. It had been long thought that TFs in this cascade specifically interact with a handful of targets [6]. Several recent studies have challenged this viewpoint for these and other TFs [7, 8, 9, 10]. Chromatin immunoprecipitation (ChIP) experiments result in co-purification of specific transcription factors and the fragments of DNA they are bound with in vivo. This DNA, purified, can be hybridized to a tiling microarray (ChIP-chip) or directly sequenced (ChIP-Seq) for whole genome detection of the bound regions. The intensity of ChIP-purified DNA hybridization to a microarray serves as a proxy for the strength of binding with every bound site [8]. The TFs studied so far appear to be strongly bound to thousands of regulatory regions, and more weakly bound to up to tens of thousands more sites. Although surprising, this observation is not unexpected. Most eukaryotic TFs recognize short degenerate DNA motifs that occur frequently throughout the genome. From thermodynamic considerations, the majority of TF molecules are expected to be bound to DNA in a nucleus, rather than being free in a solution. Since many of the blastoderm factors are present at concentrations of many tens of thousands of molecules per cell, they must bind to any moderate to high affinity recognition sequences they can find [8]. The question then arises as to what fraction of these of binding sites regulate genes. One hypothesis is that many of the high affinity sites are important for regulation, and that the cell machinery somehow is capable of ignoring binding to lower affinity sites [10]. Using data on co-variation in expression between regulators and targets, we ask whether binding strength mediates the regulatory effect of TFs on direct targets.
Does the strength of TF binding correlate with the strength of regulation?
We have focused on combining two data sets. From one of them [4], we have information on the level of expression of TFs and all the genes they putatively regulate. Imagine, for instance, that in some of the nine genotypes, Bcd is expressed at higher levels compared with the rest of the genotypes. If Bcd activates downstream targets in a manner dependent on its level of expression [11], we might hope to detect higher expression of the target gene in the high Bcd genotypes (if it acts as an activator). The second data set we draw from is for the strength of binding of several of these same segmentation TFs with their downstream targets [8]. If our hypothesis that Bcd regulates only strongly bound sites, but does not affect expression through those bound weakly is correct [10], then Bcd upregulation should affect the downstream genes that are strongly bound, while effectively ignoring more weakly bound targets.
We integrated datasets for five of the TFs studied in Ref. [8] — the maternal factors Bicoid and Caudal, and the zygotic factors hunchback, Kruppel, and giant—and their putative downstream targets (knirps was excluded owing to the small number of high-confidence bound regions). For each TF-downstream target pair, we used two measurements: co-variance in expression levels among genotypes [4] and the strength of TF-binding [8]. We hypothesized that the co-variation and strength should themselves co-vary. Consistent with this hypothesis, we found highly significant correlations for all five transcription factors (Table 1, Supplementary Figure 1). (Note that the P-values are based on an assumption independence of gene expression levels, which is a typical assumption but not necessarily true [3]). For comparison, we also asked whether there was a relationship between co-variation in expression between TFs and their targets and the distance from the closest bound region to the target gene. Only one of the five comparisons was marginally significant, and all of the correlations were of appreciably smaller magnitude (Table 1).
Table 1.
Relationship between co-variation in expression and binding properties
| Transcription factor | Role | Number of Bound Sites | Correlation with binding strength (Significance) | Correlation with the Distance to the Gene (Significance) | Correlation with the Number of Binging Sites (Significance) |
|---|---|---|---|---|---|
| Bcd | maternal | 692 | 0.193 (1.08×10⁻⁵) | 0.026 (0.56) | 0.006 (0.89) |
| Cad | maternal | 1331 | 0.109 (1.34×10⁻³) | 0.033 (0.34) | -0.029 (0.39) |
| gt | zygotic | 966 | 0.106 (6.83×10⁻³) | 0.085 (2.91×10⁻²) | 0.074 (0.058) |
| hb | zygotic | 1788 | 0.106 (2.59×10⁻⁴) | 0.051 (8.04×10⁻²) | 0.005 (0.85) |
| Kru | zygotic | 2900 | 0.230 (2.20×10⁻¹⁶) | 0.009 (0.71) | 0.123 (1.58×10⁻⁷) |
The magnitude of the significant associations between binding strength and co-variation in expression is low, but the expectations above are clearly naïve at multiple levels. First, a TF acts in a spatially and temporally complex way, and a one-to-one correspondence in whole-egg extracted RNA samples would be astounding to detect. Second, and possibly more importantly, TFs exhibit both direct and indirect control over hundreds of genes. This indirect control can result in high co-variation in expression even with genes that are very weakly bound by the TFs themselves, but that might be strongly bound by an intermediate protein. Furthermore, many of these TFs control the same genes, and there is a significant overlap (sometimes as high as 80% [8]) between bound regions for the five transcription factors. Although this overlap does not change any of the correlations reported in Table 1, it might mean that each does not represent an independent data point. In any case, we conclude that TFs affect expression of their downstream targets with the strength of the binding being a mechanistically sound predictor for the strength of this effect, supporting the above hypothesis [10]. Larger, higher-power experiments will be required to test whether or not weakly bound sites are not regulated, or are weakly regulated.
Different binding motifs appear more or less susceptible to quantitative regulatory effects
Although these analyses demonstrate the predicted relationships between strength of binding and regulatory control, they do not reveal the mechanism(s) by which regulatory control is imposed. Previous analyses have shown that the strength of TF binding is correlated with the number of binding site motifs for a particular TF found in bound regions [8]. We further hypothesized that there might be specific binding site motifs over-represented in bound regions flanking genes that show strong regulatory control by TFs, providing a mechanistic link to regulatory control.
For all five TFs considered above, we counted the number of DNA motifs in high-confidence bound regions that were significant matches (P<0.05) to the experimentally determined position-specific weight matrices (PSWM) using the program Patser [12]. While the vast majority of bound regions did contain a recognizable motif matching the PSWM, not all did. We first asked whether the transcribed genes closest to bound regions containing even a single binding motif were more likely to show co-variation in expression with their TF. For 4 out of 5 TFs there was a highly significant relationship, with genes flanked by regions containing no binding sites being 75% less likely to co-vary with the TF (Supplementary Table 1).
Among bound regions that do contain a significant match to the DNA binding sites for each TF (i.e. the PSWM), we next asked whether there was a significant difference in the nucleotides used at each position of the binding site between genes that either do or do not co-vary with their TF. We used the program Two Sample Logo [13] to test for differences (using both a t-test and a multinomial sampling distribution), and found significant over- or under-representation of specific nucleotides in 4 out of 5 TF binding sites (Figure 1 and Supplementary Figure 2). These differences point to specific nucleotides that are more or less likely to be found in binding motifs flanking genes under strong regulatory control, but do not identify whole motifs associated with strongly regulated genes. In order to find such motifs, we looked for specific sequences matching the PSWM that are found in excess in those bound regions flanking genes that significantly co-vary with each TF. Considering only motifs found a minimum of 10 times, we found only one motif that was significantly over-represented: GGAAATTTTATTAC was more than three times more likely to be used near genes strongly regulated by Caudal than in bound regions not associated with regulatory control (P=1.5×10⁻⁷, χ2-test). Overall, these results show that there are specific DNA signals associated with transcriptional regulation that are not obvious when simply comparing bound vs. unbound regions.
Figure 1.
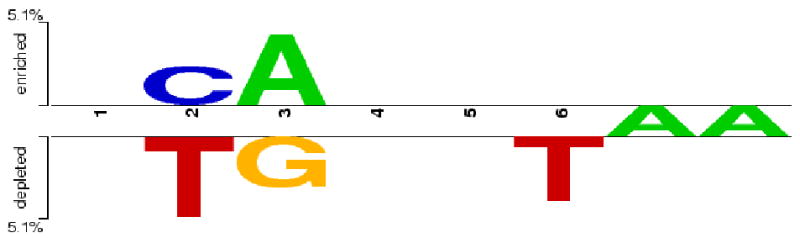
Over- and under-representation of nucleotides in binding site motifs. The graph shows those nucleotides either over-represented (‘enriched’) or under-represented (‘depleted’) in the motifs found in bound regions flanking genes that co-vary with the transcription factor Giant. The height of each letter represents the amount of over- or under-representation, with letters in-between the two lines representing invariant positions (i.e. the ‘A’ in positions 7 and 8 of the binding motif). All nucleotides shown are significant at P<0.05.
Concluding remarks
Modern genomic technologies have the ability to generate thousands of candidate genes for many biological processes, but validation of these candidates is still generally done via gene-by-gene perturbation. However, the variation found in nature represents a multifactorial perturbation experiment, potentially giving us the tools for multi-gene validation if we are able to appropriately connect genotype to phenotype [14]. Here, we showed that the patterns of co-variation among transcription factors and their target genes can establish the predictive power of binding strength and binding motifs for the strength of regulatory control. Future experiments using natural variation will further allow us to build up the causal networks underlying important phenotypes.
Supplementary Material
Acknowledgments
We thank C. Ganote for assistance, and S. MacArthur for providing the position-specific weight matrices. The authors are supported by NIH grant R01-GM076643.
Footnotes
Publisher's Disclaimer: This is a PDF file of an unedited manuscript that has been accepted for publication. As a service to our customers we are providing this early version of the manuscript. The manuscript will undergo copyediting, typesetting, and review of the resulting proof before it is published in its final citable form. Please note that during the production process errors may be discovered which could affect the content, and all legal disclaimers that apply to the journal pertain.
References
- 1.Begun DJ, et al. Population genomics: Whole-genome analysis of polymorphism and divergence in Drosophila simulans. PLoS Biol. 2007;11:2534–2559. doi: 10.1371/journal.pbio.0050310. [DOI] [PMC free article] [PubMed] [Google Scholar]
- 2.Jin W, et al. The contributions of sex, genotype and age to transcriptional variance in Drosophila melanogaster. Nature Genet. 2001;29:389–395. doi: 10.1038/ng766. [DOI] [PubMed] [Google Scholar]
- 3.Nuzhdin SV, et al. Common pattern of evolution of gene expression level and protein sequence in Drosophila. Mol Biol Evol. 2003;21:1308–1317. doi: 10.1093/molbev/msh128. [DOI] [PubMed] [Google Scholar]
- 4.Nuzhdin SV, et al. Abundant genetic variation in transcript level during early Drosophila development. Evol Develop. 2008;10:683–689. doi: 10.1111/j.1525-142X.2008.00281.x. [DOI] [PMC free article] [PubMed] [Google Scholar]
- 5.Tarone AM, et al. Genetic variation for expression of the sex determination pathway genes in Drosophila melanogaster. Genet Res. 2005;86:31–40. doi: 10.1017/S0016672305007706. [DOI] [PubMed] [Google Scholar]
- 6.Davidson EH. Genomic Regulatory Systems. Academic Press; 2001. [Google Scholar]
- 7.Zeitlinger J, et al. Whole-genome ChIP-chip analysis of Dorsal, Twist, and Snail suggests integration of diverse patterning processes in the Drosophila embryo. Genes Develop. 2007;21:385–390. doi: 10.1101/gad.1509607. [DOI] [PMC free article] [PubMed] [Google Scholar]
- 8.Li X, et al. Transcription factors bind thousands of active and inactive regions in the Drosophila blastoderm. PLoS Biol. 2008;6:e27. doi: 10.1371/journal.pbio.0060027. [DOI] [PMC free article] [PubMed] [Google Scholar]
- 9.Sandman T, et al. A core transcriptional network for early mesoderm development in Drosophila melanogaster. Genes Develop. 2009;21:436–449. doi: 10.1101/gad.1509007. [DOI] [PMC free article] [PubMed] [Google Scholar]
- 10.MacArthur S, et al. Developmental roles of 21 Drosophila transcription factors are determined by quantitative differences in binding to an overlapping set of thousands of genomic regions. Genome Biol. 2009;10:R80. doi: 10.1186/gb-2009-10-7-r80. [DOI] [PMC free article] [PubMed] [Google Scholar]
- 11.Schroeder MD, et al. Transcriptional control in the segmentation gene network of Drosophila. PLoS Biol. 2004;2:e271. doi: 10.1371/journal.pbio.0020271. [DOI] [PMC free article] [PubMed] [Google Scholar]
- 12.Patser software package (http://ural.wustl.edu/resources.html).
- 13.Vacic V, Iakoucheva LM, Radivojac P. Two Sample Logo: A graphical representation of the differences between two sets of sequence alignments. Bioinformatics. 2006;22:1536–1537. doi: 10.1093/bioinformatics/btl151. [DOI] [PubMed] [Google Scholar]
- 14.Rockman MV. Reverse engineering the genotype-phenotype map with natural genetic variation. Nature. 2008;456:738–744. doi: 10.1038/nature07633. [DOI] [PubMed] [Google Scholar]
Associated Data
This section collects any data citations, data availability statements, or supplementary materials included in this article.