

Abstract
Changes in the default mode network (DMN) have been linked to multiple neurological disorders including schizophrenia. The anticorrelated relationship the DMN shares with task‐related networks permits the quantification of this network both during task (task‐induced deactivations: TID) and during periods of passive mental activity (extended rest). However, the effects of different methodologies (TID vs. extended rest) for quantifying the DMN in the same clinical population are currently not well understood. Moreover, several different analytic techniques, including independent component analyses (ICA) and seed‐based correlation analyses, exist for examining functional connectivity during extended resting states. The current study compared both methodologies and analytic techniques in a group of patients with schizophrenia (SP) and matched healthy controls. Results indicated that TID analyses, ICA, and seed‐based correlation all consistently identified the midline (anterior and posterior cingulate gyrus) and lateral parietal cortex as core regions of the DMN, as well as more variable involvement of temporal lobe structures. In addition, SP exhibited increased deactivation during task, as well as decreased functional connectivity with frontal regions and increased connectivity with posterior and subcortical areas during periods of extended rest. The increased posterior and reduced anterior connectivity may partially explain some of the cognitive dysfunction and clinical symptoms that are frequently associated with schizophrenia. Hum Brain Mapp, 2010. © 2009 Wiley‐Liss, Inc.
Keywords: default‐mode network, schizophrenia, connectivity, deactivation, independent component analysis, fMRI
INTRODUCTION
The ability to define the neuronal basis of passive mental activity is of particular interest in disorders such as schizophrenia, in which the inability to differentiate between normal internal mentations and external stimuli (e.g., perceiving internally generated thoughts as externally generated auditory input) is a hallmark of the disorder [Linden, 2008]. Although early neuroimaging research focused on task‐related differences in functional activation [Ragland et al., 2007], more recent data suggests that patients with schizophrenia (SP) may also be characterized by abnormalities in resting state networks [Calhoun et al., 2008a, b; Garrity et al., 2007; Harrison et al., 2007; Zhou et al., 2007a, b]. Of all putative resting state networks [Damoiseaux et al., 2006; De Luca et al., 2006], the default mode network (DMN) has received the most attention due to its anticorrelated relationship with experimentally induced cognitive and sensory‐motor states [Fox et al., 2005].
In early neuroimaging studies, general linear model analyses were predominantly utilized to determine task‐related activity [Binder et al., 1999; Shulman et al., 1997]. These analyses consistently revealed a network of task‐induced deactivations (TIDs) during the transition between baseline and task states, which was later formalized as the DMN [Raichle et al., 2001]. However, the magnitude of TID has been shown to vary both as a function of task difficulty and of the person's ability to disengage from a task [Esposito et al., 2005; Greicius and Menon, 2004; McKiernan et al., 2003], suggesting that differences in TID may be either obscured or accentuated based on task performance in clinical populations. More recently, studies have begun to examine the DMN during extended periods of passive mental activity without the potential confounds of a task. Several analytic techniques, such as independent component analyses [ICA; Beckmann et al., 2005; Calhoun et al., 2008a; Jafri et al., 2008; McKeown et al., 2003; van de Ven et al., 2004] and seed‐based correlation techniques [Biswal et al., 1995; De Luca et al., 2006], have facilitated the analysis of extended resting state data. However, the strength of this methodological approach (i.e. the use of rest data) has also been viewed as a weakness due to the unstructured nature of the task and the possibility that clinical samples might engage in different internal mentations [Morcom and Fletcher, 2007].
A recent review article [Buckner et al., 2008] qualitatively compared the DMN network in healthy controls (HCs) during TID and with seed‐based (i.e., hippocampal seed) correlations. Results from both methods indicated a primary DMN subnetwork, consisting of the ventral medial prefrontal cortex, the anterior cingulate cortex (ACC), the posterior cingulate cortex (PCC), the bilateral inferior parietal lobes (IPLs), and the lateral temporal cortex, as well as a secondary DMN subnetwork, consisting of the hippocampal formation (HF) and parahippocampal cortices (PHCs). Network analyses suggested that while the ACC and PCC were the central hubs of this network; each hub displayed slightly different connectivity properties with other nodes, leading to speculation of different roles for the ACC and PCC in passive mental activity [Broyd et al., 2009]. In addition, a qualitative analysis indicated potentially greater volumes of functionally connected voxels in the IPL, prefrontal cortex, and HF in the seed‐based correlation methods compared to TID, although these results were potentially biased by the placement of the seed within the hippocampus. To date, we are unaware of a study comparing these two main methodological approaches (i.e., TID vs. extended rest) for DMN identification or the two main analytic techniques (ICA vs. seed‐based correlation) used to quantify the DMN during periods of extended rest in SP.
Studies examining DMN activity in SP using the TID methodology have produced mixed results. For example, one study found no significant differences in deactivation between SP and controls at lower cognitive loads during a working memory task [Pomarol‐Clotet et al., 2008]. However, at higher cognitive loads (two‐back vs. baseline), SP showed performance‐related decreases in activation in frontal task‐positive regions with concurrent decreases in deactivation of the medial frontal, ACC, anterior temporal, and right hippocampal regions. Another recent study, also utilizing a working memory paradigm, showed similar decreases in task‐related deactivation in the medial prefrontal cortex in SP and their first‐degree relatives [Whitfield‐Gabrieli et al., 2009]. However, these decreases in deactivation were present for both the zero‐ and two‐back conditions and were accompanied by increases in task‐related activation of the right dorsolateral prefrontal cortex for SP compared to HC. These findings highlight the complex interaction, which may exist between diagnosis and cognitive load in TID research. Other results suggest that while SP and controls have similar spatial deactivation maps during the performance of an auditory oddball task, SP took 2 s longer to return to baseline for the thalamus, PCC, and precuneus [Kim et al., 2009]. In contrast to the above results, Harrison et al. [ 2007] reported an overall increase in midline deactivation for SP during a multisource interference task in regions including the medial prefrontal cortex, ACC, and PCC. In addition, the magnitude of deactivation in the rostral ACC and medial prefrontal cortex was related to task performance in SP (i.e., greater deactivation indicated improved performance and increased emotional awareness), whereas controls showed a task‐related relationship with the PCC.
The results from studies examining connectivity during periods of extended rest in SP have also yielded variable results [Broyd et al., 2009]. Some findings provide evidence for global decreases in functional connectivity in SP compared to controls [Liang et al., 2006], the extent of which [Liu et al., 2008] was found to be positively correlated with illness duration. Similarly, Bluhm et al. [ 2007] found that SP had lower positive correlations between the PCC seed region and the ACC, and the middle temporal gyrus and the cerebellum, compared to controls, though no differences in the negative DMN correlations were found. This same study also identified a significant relationship between positive symptoms and PCC connectivity with speech‐related areas in the temporal gyrus, pointing toward the possibility that aberrant DMN connectivity with these temporal regions may play a role in positive symptom severity in SP. Finally, other research suggests higher and more variable frequency fluctuations within the DMN for SP, which in turn may explain the decreased functional connectivity reported for this group [Calhoun et al., 2008a; Garrity et al., 2007].
In contrast to the above results, other research has found evidence of increased connectivity within the DMN for SP, specifically between the PCC, medial prefrontal cortex, and inferior temporal gyrus [Zhou et al., 2007b]. In a study comparing the temporal relationships between several functional networks, Jafri et al. [ 2008] found evidence of increased connectivity between the DMN and other task‐positive resting state networks in SP, implying that SP have increased competition and anticorrelation (negative correlations) between these networks.
The primary aim of the current study was to contrast methods for identifying the DMN (TID vs. extended rest) in a population of SP and matched controls. Our second aim was to compare DMN activation during extended resting state using the two analytic techniques (ICA and seed‐based correlational techniques) most commonly used in the current literature. Although both ICA and seed‐based correlation analysis identify the DMN through temporal correlations, the concepts behind each are fundamentally distinct. The most central difference is that seed‐based techniques are sensitive only to temporal correlations with the chosen seed and are thus inherently biased to that particular region or voxel. In contrast, ICA is a data‐driven approach that identifies and separates temporally coherent networks based on all brain voxels. Our three primary hypotheses were that (1) SP would exhibit a reduction in the magnitude of DMN deactivation relative to controls, suggesting a failure to “turn off” the DMN during periods of cognitive demand; (2) SP would demonstrate decreased connectivity during periods of extended rest (e.g., decreased magnitude of temporal correlations) between the PCC and ACC; and (3) while both ICA and seed‐based correlation analysis would be able to reliably identify the DMN, ICA would be more sensitive to group differences in the network's functional (i.e. temporal) relationships.
METHODS
Subjects
All SP subjects were diagnosed by an experienced clinician (J.M.C.) or team member, with the Structured Clinical Interview for DSM‐IV Axis‐I Disorders, Clinician Version (SCID‐CV). Sixteen SP (15 males, 1 female) and sixteen HC (15 males, 1 female) participated in the current experiment. One HC was identified as an outlier (three standard deviations above the mean) on several behavioral measures and was therefore excluded from further analyses along with the matched SP. SP with a history of other neurological disease, history of psychiatric hospitalizations within the previous 6 months or history of substance abuse within the past year were excluded from the study. SP were also required to be stable on an atypical, antipsychotic medication (Aripiprazole: 4; Ziprasidone: 1; Risperidone: 5; Quetiapine Fumarate: 4; Olanzapine: 2) for at least 3 months to be included in the current study. All HCs were screened and excluded from the study based on a history of major medical conditions, neurological disease, major psychiatric disturbance, substance abuse, or psychoactive prescriptive medications usage. There were no significant differences (P > 0.10) between SP and the remaining HC for all major demographic categories including age (SP: 40.2 ± 8.2, HC: 40.1 ± 8.8), education (SP: 12.6 ± 2.4, HC: 13.0 ± 1.4), or handedness (SP: 77.7 ± 56.1, HC: 67.3 ± 68.9) as assessed by the Edinburgh Handedness Inventory [Oldfield, 1971]. Informed consent was obtained from subjects according to institutional guidelines at the University of New Mexico and the New Mexico Department of Veterans Affairs.
Task
Participants were scanned both at rest and while performing a task. The first data set consisted of three periods of extended rest (3 min each) in which participants simply maintained visual fixation on a white cross centered on a black background (visual angle = 1.54°). The second data set was collected as subjects performed a complex selective attention task [see Mayer et al. [ 2009] for complete details]. Briefly, participants were instructed to simultaneously tap fingers from both hands to auditory (1,000 Hz tone) and/or visual (flashing checkerboard; visual angle = 19.42° × 14.88°) stimuli presented for a period of 8 s. Each task was preceded by a cue signifying whether participants should attend and tap their fingers to the auditory stimuli while ignoring visual input (attend‐auditory), attend and tap to visual stimuli while ignoring auditory input (attend‐visual), or both (multimodal). In all conditions, auditory and visual stimuli were presented at 0.5, 1, or 2 Hz and could occur either in synchrony (multimodal condition) or out of phase (attend‐visual and attend‐auditory conditions). Between each block of the complex attention task, participants were asked to maintain visual fixation on a white cross (identical to that presented during extended rest, visual angle = 1.54°). The length of these baseline periods was pseudorandomly alternated between 10 and 14 s. For all subjects, the extended rest task was presented first followed by two runs of the complex selective attention task. This sequence was repeated three times for a total of three extended rest periods and six TID runs.
To reduce head motion during the scan, participants were required to practice the selective attention task twice outside of the scanning session. During the first practice session, participants performed the task until they were able to achieve basic task competency (∼5 min of practice). Participants then repeated the practice session with instructions to maintain their head in a fixed position while responding to task stimuli with both hands. There were no significant differences between SP and HC on any of the estimated motion parameter variables.
MR Data Acquisition
At the beginning of the scanning session, high‐resolution MPRAGE T1 [TE (echo time) = 4.76 ms, TR (repetition time) = 12 ms, 20° flip angle, number of excitations (NEX) = 1, slice thickness = 1.5 mm, FOV (field of view) = 256 mm, matrix size = 256 × 256] anatomic images were collected on a 1.5 Tesla Siemens Sonata scanner. For both the extended resting state and complex attention task a series of echo‐planar images were collected using a single‐shot, gradient‐echo echoplanar pulse sequence [TR = 2,000 ms; TE = 36 ms; flip angle = 90°; FOV = 256 mm; matrix size = 64 × 64]. A total of 28 sagittal 5‐mm‐thick slices were selected to provide whole‐brain coverage (voxel size: 4 × 4 × 5 mm3). Two hundred and three echoplanar images were collected during each complex attention run, and 92 echoplanar images were collected during each extended resting state run. For both tasks, the first three images of each run were eliminated to account for T1 equilibrium effects, leaving a total of 1,200 images for the complex attention task and 267 images for the extended resting state data.
Image Processing and Statistical Analyses
Functional images were generated and processed using a mixture of freeware and commercial packages including the Analysis of Functional NeuroImages (AFNI), GIFT, MATLAB (Mathworks, Sherborn, MA), and FSL. For both tasks, data was spatially registered in both two‐ and three‐dimensional space to minimize effects of head motion and temporally interpolated to correct for slice‐time acquisition differences (AFNI). Data were then de‐spiked, spatially blurred using an 8‐mm3 Gaussian full‐width half‐maximum filter kernel, and normalized to a standard stereotaxic coordinate space (performed in FSL) and resampled to 3‐mm isotropic voxels [Talairach and Tournoux, 1988].
A stereotaxically derived mask of DMN, based on the most commonly reported regions in the literature [Broyd et al., 2009; Buckner et al., 2008], was then constructed using the Wake Forest University (WFU) Pick atlas. The specific regions included in the mask were the bilateral PCC (BAs 23/31), inferior and superior parietal lobes (BAs 7/39/40), superior frontal gyrus (BAs 8/9/10), ACC (BAs 11/32), and parahippocampal gyrus. The ACC and PCC regions were weighted with a value of 3 given the central role of these regions in the DMN [Raichle et al., 2001] and to improve correspondence with functional activity [Franco et al., 2009]. The resultant mask was blurred with an 8‐mm3 Gaussian full‐width half‐maximum filter to match the input fMRI data.
The general steps used across methodologies and analytic techniques were extremely similar following the individual preprocessing steps described below. Voxelwise t‐tests were first conducted on unthresholded data to examine potential differences in the DMN between HC and SP (HC vs. SP). For all group comparisons, the resulting statistical parametric maps were corrected at P < 0.05 by applying a parametric threshold of P < 0.005 in conjunction with a minimal cluster size of 0.480 mL [Forman et al., 1995]. These two thresholds were derived from 10,000 Monte Carlo simulations that demonstrated the probability of obtaining a significant activation cluster for an entire volume (Type I error) as below 0.05 for both the task and the extended resting state data. In addition, the unthresholded data were also collapsed across both groups to obtain an overall DMN mask (again corrected at P < 0.05), which was then used for groupwise ROI analyses for each methodology and analytical technique. Parameters of interest in the group ROI analyses included the total number of activated voxels, the spatial goodness of fit (e.g., between individual DMN and WFU mask), average magnitude of deactivation (TID analysis only), and the magnitude of temporal correlation (extended resting state data only). The overall masks were also used to identify common DMN regions across methodologies and analytical techniques.
TID Analysis
A deconvolution analysis was used to generate one hemodynamic response function (HRF) for each selective attention condition on a voxelwise basis (AFNI). Each HRF was derived from the first 12 images (22 s) following the onset of the cue. The images corresponding to the peak of the HRF (8–14 s poststimulus onset) were summed and divided by the baseline to obtain an estimate of percent signal change. Voxelwise t‐tests were then conducted to determine differences in the magnitude of deactivation (i.e., percent signal change) across the two groups. Similar to the groupwise comparisons, each subject's data was parametrically thresholded at P < 0.005 with a minimal cluster size of 0.480 mL. Next, the unthresholded percent signal change estimates (all selective attention conditions) were pooled across all subjects (SP + HC) and tested against the null hypothesis to produce the overall DMN TID mask. This mask was then used in conjunction with each subject's thresholded data to determine the number of active voxels and the average magnitude of activation/deactivation in activated voxels on a per‐subject basis.
Extended Resting State Analyses: Independent Component Analysis
The GIFT software package was used to perform a group ICA for all subjects (SP + HC) as a first step for identifying the DMN during extended periods of rest [Calhoun et al., 2001]. A modified minimum description length (MDL) criterion was used to establish the ideal number of independent components for the group ICA, which was estimated to be sixteen [Li et al., 2007]. The resulting 16 components were correlated with the DMN mask derived from the WFU atlas to objectively determine which group component exhibited the highest spatial correlation. Back‐reconstruction was used to select each individual subject's component that corresponded with the group DMN component. Components were then scaled to an empirically derived z‐score by dividing by the standard deviation of the original time sequence. In the ICA framework, the empirical z‐scores approximate the temporal correlation (magnitude of the z‐score indicates strength of the linear relationship) between each voxel and the associated component and can therefore be either positive or negative. Voxelwise t‐tests were then conducted to investigate potential differences in the magnitude of correlation across the two groups (corrected at P < 0.05). In addition, the spatial correlation between each subject's DMN component and the WFU mask was also determined. The data from each individual subject component image were then thresholded so that only the top 5% of voxels remained.
An overall ICA DMN mask was created by comparing all subjects' components (collapsed across group) against a null hypothesis of zero and selecting significant voxels at a corrected alpha of P < 0.05. Similar to the TID analysis, the overall group DMN mask was multiplied by the thresholded individual components to determine the total number of active voxels within the mask and the average z‐score of these voxels.
Extended Resting State Analyses: Seed‐Based Correlations
For the seed‐based analysis, a regression analysis was first conducted on individual subjects' time‐series data to remove potential sources of physiological and machine noise [Fox et al., 2005]. First, individual anatomical images (i.e., T1) were segmented into maps of white matter, gray matter, and cerebral spinal fluid (CSF) using FSL's FAST algorithm [Zhang et al., 2001]. Second, the resultant CSF and white matter masks were used to obtain an average time‐series for these tissues on an individual basis. All six movement parameters, the ROI‐based time‐series for CSF and white matter, a constant term, and a linear term were then entered into a linear regression against the extended resting state time‐series [Fox et al., 2005]. Gray matter was not utilized as a global signal regressor, given existing evidence that this may introduce spurious anticorrelations into the data [Murphy et al., 2009]. The resulting residualized time‐series were then concatenated and used in the connectivity analyses.
Spheres with a 14 mm diameter were created in the ACC [center of sphere: x = 0, y = 37, z = 20; Talairach and Tournoux atlas coordinates [Talairach and Tournoux, 1988]] and the PCC (x = 0, y = −49, z = 24) to form the ROIs necessary for a seed‐based analysis. The centroids for these spheres were based on spatial locations of anterior and posterior cingulate activity in the TID analysis (setting x = 0). Next, the average time‐courses within the ACC and PCC were computed by averaging the time‐series data for all voxels in the ROI spheres. Subsequently, each of these two averaged time‐courses was then correlated with all brain voxels. The resultant r values were then transformed into Fisher's z values. In the seed‐based correlation framework, the individual Fisher's z value approximates the temporal correlation between each voxel and the associated seed and therefore can be either positive or negative. Voxelwise t‐tests were then conducted to determine groupwise differences in the magnitude of the Fisher's z values. In addition, the spatial correspondence between each subject's correlational map and the WFU mask was also determined. Individual subject correlation maps were thresholded using similar parametric and spatial thresholds as the groupwise comparisons.
An overall DMN mask for the seed‐based analyses was created by contrasting all subjects' maps against zero and correcting for false positives, which was then used to determine ROI parameters identical to those used in the ICA.
RESULTS
Behavioral Analyses
Two 2 × 3 × 3 [Group (SP vs. HNV) × Attention Condition (multimodal, attend‐auditory, attend‐visual) × Frequency (0.5, 1, 2 Hz)] mixed‐measures ANOVAs were conducted with the coefficient of variation (COV) and error data as the dependent variables for the task data. In the context of the current task, COV is a measure of variability in performance that is most likely attributable to increased distractibility [Mayer et al., 2009]. Only the results pertaining to group differences will be reported for the purpose of the current study. The COV analysis showed a significant main effect of group (F 1,28 = 6.45, P < 0.05) with SP (0.18 ± 0.03) displaying more variable response times across all conditions compared to HC (0.15 ± 0.02). Neither the group by condition nor the group by frequency interaction was significant. In the error analysis, the main effect of group and the interactions were not significant (P > 0.10).
DMN Across Methodologies
To reduce redundancy in the presentation of results, we first briefly describe the regions (Fig. 1; Table I) that were shown to have significant overlap across both groups during the TID and the two extended resting state data analyses (ICA and seed‐based correlations). Commonly identified DMN regions included the medial and superior frontal gyrus (BAs 8/9/10/11/6), ACC (BAs 24/32), PCC (BAs 29/30/23) extending to the precuneus (BA 31), and bilateral middle and superior temporal gyrus (BAs 39/19) continuing into the angular gyrus. In addition, all three methods also identified areas of significant overlap within the left inferior frontal gyrus (BA 47), the left medial temporal lobe (BAs 34/35), and the right inferior and middle temporal gyrus (BAs 20/21).
Figure 1.
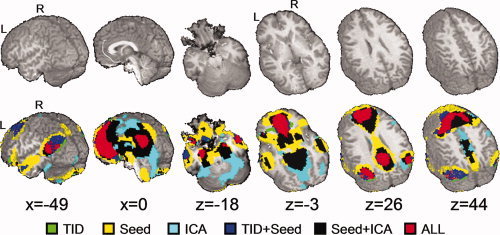
A map of the overall task‐induced deactivation (TID), connectivity observed during seed‐based correlations (seed), and connectivity observed during independent component analyses (ICA). The color‐coding scheme displayed in the legend characterizes the various combinations of activation. T1 structural images are provided as an anatomical reference. The locations of sagittal (x) and axial (z) slices are given according to the Talairach atlas.
Table I.
Common regions of activation across both methods and analytic techniques
| Region | Side | BAs | x | y | z | Volume (mL) |
|---|---|---|---|---|---|---|
| Frontal lobe | ||||||
| Anterior midline | M | 8/9/10/11/6/24/32 | −3 | 39 | 21 | 65.880 |
| Inferior frontal gyrus | L | 47 | −34 | 30 | −11 | 1.566 |
| Temporal lobe | ||||||
| Temporal/IPL | R | 39/19 | 46 | −67 | 25 | 2.268 |
| L | 39/19 | −43 | −65 | 24 | 6.966 | |
| Medial temporal lobe | L | 34/35 | −24 | −11 | −19 | 1.539 |
| Inferior/middle temporal gyrus | R | 20/21 | 55 | −7 | −19 | 1.431 |
| Parietal lobe | ||||||
| Posterior midline | M | 29/30/23/31 | −2 | −50 | 24 | 12.960 |
Note: Side refers to the hemisphere showing activation, where M = midline, L = left, and R = right hemisphere. The Brodmann area (BA), the center of mass in Talairach coordinates (x, y, z) and volume are specified for each area of activation.
Both the seed‐based analysis and ICA identified significant DMN connectivity within right inferior frontal gyrus (BA 47), right medial temporal lobe (BAs 34/35), bilateral middle/superior temporal gyrus (BAs 21/22), thalamus, striatum, and cerebellum. The seed‐based and TID analyses identified the left inferior/middle temporal gyri (BA 21). Functionally connected regions specific only to the ICA included the right pre‐ and postcentral gyri (BAs 1/2/3/4), right fusiform gyrus (BA 37), and extensive areas within bilateral occipital lobes (BA 18) and cerebellum. Finally, seed‐based correlation analyses uniquely identified DMN connectivity in the bilateral cerebellar tonsil.
TID Results
Results from the independent samples t‐test indicated that there were no significant voxelwise differences in DMN activity across the two groups. Two ANOVAs were then conducted to determine if either the overall magnitude of deactivation or the number of deactivated voxels within the TID network (identified with pooled‐group mask) differed as a function of diagnosis or rate of stimulation. Results from the first ANOVA indicated that the main effect of group was significant (F 1,27 = 4.3, P < 0.05), with the magnitude of deactivation being significantly greater in the DMN network for SP (mean = −0.329 ± 0.087) compared to HC (mean = −0.270 ± 0.064). In spite of the apparent qualitative differences in the greater volume (e.g., number of voxels) of deactivation for SP (see Fig. 2), the effect of group was not statistically significant (P > 0.10) for the ANOVA. This was likely a result of the large degree of variability in this measure for both the SP (mean = 2,179.9 ± 1,068.3) and HC (mean = 1,612.4 ± 1,031.2), which resulted in a moderate effect size (Cohen's d = 0.54), but no significant group differences.
Figure 2.
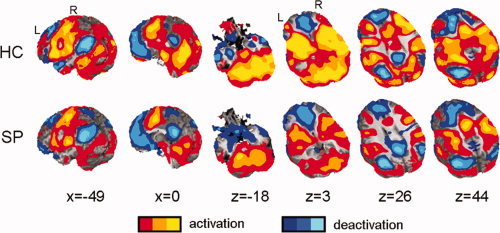
Regions exhibiting significant task‐induced activation (warm colors) and task‐induced deactivation (TID; cold colors) for both patients with schizophrenia (SP) and healthy controls (HCs). The locations of sagittal (x) and axial (z) slices are given according to the Talairach atlas.
Extended Resting State Data: ICA Voxelwise Results
For the extended resting state analyses, group ICA was first performed on the collapsed group data followed by a spatial correlation with the WFU mask to objectively determine the component that most closely corresponded to the DMN [Franco et al., 2009; Greicius and Menon, 2004]. Results indicated two components that were highly correlated with the WFU mask and primarily differed by the relative contribution of either anterior (r = 0.52) or posterior (r = 0.49) clusters (mean correlation for remaining components = 0.13 ± 0.09). The anterior component was composed of large clusters of bilateral connectivity within the ACC, medial and superior frontal cortex, inferior frontal gyrus, and bilateral PCC extending into the paracentral lobule. Additional regions of connectivity included small clusters within bilateral inferior/superior occipital gyrus. In contrast, for the posterior component, the volume of connectivity was relatively small within the midline and lateral frontal structures. Instead, large clusters of connectivity were present within the bilateral PCC, precuneus, medial temporal lobe, and ventral visual stream. Common areas of connectivity across both components included the middle/superior temporal gyrus, striatum, thalamus, and cerebellum.
Following component identification, voxelwise t‐tests were then conducted on the individual subject component z‐score to investigate potential group differences for both the anterior and posterior component (Table II; Fig. 3). Results are classified according to whether the regions were positively or negatively related to the component (direction of the z‐score) and whether the magnitude of the z‐score was greater for the SP or HC. Finally, several regions exhibited a variable pattern in which the data from one group was positively correlated while the data from the other group was negatively correlated. For the anterior component, results indicated greater positive z‐scores for the SP group in the left middle temporal gyrus, angular gyrus, and bilateral anterior nucleus of the thalamus. A more negative z‐score for the SP group was seen in the left insula (BA 13) extending to the superior temporal gyrus, left middle temporal gyrus (BA 21), and the left cerebellar tonsil and culmen. There were no areas in which HC exhibited a significantly stronger relationship with the anterior component.
Table II.
Voxelwise group comparisons of ICA results
| Region | Side | BAs | x | y | z | Volume (mL) | Direction |
|---|---|---|---|---|---|---|---|
| Anterior component | |||||||
| Positive z‐score | |||||||
| Middle temporal gyrus and angular gyrus (e) | L | −42 | −65 | 27 | 0.594 | SP > HC | |
| Anterior nucleus of the thalamus (d) | M | −4 | −6 | 17 | 1.701 | SP > HC | |
| Negative z‐score | |||||||
| Insula and superior temporal gyrus (c) | L | 13 | −45 | −14 | 7 | 1.458 | SP > HC |
| Middle temporal gyrus (a) | L | 21 | −42 | −3 | −24 | 1.080 | SP > HC |
| Cerebellar tonsil and culmen (b) | L | −26 | −48 | −34 | 3.564 | SP > HC | |
| Posterior component | |||||||
| Positive z‐score | |||||||
| Precuneus and angular gyrus (n) | R | 19/39 | 37 | −70 | 37 | 1.053 | SP > HC |
| Negative z‐score | |||||||
| Inferior frontal gyrus (k) | R | 46 | 42 | 34 | 6 | 0.513 | HC > SP |
| Middle/superior temporal gyrus (g and h) | R | 21/38 | 52 | 1 | −11 | 0.945 | SP > HC |
| L | 22 | −55 | −40 | 7 | 0.540 | SP > HC | |
| Variable z‐scores | |||||||
| PCC and precuneus (m) | L | 31 | −10 | −50 | 29 | 0.621 | |
| Middle frontal gyrus (f and l) | L | 11 | −37 | 44 | −9 | 0.972 | |
| L | 10 | −35 | 36 | 14 | 0.513 | ||
| Medial frontal and ACC (o) | L | 6 | −16 | −2 | 55 | 0.621 | |
| Middle occipital and inferior temporal gyrus (j and i) | R | 19 | 42 | −74 | 2 | 0.810 | |
| L | 19/39 | −40 | −65 | 7 | 2.106 |
Note: Side refers to the hemisphere showing activation, where M = midline, L = left, and R = right hemisphere. The Brodmann area (BA), the center of mass in Talairach coordinates (x, y, z), and volume are specified for each area of activation. Letters within parentheses in the first column correspond to regions of activation in Figure 3.
Figure 3.
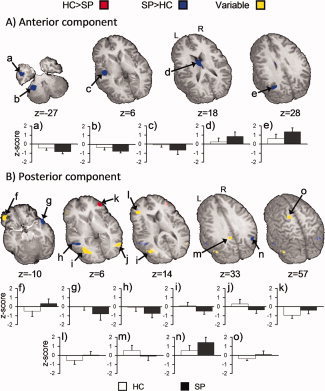
Regions that exhibited significant groupwise differences during independent component analyses (Panel A = anterior component and Panel B = posterior component). Red (HC > SP) and blue (SP > HC) coloring denotes regions for which significant group differences were observed, and the z‐scores from both groups were either positive or negative. Yellow colorings indicate regions for which significant differences were observed, but the z‐scores from both groups were in opposite directions (i.e., one positive and one negative). Regions displaying functional connectivity correspond to letters provided in the first column of Table II. For both panels white and black bars represent the mean z‐score for HC and SP, respectively (error bar = standard deviation). The locations of axial (z) slices are given according to the Talairach atlas.
The results of the t‐tests on the more posterior ICA component indicated that SP had a greater positive z‐score than HC in the right precuneus and angular gyrus (BAs 19/39). A greater negative z‐score was observed for HC in the right inferior frontal gyrus (BA 46) compared to SP. In contrast, SP showed a greater negative z‐score in the right (BAs 21/38) and left (BA 22) middle and superior temporal gyri. Though SP and HC showed a similar magnitude of relationship between the PCC component and the right middle occipital/inferior temporal gyri (BA 19), the relationship was positive for HC and negative for SP. Alternately, SP exhibited a negative, and HC a positive, relationship with the left middle frontal gyrus (BA 11). There were three areas in which HC exhibited strong relationships with the posterior component while SP showed minimal to no relationship. These areas included the left middle frontal gyrus (BA 10) and the left medial frontal and anterior cingulate gyri (BA 6) where HC had higher negative z‐scores; and the left PCC/precuneus (BA 31) where HC had higher positive z‐scores. Finally, though HC exhibited almost no relationship between the PCC and the left middle occipital and inferior temporal gyri, SP shared a moderate negative relationship with those areas.
Extended Resting State Data: Seed‐Based Voxelwise Results
ACC and PCC seed‐based correlational analyses were also conducted on the extended resting state data. Similar to previous reports [Uddin et al., 2009], the network of regions that exhibited a positive correlation with the ACC and PCC seeds were very similar and closely corresponded to the common DMN reported above. Likewise, this technique also resulted in a large network of anticorrelated (e.g., negative correlations) regions in the frontal, temporal, parietal, and occipital lobes for both the ACC and PCC clusters, which have been previously discussed in other publications [Fox et al., 2005; Uddin et al., 2009].
Two voxelwise t‐tests examined differences in connectivity between SP and HC using either the ACC or the PCC as the seed region (Table III; Fig. 4). SP exhibited a greater correlation between the ACC and the left caudate and bilateral thalamus. In contrast, HC exhibited a greater correlation between the ACC and the left middle/superior temporal gyri (BA 39). Similar to the ICA, there were regions where the groups exhibited opposing directional relationships. Specifically, HC showed a positive correlation between the ACC seed and the left insula and claustrum (BA 13), while SP showed a negative correlation between these regions.
Table III.
Voxelwise group comparisons of seed‐based correlation results
| Region | Side | BA | x | y | z | Volume (mL) | Direction |
|---|---|---|---|---|---|---|---|
| ACC seed | |||||||
| Positive z‐score | |||||||
| Caudate and thalamus (c) | L | −6 | −6 | 18 | 2.646 | SP > HC | |
| Middle/superior temporal gyrus (b) | L | 39 | −47 | −50 | 12 | 0.729 | HC > SP |
| Variable z‐scores | |||||||
| Insula and claustrum (a) | L | 13 | −39 | −17 | 8 | 0.621 | |
| PCC seed | |||||||
| Negative z‐score | |||||||
| Precentral and medial frontal gyrus (j) | R | 6 | 14 | −18 | 63 | 0.513 | SP > HC |
| Superior/transverse temporal gyri and insula (f and e) | R | 41/13 | 41 | −20 | 7 | 2.835 | SP > HC |
| L | 41/13 | −44 | −20 | 16 | 2.376 | SP > HC | |
| Posterior parietal lobules and postcentral gyrus (i) | L | 40/2/5 | −29 | −40 | 58 | 0.972 | SP > HC |
| Variable z‐scores | |||||||
| Caudate and thalamus (h and g) | R | 18 | −8 | 17 | 0.648 | ||
| L | −8 | −9 | 16 | 0.864 | |||
| Lingual gyrus, declive and uvula of cerebellum (d) | M | 1 | −71 | −24 | 2.349 |
Note: Side refers to the hemisphere showing activation, where M = midline, L = left, and R = right hemisphere. The Brodmann area (BA), the center of mass in Talairach coordinates (x, y, z) and volume are specified for each area of activation. Letters within parentheses in the first column correspond to regions of activation in Figure 4.
Figure 4.
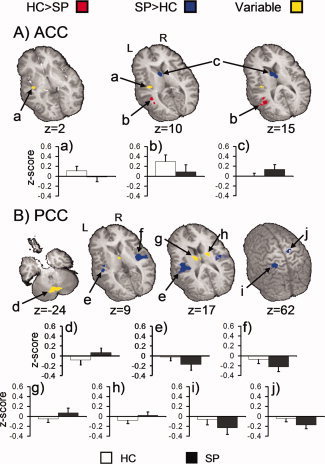
Regions showing significant group differences for both the anterior (ACC; Panel A) and posterior cingulate (PCC; Panel B) seeds. Red represents regions where healthy controls (HC) exhibited higher correlation values (positive or negative indicated by the corresponding graph) compared to SP. Blue represents regions with higher correlation for SP. Yellow indicates voxels where group findings occurred in opposite directions. Functionally connected areas correspond to the letters provided in the first column of Table III. For both panels white and black bars represent the mean z‐score for HC and SP, respectively (error bar = standard deviation). The locations of axial (z) slices are given according to the Talairach atlas.
The PCC connectivity analysis indicated significantly greater negative correlations for SP compared to HC within the right precentral and medial frontal gyrus (BA 6), the left posterior parietal lobules (BA 40) extending to the postcentral gyrus (BAs 2/5), and the bilateral auditory cortical areas (superior/transverse temporal gyri, BA 41) and insula (BA 13). There were also regions where the groups exhibited opposing directional relationships. SP showed positive correlations between the PCC seed and the midline cerebellar structures and also subcortical regions (bilateral caudate and thalamus), while HC showed negative correlations with these same regions.
Extended Resting State Data: ROI Results
Three MANOVAs were then conducted to examine if the number of active voxels, temporal correlation, and goodness of fit (the three dependent measures derived from both ICA and seed‐based correlation analysis) varied as a function of group across the entire DMN. The MANOVA examining the number of significantly activated voxels indicated a significant multivariate effect of group (F 4,25 = 4.0, P < 0.05). Univariate tests indicated that SP (mean = 1,847.5 ± 160.1) had significantly more active voxels than HC (mean = 1,629.4 ± 172.9) in the posterior DMN ICA component (F 1,28 = 12.9, P < 0.005), but not in the anterior DMN ICA component (P > 0.10). Univariate tests for either of the seed correlation analyses were not significant (P > 0.10), and the effect sizes were small.
A similar pattern of results was obtained for the MANOVA examining the spatial goodness of fit (e.g., correlation) between each of the components and the DMN template constructed with the WFU mask. Specifically, the multivariate effect for group (F 4,25 = 3.7, P < 0.05) and the univariate tests for the ACC ICA component (F 1,28 = 4.7, P < 0.05) and PCC ICA component (F 1,28 = 4.6, P < 0.05) were all significant. Once again, the direction of effects for these two structures were reversed, with HC (mean = 0.50 ± 0.04) exhibiting a better overall fit with the DMN template for the anterior component compared to SP (SP mean = 0.47 ± 0.05), and SP (mean = 0.44 ± 0.05) exhibiting a better overall fit with the posterior component compared to HC (mean = 0.39 ± 0.06). Univariate tests for either of the seed correlation analyses were not significant (P > 0.10).
Finally, the multivariate effect of group was not significant for the MANOVA examining the magnitude of temporal correlation between groups (P > 0.10). However, there was a nonsignificant trend for both the ACC ICA component (F 1,28 = 3.7, P = 0.07) and the seed‐based ACC component [F 1,28 = 2.9, P = 0.10] for univariate effects. In both methodologies, the magnitude of the temporal correlation was higher for HC compared to SP in the anterior network.
DISCUSSION
There is growing evidence indicating that the DMN may be typified by more than one functional network [Buckner et al., 2008; Calhoun et al., 2008a; Damoiseaux et al., 2006], including a more anterior and posterior network [Broyd et al., 2009; Buckner et al., 2008]. As other studies have intimated [Broyd et al., 2009; Foucher et al., 2005; Garrity et al., 2007; Uddin et al., 2009], deficiencies in the DMN and its modulation between rest and task states may be the result of increased temporal coherence between some nodes of the DMN (the PCC and temporal, occipital, and thalamic regions) and equivalent or decreased connectivity between other nodes (ACC, PCC, and frontal regions). The primary objective of this paper was to compare common methods and analytic techniques used to identify the DMN during both task and extended resting states and to examine how the results from these methodologies might differ in a clinical sample. In general, current results indicated increased functional connectivity within more posterior (i.e., nonfrontal) cortical and subcortical regions for SP, whereas HC tended to exhibit either similar (no statistically significant differences) or greater connectivity within frontal cortical regions. In addition, TID was also greater for SP compared to HC. Finally, the results from our pooled analyses (HC + SP) also revealed several important findings, which are briefly discussed first.
The first finding from the pooled analyses pertained to the reliable deactivation of the ACC, PCC/precuneus, and bilateral superior temporal lobe/IPL in the general linear tests (TID), and the significant functional connectivity displayed between these same regions in both the seed‐based correlation analyses (extended rest) and ICA (extended rest). Although the spatial extent (i.e., volume) of connectivity within these structures was greater for the ICA and seed‐based analysis than for TID, the consistency of findings across various methodologies and analytic techniques confirms that these structures form the key nodes of the DMN [Buckner et al., 2008]. In contrast, the identification and volume of DMN involvement within the temporal lobe and subcortical structures was much more variable (see Fig. 1). Specifically, while all methods and analytic techniques identified the left medial temporal lobe (HF and PHC), only the extended resting state techniques (seed‐based analysis and ICA) identified significant correlations within the right medial temporal lobe and bilateral middle temporal gyri. A finding of more variable involvement of temporal lobe structures in the DMN is consistent with previous reports [Buckner et al., 2008]. This is notable given that previous studies [cited in Buckner et al. [ 2008]] utilized hippocampal seeds, which would be expected to correlate more with medial temporal and temporal regions than the midline (ACC and PCC) seeds utilized in the current study. Collectively, current and previous results suggest that the medial temporal structures may form a subnetwork of the DMN [Buckner et al., 2008] that is more readily observed using ICA and seed‐based correlation techniques than through TID. Deactivation of temporal structures during typical functional imaging studies may be dependent both on the type of task and on the contrasting baseline state [Stark and Squire, 2001]. A similar caveat may also apply to the striatum and thalamus, both of which showed substantial connectivity in the seed‐based analyses and ICA, but were noticeably absent in the TID analyses.
In addition, our group ICA revealed an anterior DMN component and a posterior DMN component both of which were highly correlated with the template mask. The finding of a split DMN component is not unique to the current study [Calhoun et al., 2008a; Damoiseaux et al., 2006; Sambataro et al., in press; van de Ven et al., 2004] and is of interest given the different putative roles that the ACC and PCC may play during passive mental activity [Broyd et al., 2009; Uddin et al., 2009]. Previous work on HCs suggests that the PCC (e.g., central hub of the posterior DMN) is actively involved in the simultaneous monitoring of endogenous and exogenous states including performance error [Eichele et al., 2008] and attentional drifting [Weissman et al., 2006]. In contrast, the anterior hub of the DMN (ACC) has been linked with appraisal of our own and others' psychological states [Broyd et al., 2009] as well as levels of emotional awareness and task performance in SP [Harrison et al., 2007]. Finally, the PCC has been shown to have greater connectivity with medial temporal structures (HF and PHC) compared to the ACC [Buckner et al., 2008].
DMN in Patients With Schizophrenia
Different patterns of anterior–posterior DMN connectivity were also observed between SP and HC in the extended resting state ROI analyses. Specifically, across both analytic techniques (seed‐based analysis and ICA) and experimental variables, controls exhibited increased or equal DMN connectivity in frontal cortical regions (HC ≥ SP) compared to increased posterior cortical and subcortical connectivity for SP (SP ≥ HC). The direction of these findings was consistent both in terms of the extent of connectivity (number of voxels) and spatial correlation, and showed a similar directional trend in terms of temporal correlation. ROI analyses of the anterior ICA component indicated that HC exhibited a higher spatial correlation than SP. Likewise, HC exhibited a trend for greater temporal connectivity within the anterior DMN for both the ICA and seed‐based techniques. In contrast, ROI analyses for the posterior ICA component indicated that SP exhibited a greater number of active voxels and a higher spatial correlation than HC.
Voxelwise comparisons of the extended resting state data revealed a similar anterior–posterior distinction as ROI analyses. Consistent with previous studies [Bluhm et al., 2007; Broyd et al., 2009; Liang et al., 2006], HC exhibited increased connectivity (larger z‐scores) compared to SP within several regions of the medial and lateral frontal cortex for the posterior ICA analyses. In contrast, increased connectivity for SP compared to HC was observed in several posterior (e.g., nonfrontal) cortical and subcortical regions, both during extended resting state analyses. ICA results indicated greater connectivity for SP within posterior regions such as the middle temporal gyrus, thalamus, superior temporal gyrus, and cerebellum for the anterior component. Likewise, SP had higher positive z‐scores than HC for the posterior component in the right angular gyrus and precuneus and, interestingly, showed a much stronger negative relationship with bilateral middle/superior temporal and left middle occipital gyri, regions where HC exhibited almost no relationship. The PCC seed‐based analyses resulted in greater anticorrelations for SP within the left posterior parietal cortex and bilateral auditory cortex.
The combination of reduced frontal connectivity and heightened posterior connectivity may partially explain why SP are both more prone to cognitive deficits and more likely to experience unusual sensory events. As suggested by current and previous work [Bluhm et al., 2007], increased connectivity (positive or negative) between the posterior node of the DMN (centered around the PCC) and regions typically associated with auditory input may play a role in SP difficulty distinguishing between normal internal mentations and external stimuli. In contrast, reduced connectivity between frontal regions may partially explain the deficits in attentional, working memory and executive functioning that have come to characterize SP and their first‐degree relatives [Bowie and Harvey, 2005; Filbey et al., 2008; Luck and Gold, 2008], and were present during the current study (i.e., increased variability in performance during selective attention task). In addition, reduced frontal connectivity may play a role in SP inability to modulate the DMN efficiently during task [Ragland et al., 2007] as was suggested by both our TID analyses.
Contrary to our original hypothesis, the magnitude of TID (i.e. percent signal change) was significantly greater for SP, suggesting that patients disengaged the DMN more than HC. Although a quantitative examination of the number of deactivated DMN voxels during task did not reach conventional levels of statistical significance, the overall volume of deactivation was larger for SP compared to HC, while task‐related activation appeared to be more widespread for HC (see Fig. 2). However, impairments in performance (i.e. increased variability of response time) were observed in SP, making it difficult to determine whether disparities in TID were attributable to performance or whether performance was adversely affected by abnormal TID. As noted in the Introduction, previous studies have reported increased TID, decreased TID, or a mixture of both in different neuronal structures for SP compared to HC [Garrity et al., 2007; Harrison et al., 2007; Pomarol‐Clotet et al., 2008; Whitfield‐Gabrieli et al., 2009]. Although these mixed findings render a simplistic explanation difficult, current and previous results suggest that SP may exhibit a heightened DMN state, which proactively interferes with task performance [Garrity et al., 2007; Pomarol‐Clotet et al., 2008; Whitfield‐Gabrieli et al., 2009]. However, this relationship may be dependent on the cognitive load [McKiernan et al., 2003; Pomarol‐Clotet et al., 2008] and the type of task [Gusnard et al., 2001; Tomasi et al., 2006].
The primary limitation of the current study was the sample size. Several of the findings in the ROI analyses displayed moderate effect sizes, suggesting that these results would have likely reached conventional levels of statistical significance with a larger sample size. Additionally, the direction of the effect sizes was consistent with the observed pattern of increased anterior connectivity for HC and reduced posterior connectivity for SP, suggesting that increasing the sample size would only increase the robustness of current findings. Other limitations include the possibility that the current results were influenced by systematic differences in morphological brain structure often observed in SP [Honea et al., 2005] or that these results may be secondarily related to the effects of antipsychotic medications.
Finally, although several consistencies were found across all three DMN measures (similar spatial maps, increased posterior and subcortical connectivity for SP, and increased frontal connectivity for HC), some differences in the results were also present. Specifically, the greatest discrepancy between the two extended rest analytic techniques was the more variable location of voxelwise differences in functional connectivity between the two groups, which have several potential explanations. Seed‐based correlation involves choosing a particular region of interest and then correlating the remaining brain voxels with the averaged timecourse of that particular region (or subsection of that region). Thus, this method is biased not only to the region chosen (e.g. ACC, PCC, or hippocampus) but to the location of the seed within that region (e.g. rostral vs. caudal ACC). Thus, the placement of the seed may partially explain why some of the subtle group differences in functional connectivity did not converge across the two analytic techniques in identical spatial locations. In contrast, ICA provides a measure of the strength of temporal relationships between voxels that is based on commonalities in signal properties across the entire brain, which allows this technique to identify and separate multiple independent networks simultaneously. The criterion of independence inherent to ICA may be ideal for more global (e.g. multinetwork) analyses, but may not provide any advantage for the examination of region‐specific hypotheses that are not as concerned with the autonomy of a given network.
In terms of method, both extended resting state analyses identified important group differences on the voxelwise level, which were not evident in the TID analyses. However, it is likely that the information derived from TID compared to extended resting states may be fundamentally different and potentially complementary. TID analyses may be better suited for measuring the magnitude of deactivation in functional networks, whereas extended rest analyses may excel at identifying intrinsically correlated (positive and negative) regions given that one does not need to account for the presence of a task. Further usage of TID and extended resting states conditions in tandem will provide important information about how abnormalities in baseline networks, within a specific sample, translate into functional and behavioral impairments when external cognitive demands are made.
Acknowledgements
The authors thank Diana South for assistance with data collection.
REFERENCES
- Beckmann CF, DeLuca M, Devlin JT, Smith SM ( 2005): Investigations into resting‐state connectivity using independent component analysis. Philos Trans R Soc Lond B Biol Sci 360: 1001–1013. [DOI] [PMC free article] [PubMed] [Google Scholar]
- Binder JR, Frost JA, Hammeke TA, Bellgowan PS, Rao SM, Cox RW ( 1999): Conceptual processing during the conscious resting state. A functional MRI study. J Cogn Neurosci 11: 80–95. [DOI] [PubMed] [Google Scholar]
- Biswal B, Yetkin FZ, Haughton VM, Hyde JS ( 1995): Functional connectivity in the motor cortex of resting human brain using echo‐planar MRI. Magn Reson Med 34: 537–541. [DOI] [PubMed] [Google Scholar]
- Bluhm RL, Miller J, Lanius RA, Osuch EA, Boksman K, Neufeld RW, Theberge J, Schaefer B, Williamson P ( 2007): Spontaneous low‐frequency fluctuations in the BOLD signal in schizophrenic patients: Anomalies in the default network. Schizophr Bull 33: 1004–1012. [DOI] [PMC free article] [PubMed] [Google Scholar]
- Bowie CR, Harvey PD ( 2005): Cognition in schizophrenia: Impairments, determinants, and functional importance. Psychiatr Clin North Am 28: 613–633, 626. [DOI] [PubMed] [Google Scholar]
- Broyd SJ, Demanuele C, Debener S, Helps SK, James CJ, Sonuga‐Barke EJ ( 2009): Default‐mode brain dysfunction in mental disorders: A systematic review. Neurosci Biobehav Rev 33: 279–296. [DOI] [PubMed] [Google Scholar]
- Buckner RL, Andrews‐Hanna JR, Schacter DL ( 2008): The brain's default network: Anatomy, function, and relevance to disease. Ann N Y Acad Sci 1124: 1–38. [DOI] [PubMed] [Google Scholar]
- Calhoun VD, Adali T, Pearlson GD, Pekar JJ ( 2001): A method for making group inferences from functional MRI data using independent component analysis. Hum Brain Mapp 14: 140–151. [DOI] [PMC free article] [PubMed] [Google Scholar]
- Calhoun VD, Kiehl KA, Pearlson GD ( 2008a): Modulation of temporally coherent brain networks estimated using ICA at rest and during cognitive tasks. Hum Brain Mapp 29: 828–838. [DOI] [PMC free article] [PubMed] [Google Scholar]
- Calhoun VD, Maciejewski PK, Pearlson GD, Kiehl KA ( 2008b): Temporal lobe and “default” hemodynamic brain modes discriminate between schizophrenia and bipolar disorder. Hum Brain Mapp 29: 1265–1275. [DOI] [PMC free article] [PubMed] [Google Scholar]
- Damoiseaux JS, Rombouts SA, Barkhof F, Scheltens P, Stam CJ, Smith SM, Beckmann CF ( 2006): Consistent resting‐state networks across healthy subjects. Proc Natl Acad Sci USA 103: 13848–13853. [DOI] [PMC free article] [PubMed] [Google Scholar]
- De Luca M, Beckmann CF, De Stefano N, Matthews PM, Smith SM ( 2006): fMRI resting state networks define distinct modes of long‐distance interactions in the human brain. Neuroimage 29: 1359–1367. [DOI] [PubMed] [Google Scholar]
- Eichele T, Debener S, Calhoun VD, Specht K, Engel AK, Hugdahl K, von Cramon DY, Ullsperger M ( 2008): Prediction of human errors by maladaptive changes in event‐related brain networks. Proc Natl Acad Sci USA 105: 6173–6178. [DOI] [PMC free article] [PubMed] [Google Scholar]
- Esposito F, Scarabino T, Hyvarinen A, Himberg J, Formisano E, Comani S, Tedeschi G, Goebel R, Seifritz E, Di SF ( 2005): Independent component analysis of fMRI group studies by self‐organizing clustering. Neuroimage 25: 193–205. [DOI] [PubMed] [Google Scholar]
- Filbey FM, Toulopoulou T, Morris RG, McDonald C, Bramon E, Walshe M, Murray RM ( 2008): Selective attention deficits reflect increased genetic vulnerability to schizophrenia. Schizophr Res 101: 169–175. [DOI] [PubMed] [Google Scholar]
- Forman SD, Cohen JD, Fitzgerald M, Eddy WF, Mintun MA, Noll DC ( 1995): Improved assessment of significant activation in functional magnetic resonance imaging (fMRI): Use of a cluster‐size threshold. Magn Reson Med 33: 636–647. [DOI] [PubMed] [Google Scholar]
- Foucher JR, Vidailhet P, Chanraud S, Gounot D, Grucker D, Pins D, Damsa C, Danion JM ( 2005): Functional integration in schizophrenia: Too little or too much? Preliminary results on fMRI data. Neuroimage 26: 374–388. [DOI] [PubMed] [Google Scholar]
- Fox MD, Snyder AZ, Vincent JL, Corbetta M, Van EDC, Raichle ME ( 2005): The human brain is intrinsically organized into dynamic, anticorrelated functional networks. Proc Natl Acad Sci USA 102: 9673–9678. [DOI] [PMC free article] [PubMed] [Google Scholar]
- Franco AR, Pritchard A, Calhoun VD, Mayer AR ( 2009): Interrater and intermethod reliability of default mode network selection. Hum Brain Mapp 30: 2293–2303. [DOI] [PMC free article] [PubMed] [Google Scholar]
- Garrity AG, Pearlson GD, McKiernan K, Lloyd D, Kiehl KA, Calhoun VD ( 2007): Aberrant “default mode” functional connectivity in schizophrenia. Am J Psychiatry 164: 450–457. [DOI] [PubMed] [Google Scholar]
- Greicius MD, Menon V ( 2004): Default‐mode activity during a passive sensory task: Uncoupled from deactivation but impacting activation. J Cogn Neurosci 16: 1484–1492. [DOI] [PubMed] [Google Scholar]
- Gusnard DA, Akbudak E, Shulman GL, Raichle ME ( 2001): Medial prefrontal cortex and self‐referential mental activity: Relation to a default mode of brain function. Proc Natl Acad Sci USA 98: 4259–4264. [DOI] [PMC free article] [PubMed] [Google Scholar]
- Harrison BJ, Yucel M, Pujol J, Pantelis C ( 2007): Task‐induced deactivation of midline cortical regions in schizophrenia assessed with fMRI. Schizophr Res 91: 82–86. [DOI] [PubMed] [Google Scholar]
- Honea R, Crow TJ, Passingham D, Mackay CE ( 2005): Regional deficits in brain volume in schizophrenia: A meta‐analysis of voxel‐based morphometry studies. Am J Psychiatry 162: 2233–2245. [DOI] [PubMed] [Google Scholar]
- Jafri MJ, Pearlson GD, Stevens M, Calhoun VD ( 2008): A method for functional network connectivity among spatially independent resting‐state components in schizophrenia. Neuroimage 39: 1666–1681. [DOI] [PMC free article] [PubMed] [Google Scholar]
- Kim DI, Mathalon DH, Ford JM, Mannell M, Turner JA, Brown GG, Belger A, Gollub R, Lauriello J, Wible C, O'Leary D, Lim K, Toga A, Potkin SG, Birn F, Calhoun VD ( 2009): Auditory oddball deficits in schizophrenia: An independent component analysis of the fMRI multisite function BIRN study. Schizophr Bull 35: 67–81. [DOI] [PMC free article] [PubMed] [Google Scholar]
- Li YO, Adali T, Calhoun VD ( 2007): Estimating the number of independent components for functional magnetic resonance imaging data. Hum Brain Mapp 28: 1251–1266. [DOI] [PMC free article] [PubMed] [Google Scholar]
- Liang M, Zhou Y, Jiang T, Liu Z, Tian L, Liu H, Hao Y ( 2006): Widespread functional disconnectivity in schizophrenia with resting‐state functional magnetic resonance imaging. Neuroreport 17: 209–213. [DOI] [PubMed] [Google Scholar]
- Linden DE ( 2008): Auditory hallucinations and functional imaging. Fortschr Neurol Psychiatr 76 Suppl 1: S33–S39. [DOI] [PubMed] [Google Scholar]
- Liu Y, Liang M, Zhou Y, He Y, Hao Y, Song M, Yu C, Liu H, Liu Z, Jiang T ( 2008): Disrupted small‐world networks in schizophrenia. Brain 131: 945–961. [DOI] [PubMed] [Google Scholar]
- Luck SJ, Gold JM ( 2008): The construct of attention in schizophrenia. Biol Psychiatry 64: 34–39. [DOI] [PMC free article] [PubMed] [Google Scholar]
- Mayer AR, Franco AR, Canive J, Harrington DL ( 2009): The effects of stimulus modality and frequency of stimulus presentation on cross‐modal distraction. Cereb Cortex 19: 993–1007. [DOI] [PubMed] [Google Scholar]
- McKeown MJ, Hansen LK, Sejnowsk TJ ( 2003): Independent component analysis of functional MRI: What is signal and what is noise? Curr Opin Neurobiol 13: 620–629. [DOI] [PMC free article] [PubMed] [Google Scholar]
- McKiernan KA, Kaufman JN, Kucera‐Thompson J, Binder JR ( 2003): A parametric manipulation of factors affecting task‐induced deactivation in functional neuroimaging. J Cogn Neurosci 15: 394–408. [DOI] [PubMed] [Google Scholar]
- Morcom AM, Fletcher PC ( 2007): Does the brain have a baseline? Why we should be resisting a rest. Neuroimage 37: 1073–1082. [DOI] [PubMed] [Google Scholar]
- Murphy K, Birn RM, Handwerker DA, Jones TB, Bandettini PA ( 2009): The impact of global signal regression on resting state correlations: Are anti‐correlated networks introduced? Neuroimage 44: 893–905. [DOI] [PMC free article] [PubMed] [Google Scholar]
- Oldfield RC ( 1971): The assessment and analysis of handedness: The Edinburgh inventory. Neuropsychologia 9: 97–113. [DOI] [PubMed] [Google Scholar]
- Pomarol‐Clotet E, Salvador R, Sarro S, Gomar J, Vila F, Martinez A, Guerrero A, Ortiz‐Gil J, Sans‐Sansa B, Capdevila A, Cebamanos JM, McKenna PJ ( 2008): Failure to deactivate in the prefrontal cortex in schizophrenia: Dysfunction of the default mode network? Psychol Med 38: 1185–1193. [DOI] [PubMed] [Google Scholar]
- Ragland JD, Yoon J, Minzenberg MJ, Carter CS ( 2007): Neuroimaging of cognitive disability in schizophrenia: Search for a pathophysiological mechanism. Int Rev Psychiatry 19: 417–427. [DOI] [PMC free article] [PubMed] [Google Scholar]
- Raichle ME, MacLeod AM, Snyder AZ, Powers WJ, Gusnard DA, Shulman GL ( 2001): A default mode of brain function. Proc Natl Acad Sci USA 98: 676–682. [DOI] [PMC free article] [PubMed] [Google Scholar]
- Sambataro F, Murty VP, Callicott JH, Tan HY, Das S, Weinberger DR, Mattay VS: Age‐related alterations in default mode network: Impact on working memory performance. Neurobiol Aging (in press). [DOI] [PMC free article] [PubMed] [Google Scholar]
- Shulman GL, Fiez JA, Corbetta M, Buckner RL, Miezen FM, Raichle ME, Peterson S ( 1997): Common blood flow changes across visual tasks: II. Decreases in cerebral cortex. J Cogn Neurosci 9: 648–663. [DOI] [PubMed] [Google Scholar]
- Stark CE, Squire LR ( 2001): When zero is not zero: The problem of ambiguous baseline conditions in fMRI. Proc Natl Acad Sci USA 98: 12760–12766. [DOI] [PMC free article] [PubMed] [Google Scholar]
- Talairach J, Tournoux P ( 1988): Co‐planar steriotaxic atlas of the human brain. New York: Thieme. [Google Scholar]
- Tomasi D, Ernst T, Caparelli EC, Chang L ( 2006): Common deactivation patterns during working memory and visual attention tasks: An intra‐subject fMRI study at 4 Tesla. Hum Brain Mapp 27: 694–705. [DOI] [PMC free article] [PubMed] [Google Scholar]
- Uddin LQ, Clare Kelly AM, Biswal BB, Xavier Castellanos F, Milham MP ( 2009): Functional connectivity of default mode network components: Correlation, anticorrelation, and causality. Hum Brain Mapp 625–637. [DOI] [PMC free article] [PubMed] [Google Scholar]
- van de Ven VG, Formisano E, Prvulovic D, Roeder CH, Linden DE ( 2004): Functional connectivity as revealed by spatial independent component analysis of fMRI measurements during rest. Hum Brain Mapp 22: 165–178. [DOI] [PMC free article] [PubMed] [Google Scholar]
- Weissman DH, Roberts KC, Visscher KM, Woldorff MG ( 2006): The neural bases of momentary lapses in attention. Nat Neurosci 9: 971–978. [DOI] [PubMed] [Google Scholar]
- Whitfield‐Gabrieli S, Thermenos HW, Milanovic S, Tsuang MT, Faraone SV, McCarley RW, Shenton ME, Green AI, Nieto‐Castanon A, LaViolette P, Wojcik J, Gabrieli JD, Seidman LJ ( 2009): Hyperactivity and hyperconnectivity of the default network in schizophrenia and in first‐degree relatives of persons with schizophrenia. Proc Natl Acad Sci USA 106: 1279–1284. [DOI] [PMC free article] [PubMed] [Google Scholar]
- Zhang Z, Kawabata H, Liu ZQ ( 2001): Electroencephalogram analysis using fast wavelet transform. Comput Biol Med 31: 429–440. [DOI] [PubMed] [Google Scholar]
- Zhou Y, Liang M, Jiang T, Tian L, Liu Y, Liu Z, Liu H, Kuang F ( 2007a): Functional dysconnectivity of the dorsolateral prefrontal cortex in first‐episode schizophrenia using resting‐state fMRI. Neurosci Lett 417: 297–302. [DOI] [PubMed] [Google Scholar]
- Zhou Y, Liang M, Tian L, Wang K, Hao Y, Liu H, Liu Z, Jiang T ( 2007b): Functional disintegration in paranoid schizophrenia using resting‐state fMRI. Schizophr Res 97: 194–205. [DOI] [PubMed] [Google Scholar]