Abstract
It is now widely accepted that image quality should be evaluated using task-based criteria, such as human-observer performance in a lesion-detection task. The channelized Hotelling observer (CHO) has been widely used as a surrogate for human observers in evaluating lesion detectability. In this paper, we propose that the problem of developing a numerical observer can be viewed as a system-identification or supervised-learning problem, in which the goal is to identify the unknown system of the human observer. Following this approach, we explore the possibility of replacing the Hotelling detector within the CHO with an algorithm that learns the relationship between measured channel features and human observer scores. Specifically, we develop a channelized support vector machine (CSVM) which we compare to the CHO in terms of its ability to predict human-observer performance. In the examples studied, we find that the CSVM is better able to generalize to unseen images than the CHO, and therefore may represent a useful improvement on the CHO methodology, while retaining its essential features.
Index Terms: Channelized Hotelling observer (CHO), image quality, machine learning, numerical observer, support vector machine (SVM), task based image evaluation
I. INTRODUCTION
A Critically important aspect of imaging science is the problem of evaluating image quality [1], which is a necessary ingredient for optimization of imaging systems and image-processing algorithms. In the early days of image processing, it was common to use simple numerical criteria, such as signal-to-noise ratio, to assess image quality in the presence of blur, noise, and other artifacts. However, it is now widely accepted that the quality of an image must ultimately be defined by the degree to which the image serves its intended purpose. For example, if an image is to be used for lesion detection, then image quality should ideally be judged by the ability of an observer to detect lesions within the image. Such an approach has become known as task-based assessment of image quality.
In today’s medical imaging, although computer-aided diagnosis now plays a growing role, the human observer remains the principal agent of diagnostic decisions. Therefore, it is widely agreed that the diagnostic performance of a human observer is, in most cases, the ultimate test of image quality. However, empirical studies to assess human observer performance can be costly and time-consuming. Therefore, it may not be feasible to conduct such studies during preliminary evaluation of a new imaging technique or algorithm.
To resolve this limitation, Myers and Barrett [2] proposed that a mathematical model called the channelized Hotelling observer (CHO) be used as a surrogate for human observers for assessment of detection-task performance. It has been shown that in many situations the CHO produces detection performance that correlates well with that of human observers (e.g., [3]–[7]). Therefore, the CHO has justifiably gained wide popularity in the medical-imaging community as a method for assessing image quality and optimization of image-processing algorithms (e.g., [7]–[9]).
However, the performance of the CHO does not always correlate well with human-observer performance, as illustrated by the results shown in [11] and [8]. To remedy this problem, it is common to introduce a term representing so-called internal noise, [6]–[8], [11], which diminishes the detection performance of the CHO so that it performs at a level that is more commensurate with the human observer. For a given imaging application, it is necessary to adjust this parameter empirically to identify a CHO model that produces the best correlation with a given set of human-observer data.
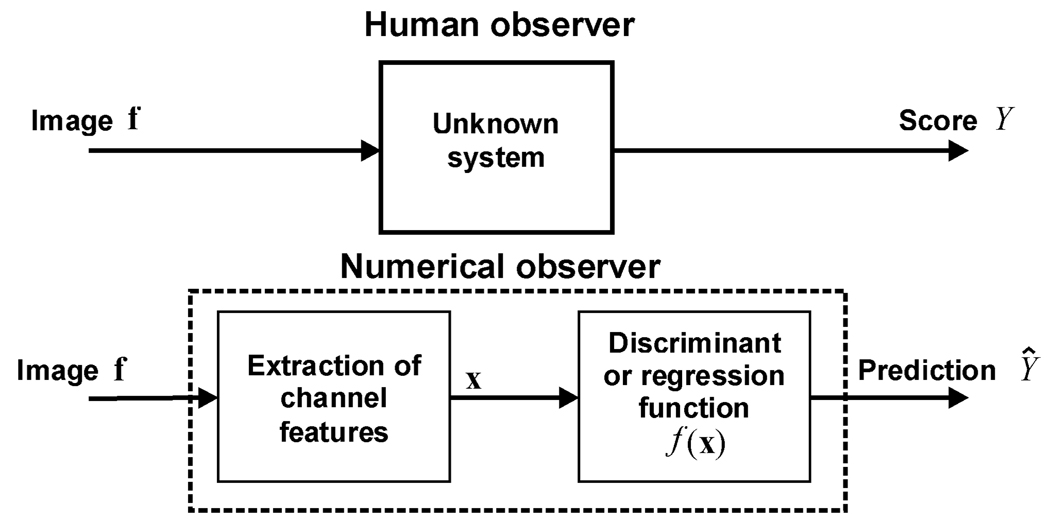
In this paper, we argue that the internal noise fitting approach to CHO optimization is, in essence, a supervised-learning or system-identification problem, as shown in Fig. 1. That is, the goal of the CHO is to identify the unknown system of the human observer or, in other words, to learn to predict the output of the human observer. When the CHO is optimized by adjusting the internal noise parameter, this can be viewed as a model-tuning step for a learning machine, the goal being to accurately predict some measure of human-observer performance, such as the area under the receiver-operating characteristic (ROC) curve.
Fig. 1.
Block diagram of a human observer and channelized numerical observer in a lesion-detection task. A human observer reports score Y describing his confidence that a lesion is present. Development of a numerical observer can be viewed as a supervised-learning problem, in which the goal is to identify the unknown human system. In other words, the goal is to train the numerical observer to produce a value Ŷ = f(x) that closely match the human-observer score Y.
The supervised-learning viewpoint that we advocate in this paper makes apparent two important issues. First, while the CHO has been proven to be a good model for human-observer performance, even better models may exist; in particular, there may be models that can more accurately predict human-observer performance, while also generalizing well to images not available during observer training. In particular, machine-learning methods such as support-vector machines (SVM) [13], [14] may be preferred, because these models are flexible and are known to generalize well to unseen data. Second, when viewing observer optimization as a supervised-learning problem, it becomes apparent that one must be careful to use appropriate validation procedures for testing the performance. For example, it is important not to use the same data for both training and testing of the observer, a mistake that is sometimes made when evaluating application-specific CHOs.
In this paper, we develop a numerical observer, which we call a channelized SVM (CSVM). The proposed CSVM is based on the same channel operator as the CHO, but replaces the CHO’s Hotelling detector with an SVM, which is a supervised learning machine.
In the experiments described later in the paper, we use subsets of the human-observer data presented in [7] to optimize the CHO and CSVM, and then use other subsets of these data to test both models. We optimize both numerical observers for prediction of the area under the receiver operating characteristic (ROC) curve Az. Such predictions can be used in practice, for example, to compare image quality across a range of image-reconstruction parameters.
In our experiments, we find that the CHO and CSVM perform equally well when the training and test images are reconstructed in precisely the same way. However, when the CHO and CSVM are trained on images reconstructed in one way, then tested using images reconstructed in a different way, the CSVM significantly outperforms the CHO in terms of prediction accuracy.
The purpose of a numerical observer is to evaluate an imaging algorithm or device for which human-observer data are not available. Therefore, we argue that the ability of the CSVM to generalize from one type of image to another is an important capability. Thus, we propose that the CSVM may represent a useful improvement on the CHO, while retaining the same fundamental approach to the problem of image-quality assessment.
It is important to note that the proposed method aims to train the numerical observer on the images and the human observer scores rather than on the images and the truth status of each image; therefore it is natural to expect that such a numerical observer will have good agreement with the human observer. Similar philosophy of using human observer data was adopted in [27] and [28], where a linear human-observer template was estimated in two-alternative forced-choice experiments.
This paper expands significantly on previous conference papers of ours [15] and [26], in which the essential ideas were first introduced. The theory of the method has been refined since the conference papers, and all of the experimental results in the present paper are new. The general idea of using a learning machine to model human responses to images is one that we have used successfully in the past in the context of retrieving relevant mammograms from a database based on image content [16]. In that work, the goal was to learn to judge the similarity between two images based on similarity scores reported by human observers.
The rest of the paper is organized as follows. In Section II, we review the CHO and introduce the proposed CSVM as a model of the human observer. In Section III, we report experiments to test the CSVM model. In Section IV, we present our conclusions.
II. METHODOLOGY
We begin with a brief introduction to the well-known CHO, on which our proposed image-quality assessment method is based.
A. Channelized Hotelling Observer
The CHO is a numerical observer that serves as a surrogate for human observers in evaluations of image quality. In this context, one considers an image to be of good quality if it permits the numerical observer to perform well in detecting a known signal (e.g., a lesion).
Suppose that an observed image is represented as a vector f by using lexicographic ordering of the pixel values. In our experiments, f represents an image of myocardial perfusion, which may or may not exhibit a known perfusion defect at a known location [signal-known-exactly (SKE)] environment.
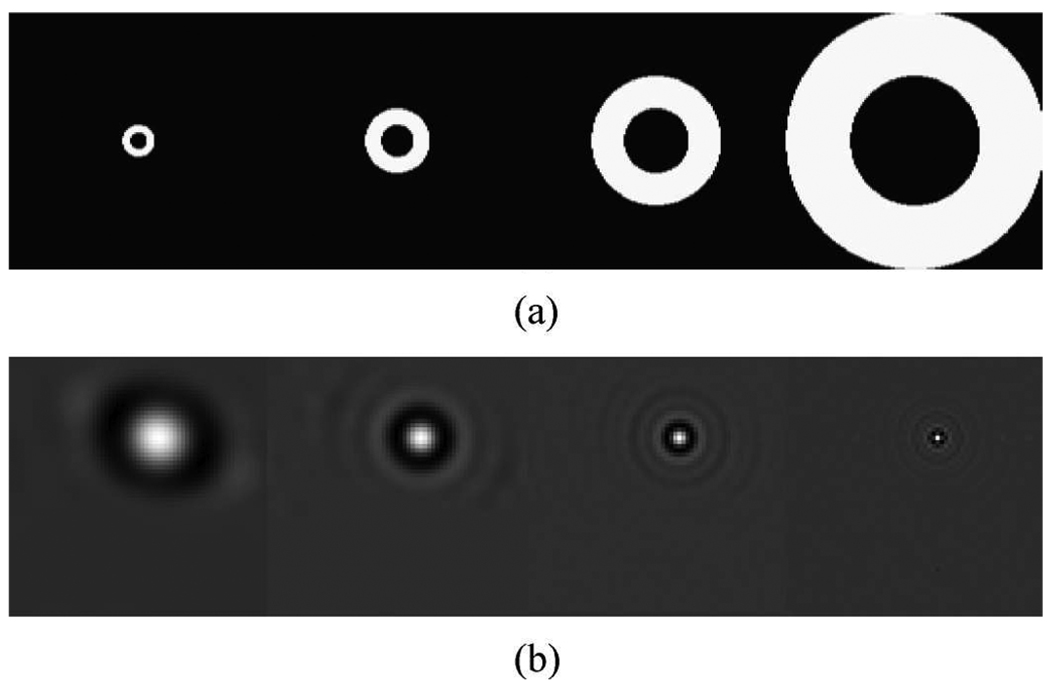
As shown in Fig. 1, the CHO is a cascade of two linear operators, which in practice can be combined into one. The first operator, called the channel operator U, measures features of the image by applying nonoverlapping, bandpass filters (Fig. 2), which are intended to model the human visual system [2]. In our experiments, four rotationally symmetric bandpass filters were used, having cutoff frequencies of [0.0375, 0.625, 0.125, 0.25, 0.5] cycles/pixel.
Fig. 2.
Feature extraction channels used in the CHO: (a) frequency domain responses and (b) spatial domain responses.
When applied to the image f, the channel operator yields a feature vector
| (1) |
The second operator, called the Hotelling observer, computes a test statistic for choosing between the following hypotheses based on the observed feature vector x:
| (2) |
where p(x|Hj) is the probability density function (PDF) of x given hypothesis Hj, j = 0, 1. In the present context the CHO is defined as
| (3) |
where d = μ1 − μ0, in which μj = E[x|Hj] is the expected value of x under hypothesis Hj, and Σ is a covariance matrix which is modeled as
| (4) |
where Σj = cov [x|Hj] is the covariance matrix of x under hypothesis Hj, and σ2 is the variance in one model for the so-called internal noise [7]. Alternative internal noise models are explored in [6]–[8], [11]. Note that the parameters μj and Σj,j = 0, 1, are determined from the data or analytically calculated (see [8]–[10] for example). In (3) the internal noise was estimated during model training, but the model statistics (μj and Σj) were estimated from the test data. When properly chosen, the internal noise variance σ2 can improve the agreement between the CHO and the human observer [7], [8]. Without the internal noise term, the Hotelling observer is equivalent to a generalized likelihood ratio test (GLRT) between the hypotheses in (2) under the assumption that the PDFs are Gaussian with equal covariance matrices.
B. Channelized Learning Machine
In this work we adopt a supervised learning machine for identifying f(x) (as seen in Fig. 1), a function (linear or nonlinear) that maps the extracted image feature vector to human scores. Thus, we preserve the same structure and channel operator as in the CHO.
For this purpose we first collect a training set of example images, each labeled by a human observer with a score Y, which is the human observer’s stated confidence in the presence of a known signal (e.g., a perfusion defect) at a specified location within the image.
Thus, the goal of our learning machine is to obtain prediction of the human observer score, Y, based on the feature vector x. For this purpose, we consider the following regression model:
| (5) |
in which η is the modeling error. Our aim is to determine a function f(·) that will accurately predict the score Y, while generalizing well to images outside the training set.
In a preliminary study [15], we investigated the use of both a support vector machine (SVM) and a neural network for modeling f(·), and found that the former could achieve significantly better performance. Therefore, in this study we will consider only the SVM.
C. Support Vector Machines
The SVM is a general procedure based on statistical learning theory [17]. SVM embodies the so-called structural risk minimization (SRM) principle, which has been shown [18] to be superior to the traditional empirical risk minimization principle. SRM minimizes an upper bound on the generalization error as opposed to minimizing error on the training data. Consequently, an SVM tends to generalize well to data outside the training set. We have used SVM successfully in a similar context to accomplish content-based retrieval of mammograms [16].
When applied to a regression problem, an SVM can be viewed in concept as a two-step process, though in practice these steps can be combined into one. In the first step, the input data vector x is transformed into a higher-dimensional space ℜ through a nonlinear mapping Ф (·). In the second step, a linear regression is performed in the ℜ space. The net effect of the two steps is a nonlinear regression having the following form:
| (6) |
in which vector w and scalar b are parameters determined from training. Specifically, let {(xi, yi), i = 1, 2, …, l} denote a set of training samples, where yi is the human-observer score Y for image fi i.e., yi is a specific realization of Y. The parameters w and b in the regression function in (6) are determined through minimization of the following structured risk functional:
| (7) |
where Lε(·) is the so-called ε–insensitive loss function which is defined as
| (8) |
The function Lε (·) has the property that it does not penalize errors below the parameter ε. The constant C in (7) determines the trade-off between the model complexity and the training error.
The optimal solution for w* in (7) can be written in the following form:
| (9) |
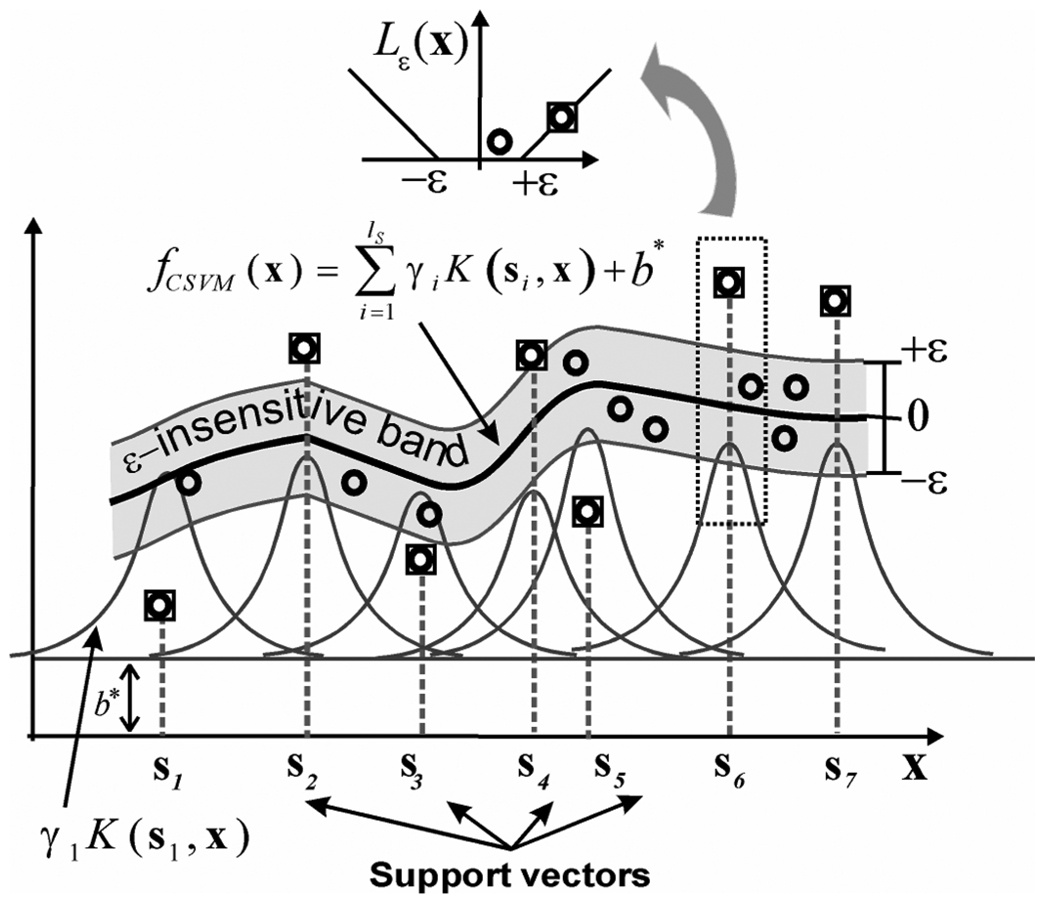
where si, i = 1, …, ls, are a subset of the training examples {xi, i = 1, 2, …, l} called support vectors.
Substituting w* into (6) yields
| (10) |
By introducing a so-called kernel function K(si, x) = Ф(si)TФ(x), we can write fcsvm(x) in a compact form as
| (11) |
As can be seen from (11), the SVM function fcsvm(x) is completely characterized by the support vectors si,i = 1, …, ls. A training sample (xi, yi) is a margin support vector when |yi − fcsvm(xi)| = ε, and an error support vector when.|yi − fcsvm(xi)| > ε.
As an illustration, Fig. 3 shows the case of 1-D regression using SVM, where data points that are identified as support vectors are marked by squares, and the rest of the data points are marked by circles. The regression function fcsvm(x) is indicated by the thick line and the ε-insensitivity bands are indicated by the two thin lines along each side of fcsvm(x). Note that all support vectors are located either on or outside the ε-in-sensitivity bands. For each support vector si, the kernel function K (si, x) is also plotted with its height proportional to γi.
Fig. 3.
Illustration of regression using a support vector machine, which is based on elements of the training set called support vectors, denotes by si, i = 1, …,ls.
From (11), one can directly evaluate the regression function through the kernel function K (·, ·) without the need to define the underlying mapping Ф(·) explicitly. In our experiments, we used the Gaussian radial basis function (RBF) kernel, which is among the most commonly used kernels in SVM research, given by
| (12) |
where is a constant that defines the kernel width.
The parameters b* and γi, i = 1, …, ls, and the support vectors si, i = 1, …, ls, in the SVM functional in (10) are determined by quadratic programming. In our experiments we used a MATLAB implementation to solve the quadratic program [19]. The model parameters C, ε, and were determined by using a cross-validation procedure as explained next.
D. Cross-Validation for Performance Evaluation
Cross-validation is a statistical learning evaluation procedure used to estimate the generalization error of a learning machine. In our experiments, we use k-fold cross validation, in which the set of available data is first divided into k subsets. During training, each of these subsets is held-out in turn, and the rest of k − 1 subsets are used for training; the trained learning machine is then tested on the held-out subset. This process is repeated for k times and the average generalization error (measured by the mean-squared-error between predicted and HO scores) is obtained in the end.
E. Performance Metric
The goal of the numerical observer is to predict the performance of human observers in a lesion-detection task (SKE paradigm). Therefore, as is commonly done in CHO research, we adopt the area under the ROC curve Az as a summary measure of detection performance. Therefore, we define the goal of the numerical observer is to accurately predict the Az value of the human observer.
To form a predicted Az value using the CSVM, we input each of the test images into the numerical observer, and record the resulting output value. This step is analogous to obtaining a score from a human observer. Next, based on all scores thus obtained, we use the ROCKIT program by Metz [20], [21] to compute Az, as one would normally do for human-observer scores.
III. PERFORMANCE EVALUATION STUDY
In this section, we describe experiments designed to compare the CSVM and CHO in terms of their ability to predict human-observer performance, as measured by the area under the ROC curve Az in a lesion-detection task.
A. Human-Observer Data Set
Our experiments are based on data obtained in a previously published human-observer study [7] by Narayanan et al. Their study was based on images that simulate myocardial-perfusion imaging using single-photon emission computed tomography (SPECT). The aim of their work was to optimize iterative image reconstruction from data obtained using a 99m Tc-labeled myocardial-perfusion imaging agent. For completeness, we review the salient features of the human-observer data that we used in our experiments. Further details can be found in the original paper [7].
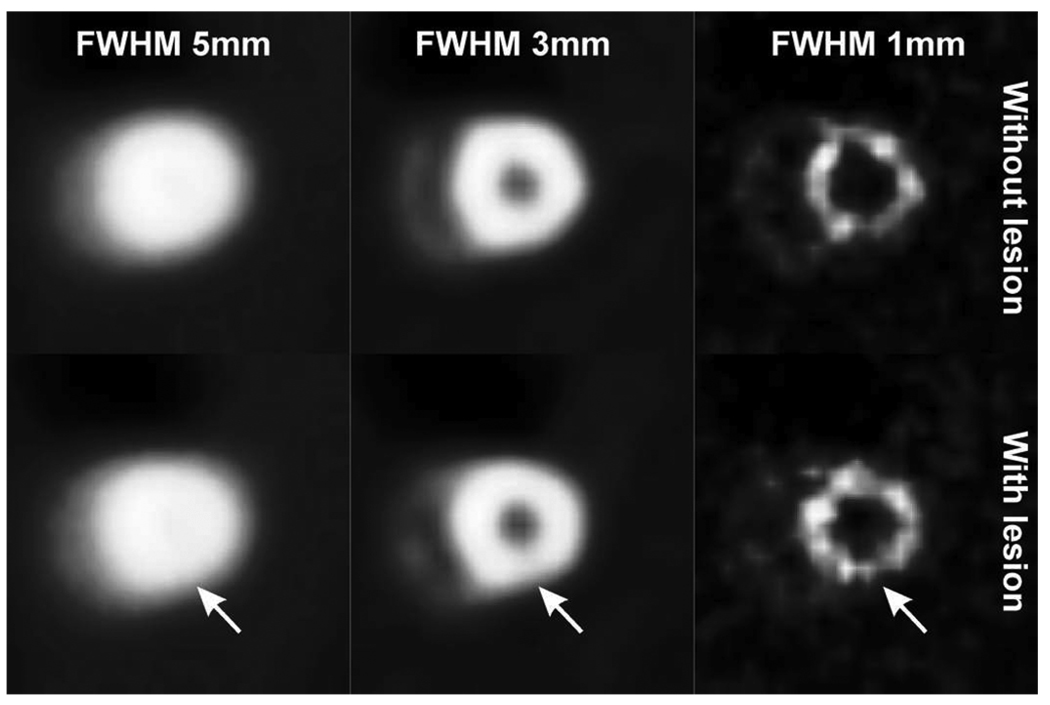
An MCAT phantom [22] was used to simulate activity and attenuation maps for a human torso, including the effects of contractile and wringing heart motions, and respiratory motion. The phantom images were defined on a 128 × 128 × 128 grid with 0.317 cm voxel size. A simulated perfusion defect was placed at a fixed position in the left-ventricular wall, as shown in Fig. 4. This defect provided the signal that the human observers attempted to detect.
Fig. 4.
Example images of OSEM-reconstructed images with one effective iteration.
Monte Carlo simulation was used to produce 128 × 128 projection data at 60 angles over a range of 360°, including the effects of nonuniform attenuation, scatter, and depth-dependent spatial resolution simulating a low-energy high-resolution collimator. Noise was introduced corresponding to 3 million counts.
Images were reconstructed from the noisy simulated data using the ordered subsets expectation-maximization (OSEM) algorithm [23] with either one or five effective iterations. These images were low-pass filtered with 3-D Gaussian filters with the following values of the full width at half-maximum (FWHM): 0, 1, 2, 3, 4, or 5 pixels. By choosing the number of iterations and the FWHM of the filter, one obtains 12 different variations of the image-reconstruction algorithm.
Two medical physicists evaluated the defect visibility in a signal-known-exactly (SKE) environment [which also assumes location-known-exactly (LKE)] for images at every combination of the number of iterations and FWHM of the filter. For each parameter combination of the reconstruction algorithm, a total of 100 noisy image realizations were scored by the observers (50 with defect present and 50 with defect absent) on a six-point scale, following a training session involving an additional 60 images.
In Fig. 4 we show some examples of the images used in the human-observer study. These example images were reconstructed from a particular noise realization with one effective iteration of OSEM, and one of three different levels of smoothing (FWHM = 1, 3, or 5 pixels). Fig. 4 shows images of both the defect-present and defect-absent conditions. The location of the defect is indicated by arrows. As one can see, the defect is fairly inconspicuous at all smoothing levels. At low levels of smoothing, it is difficult to distinguish the defect from noise. At high levels of smoothing, the low contrast of the defect makes it difficult for human observers to detect.
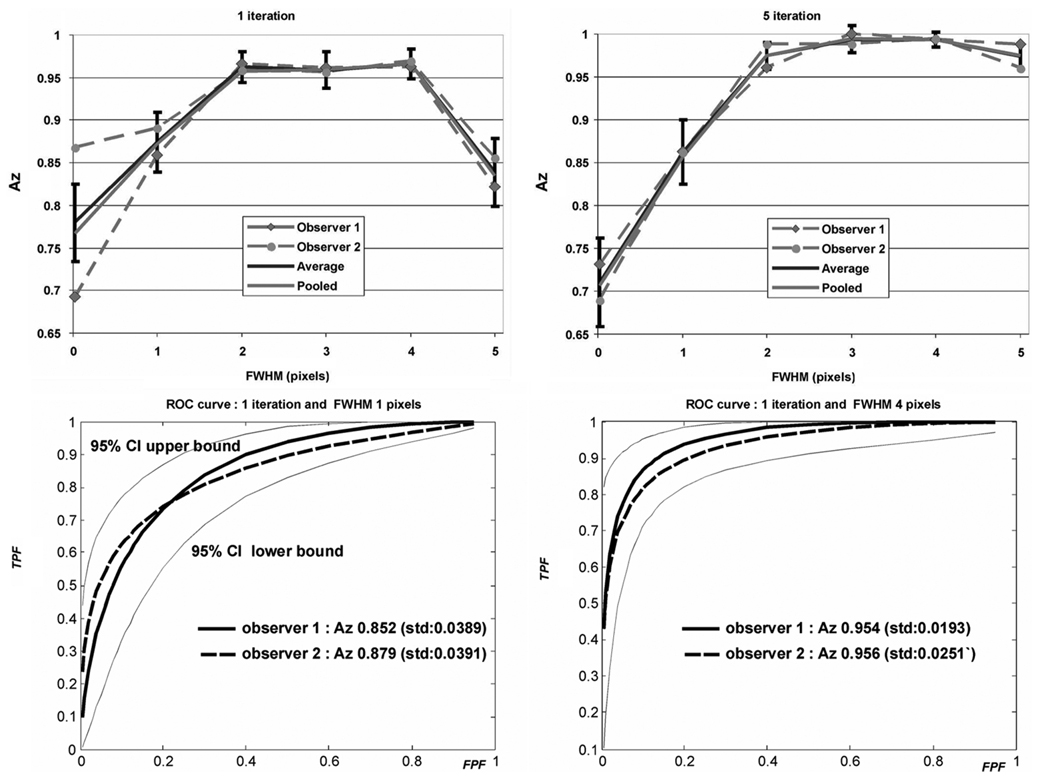
The image scores from the two observers were pooled together into a single set for subsequent studies. That is, the scores from the two observers were treated as two observations of the same images. This would double the number of training samples. This approach was used here because no large inter-observer variation was observed. This assumption is justified by the results shown in Fig. 5, which shows that the area under receiver operating characteristic (ROC) curve, Az, is virtually the same whether the Az values for two observers are averaged, or whether the observer data are pooled prior to computing Az. In this figure two sets of sample ROC curves are also shown to demonstrate the good agreement between the two observers. The error bars represent an average error bar over two readers as obtained from the ROCKIT program which is a conservative estimate. Finally, we note that in case there were large interobserver variation, one would need to carefully design the observer studies (e.g., use more observers) and apply statistical analyses to remove the interobserver variation in the data (see [29]).
Fig. 5.
Human observer performance variability evaluation: top; Az obtained from pooled data versus averaging Az over two observers, bottom: Estimated ROC curves using ROCKIT for two observers at two different reconstruction parameters.
B. Evaluation of the Numerical Observers
In the present context, the purpose of a numerical observer is to provide an estimate of lesion-detection performance as a measure of image quality in cases when human-observer data are not available. For example, a numerical observer might be used to optimize a parameter of an image-reconstruction algorithm by choosing the parameter value that maximizes observer performance.
However, for such an approach to be useful, the numerical observer must accurately predict human-observer performance over a wide range of reconstruction parameter settings for which no human-observer data were available. Thus, in the language of machine learning, the numerical observer must exhibit good generalization properties.
In this section, we study three different generalization properties of the CHO and CSVM by selecting the training and test sets in different ways, as we explain next.
1) Comparison 1: Generalization To Unseen Images of the Same Kind
We began by testing whether each numerical observer can generalize to images that were not present in the training set, but which are otherwise the same. Specifically, we considered images produced by precisely the same reconstruction algorithm, but using different noise realizations than those used in the training phase. The ability to generalize to new images of the same kind is a necessary, but not sufficient, property for a numerical observer to be useful.
We trained the numerical observers in the following way. For the CHO, the process of training consisted of optimizing the selection of the internal noise parameter σ2. In this experiment, we optimized the internal noise parameter by exhaustive search to ensure that the best match to the human observer was found.
For the CSVM, training consisted of solving a quadratic programming problem to find parameters b and γi, i = 1, …, ls, and the support vectors si, i = 1, …, ls for each setting of a model parameters C, and ε. In our experiments, we optimized the values of C, and ε, by using a five-fold cross-validation resampling procedure [24]. It was observed in our experiments that CSVM performance was fairly insensitive to the choice of these parameters. The same procedure was also used for determining the internal noise parameter σ2 for the CHO. As explained earlier, by choosing either one or five OSEM iterations, or one of six values of the filter FWHM, we obtained 12 different combined parameter settings of the reconstruction algorithm. For each of these 12 settings, we evaluated the average value of Az predicted by numerical observers by using five-fold cross validation [24] on the 100 images.
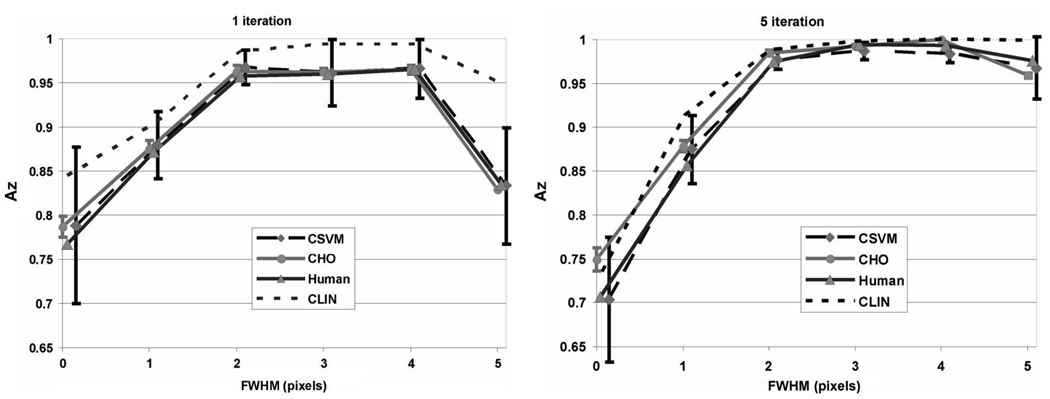
The goal of each numerical observer is to produce a predicted Az value that is close to that of the human observers. As shown in Fig. 6, both CSVM and CHO can almost perfectly mimic human-observer performance in this case. Error bars represent the standard deviation of Az obtained by five-fold cross validation.
Fig. 6.
Comparison 1: Results comparing ability of CSVM and CHO to generalize to test images of the same type, but different noise realizations, as the training images. In this situation, both the CSVM and CHO are very successful in predicting human-observer performance.
Note that the entire data set was used in cross-validation optimization of the model parameters (and internal noise); therefore a positive bias was introduced. In our following comparisons, this source of bias is avoided because the testing and training sets are mutually exclusive.
Furthermore, for comparison, Fig. 6 shows a set of results obtained with a channelized linear regression model (indicated by CLIN). Like the CHO, this is a linear observer model, except that it is obtained by regressing against the human observer scores (like the CSVM). It is essentially a special case of CSVM when a first order polynomial kernel is used for SVM.
These results suggest that both CSVM and CHO can accurately generalize to unseen images, provided that these images are produced in exactly the same way as those used in training. The linear regression method does not seem to work as well.
2) Comparison 2: Generalization From One Specific Type of Images to Another
Next, we considered the result of training the numerical observers with images made using one combination of image-reconstruction parameters, then testing these observers with new images made using a different combination of reconstruction parameter values.
In this experiment, we trained each numerical observer using 100 images, all reconstructed by one of the 12 reconstruction-parameter combinations. We repeated this for each of the 12 combinations, yielding 12 different CHOs and 12 CSVMs. In each of these CHOs and CSVMs, we used the optimized model parameters, σ2, C, , and ε obtained in the previous experiment by five-fold cross validation. No test images were used in the selection of the model parameters of either the CHO or the CSVM.
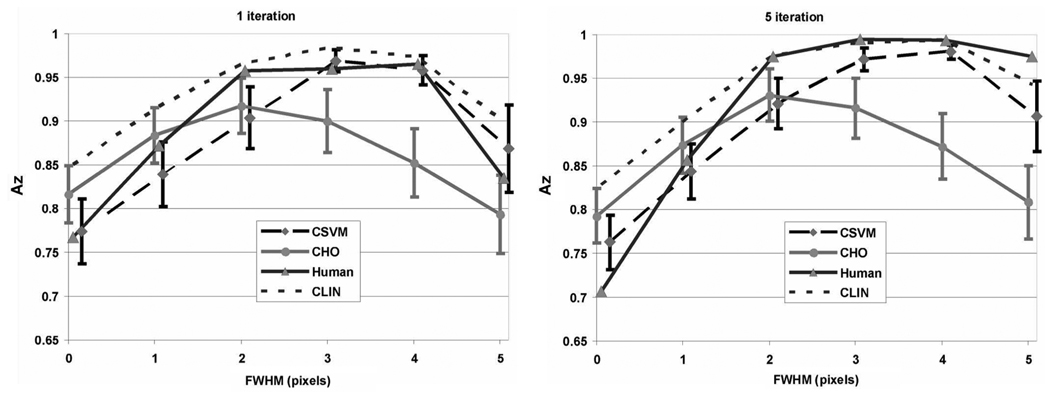
We then tested each of these CHOs and CSVMs using all of the other images (therefore, no training images were included in any test set) therefore, the results of the evaluation are unbiased. Finally, for each reconstruction-parameter combination, we computed the average predicted value Az and the standard deviation std(Az), in which the average and standard deviation were taken over all the numerical observers trained on images obtained by a different set of reconstruction parameters (11 of them).
These results, shown in Fig. 7, indicate that the CSVM could be much more successful in generalizing to images reconstructed differently than those in the training set. In particular, the CSVM correctly identified that the peak human-observer performance occurs at FWHM = 4 for one iteration and FWHM = 3 for five iterations, whereas the CHO estimated peak performance to occur at FWHM = 2 and FWHM = 3, respectively. If graphs such as these were used to optimize the reconstruction algorithm, then the CHO would produce an inaccurate conclusion in this case.
Fig. 7.
Comparison 2: Results comparing ability of CSVM and CHO to generalize to test images of a different type from the training-set images. Only the CSVM is able to produce an approximate match to human-observer performance in this case.
3) Comparison 3: Generalization From one Broad Class of Images to Another
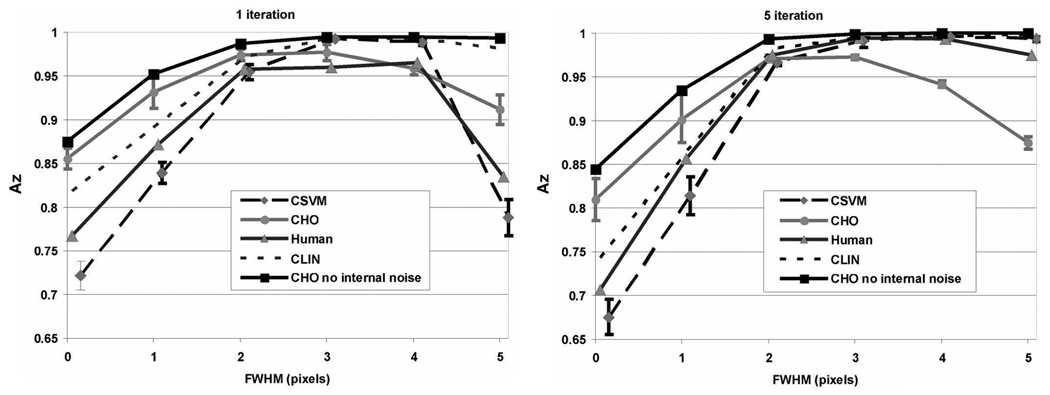
In this final comparison, we studied a kind of generaliation that is perhaps most representative of the practical use of a numerical observer. In this experiment, we trained both numerical observers on a broad range of images, and then tested them on a different, but equally broad, set of images. Specifically, we trained both numerical observers using images for every value of the filter FWHM and one iteration of OSEM, and then tested the observers using all the images for every value of the filter FWHM with five iterations of OSEM. Then we repeated the experiment with the roles of one and five iterations reversed.
In this experiment, the parameters of the CHO and CSVM were again optimized to minimize generalization error measured using five-fold cross validation based on the training images only. Therefore, no test images were used in any way in the choices of the model parameters for either numerical observer.
The results of this experiment are shown in Fig. 8. In this situation, the CHO performed relatively poorly, failing to match either the shape or amplitude of the human-observer Az curves, while the CSVM was able to produce reasonably accurate predictions of Az in both cases. The error bars represent standard deviation calculated using fide-fold cross validation on the testing data.
Fig. 8.
Comparison 3: Results comparing ability of CSVM and CHO to generalize from one broad class of images to another. Only the CSVM is able to produce an approximate match to human-observer performance in this case.
For comparison, we also show in Fig. 8 results obtained when no internal noise was used for the CHO. As can be seen, the CHO in this case does not correlate well with the HO.
Afterwards we calculated Kendall’s tau rank correlation coefficient [25] for each experiment (see Table I). The Kendall tau coefficient measures the degree of correspondence between two sets of rankings, ranging from −1 (anticorrelated) to +1 (perfectly correlated). In this case, we used the Kendall tau coefficient to assess the degree of correspondence between the ranking of reconstruction algorithms of the numerical observers with that of the human observers. The results shown in Table I show that the CHO can yield highly inaccurate rankings of image quality, while both the CSVM and CLIN produce consistently good results (near +1).
TABLE I.
Kandall rank correlation coefficient
| Methods | Comparison 1 | Comparison 2 | Comparison 3 |
|---|---|---|---|
| CSVM | 0.91 | 0.70 | 0.82 |
| CLIN | 0.79 | 0.79 | 0.73 |
| CHO | 0.79 | 0.39 | 0.45 |
IV. CONCLUSION
We have introduced an alternative to the CHO called the channelized support vector machine (CSVM) (as well as the channelized linear regression model (CLIN) a special case of CSVM when a first order polynomial kernel is used for SVM), which is intended for use as a task-based measure of image quality. We found, at least for the data tested, that the CSVM, obtained by regressing against the human observer scores, can produce more accurate predictions of human-observer performance than the CHO. Our main finding is that, while the CHO and CSVM both generalized well to unseen images reconstructed in the same way as those in the training set, the CHO did not generalize well in this experiment to unseen images reconstructed in different ways. On the contrary, the CSVM performed well in predicting human-observer performance in all the cases tested. The CHO is a simpler detector than CSVM, which is more conducive to analytical analysis of observer performance. However, the good performance of CSVM may prove beneficial for numerical analysis of performance.
Of course, further studies will be needed to fully validate the CSVM technique; however, this initial study suggests that the CSVM is a promising method for calculation of accurate predictions of human-observer performance in lesion-detection tasks.
In future studies, we will evaluate whether the channel operator is the optimal pre-processor within the CSVM context, and whether other learning machines might perform better than the support vector machine. In addition we will also consider the feasibility of extending the proposed methodology for an observer localization task.
ACKNOWLEDGMENT
The authors would like to thank the Medical Physics Group at the University of Massachusetts Medical Center, led by M. A. King, for generously providing the human-observer data used in the experiments. The authors would also like to thank anonymous reviewers for insightful and helpful comments about the manuscript.
This work was supported by the National Institutes of Health under Grant HL65425 and Grant HL091017.
Contributor Information
Jovan G. Brankov, Email: brankov@iit.edu, Department of Electrical and Computer Engineering, Illinois Institute of Technology, Chicago, IL 60616 USA.
Yongyi Yang, Department of Electrical and Computer Engineering, Illinois Institute of Technology, Chicago, IL 60616 USA..
Liyang Wei, Department of Biomedical Engineering, Illinois Institute of Technology, Chicago, IL 60616 USA..
Issam El Naqa, Department of Radiation Oncology, Washington University School of Medicine, St. Louis, MO 63110 USA..
Miles N. Wernick, Department of Electrical and Computer Engineering, Illinois Institute of Technology, Chicago, IL 60616 USA..
REFERENCES
- 1.Barrett HH, Myers K. Foundations of Image Science. New York: Wiley; 2003. ch. 14. [Google Scholar]
- 2.Myers KJ, Barrett HH. Addition of a channel mechanism to the ideal-observer model. J. Opt. Soc. Am. A. 1987;vol. 4(no. 12):2447–2457. doi: 10.1364/josaa.4.002447. [DOI] [PubMed] [Google Scholar]
- 3.Yao J, Barrett HH. Predicting human performance by a channelized Hotelling model. Proc. SPIE. 1992;vol. 1786:161–168. [Google Scholar]
- 4.Wollenweber SD, Tsui BMW, Lalush DS, Frey EC, LaCroix KJ, Gullberg GT. Comparison of radially-symmetric versus oriented channel: Models using channelized hotelling observers for myocardial defect detection in parallel-hole SPECT. Proc. IEEE Nucl. Sci. Symp. 1998;vol. 3:2090–2094. [Google Scholar]
- 5.Gifford HC, Wells RG, King MA. A comparison of human observer LROC and numerical observer ROC for tumor detection in SPECT images. IEEE Trans. Nucl. Sci. 1999 Aug.vol. 46(no. 4):1032–1037. [Google Scholar]
- 6.Abbey K, Barrett HH. Human- and model-observer performance in ramp-spectrum noise: Effects of regularization and object variability. J. Opt. Soc. Am. A. 2001;vol. 18(no. 3):473–488. doi: 10.1364/josaa.18.000473. [DOI] [PMC free article] [PubMed] [Google Scholar]
- 7.Narayanan MV, Gifford HC, King MA, Pretorius PH, Farncombe TH, Bruyant P, Wernick MN. Optimization of iterative reconstructions of 99 m/Tc cardiac SPECT studies using numerical observers. IEEE Trans. Nucl. Sci. 2002 Oct.vol. 49(no. 5):2355–2360. [Google Scholar]
- 8.Oldan J, Kulkarni S, Xing Y, Khurd P, Gindi GR. Channelized hotelling and human observer study of optimal smoothing in SPECT MAP reconstruction. IEEE Trans. Nucl. Sci. 2004 Jun.vol. 51(no. 3):733–741. [Google Scholar]
- 9.Bonetto P, Qi J, Leahy RM. Covariance approximation for fast and accurate computation of channelized hotelling observer statistics. IEEE Trans. Nucl. Sci. 2000 Aug.vol. 47(no. 4):1567–1572. [Google Scholar]
- 10.Yendiki A, Fessler JA. Analysis of observer performance in known-location tasks for tomographic image reconstruction. IEEE Trans. Med. Imag. 2006 Jan;vol. 25(no. 1):28–41. doi: 10.1109/TMI.2005.859714. [DOI] [PubMed] [Google Scholar]
- 11.Narayan TK, Herman GT. Prediction of human observer performance by numerical observer: An experimental study. J. Opt. Soc. Am. A. 1999;vol. 16(no. 3) doi: 10.1364/josaa.16.000679. [DOI] [PubMed] [Google Scholar]
- 12.Burgess AE. Effect of quantization noise on visual signal detection in noisy images. J. Opt. Soc. Am. A. 1985;vol. 2(no. 9):1424–1428. doi: 10.1364/josaa.2.001424. [DOI] [PubMed] [Google Scholar]
- 13.Cristianini N, Shawe-Taylor J. An Introduction to Support Vector Machines and Other Kernel-Based Learning Methods. Cambridge, U.K: Cambridge Univ. Press; 2000. [Google Scholar]
- 14.Wernick MN. Pattern classification by convex analysis. J. Opt. Soc. Am. A. 1991;vol. 8:1874–1880. [Google Scholar]
- 15.Brankov JG, El-Naqa I, Yang Y, Wernick MN. Learning a nonlinear channelized observer for image quality assessment. IEEE Nucl. Sci. Symp. Med. Imag. Conf. 2003;vol. 4:2526–2529. doi: 10.1109/TMI.2008.2008956. [DOI] [PMC free article] [PubMed] [Google Scholar]
- 16.El-Naqa I, Yang Y, Nishikawa RN, Wernick MN. A similarity learning approach to content-based image retrieval: Application to digital mammography. IEEE Trans. Med. Imag. 2004 Oct.vol. 23(no. 10):1233–1244. doi: 10.1109/TMI.2004.834601. [DOI] [PubMed] [Google Scholar]
- 17.Vapnik V. Statistical Learning Theory. New York: Wiley; 1998. [Google Scholar]
- 18.Gunn SR, Brown M, Bossley KM. Network performance assessment for neurofuzzy data modeling. Lecture Notes in Computer Science. 1997;vol. 1280:313–323. [Google Scholar]
- 19.QUADPROG, MATLAB Version 7.0, Computer Software. Natick, MA: MathWorks; 2005. [Google Scholar]
- 20.ROCKIT [Online] Available: http://xray.bsd.uchicago.edu/krl/KRL_ROC/software_index.htm.
- 21.Metz CE, Herman BA, Shen J-H. Maximun-likelihood estimation of ROC curves from continuously-distributed data. Stat. Med. 1998;vol. 17:1033–1053. doi: 10.1002/(sici)1097-0258(19980515)17:9<1033::aid-sim784>3.0.co;2-z. [DOI] [PubMed] [Google Scholar]
- 22.Pretorius PH, King MA, Tsui BMW, LaCroix KJ, Xia W. A mathematical model of motion of the heart for use in generating source and attenuation maps for simulating emission imaging. Med. Phys. 1999;vol. 26:2323–2332. doi: 10.1118/1.598746. [DOI] [PubMed] [Google Scholar]
- 23.Hudson HM, Larkin RS. Accelerated image reconstruction using ordered subsets of projection data. IEEE Trans. Med. Imag. 1994 Dec.vol. 13(no. 4):601–609. doi: 10.1109/42.363108. [DOI] [PubMed] [Google Scholar]
- 24.Good PI. Resampling Methods. Basel: Birkhauser; 2001. [Google Scholar]
- 25.Kendall MG. Rank Correlation Methods. New York: Hafner; 1955. [Google Scholar]
- 26.Brankov JG, Wei L, Yang Y, Wernick MN. Generalization evaluation of numerical observers for image quality assessment. Conf. Rec. 2006 IEEE Nucl. Sci. Symp. Med. Imag. Conf. 2006;vol. 3:1696–1698. [Google Scholar]
- 27.Abbey CK, Eckstein MP. Optimal shifted estimates of human-observer templates in two-alternative forced-choice experiments. IEEE Trans. Med. Imag. 2002 May;vol. 21(no. 5):429–440. doi: 10.1109/TMI.2002.1009379. [DOI] [PubMed] [Google Scholar]
- 28.Abbey CK, Eckstein MP. Classification image analysis: Estimation and statistical inference for two-alternative forced-choice experiments. J. Vis. 2002;vol. 2(no. 1):66–78. doi: 10.1167/2.1.5. [DOI] [PubMed] [Google Scholar]
- 29.Hastie T, Tibshirani R, Friedman J. The Elements of Statistical Learning. New York: Spriger; 2001. [Google Scholar]


