Abstract
Neuronal PAS domain protein 2 (Npas2) is a clock gene expressed widely in brain and peripheral tissues. NPAS2 is responsive to cellular metabolic state and mutation of this gene impairs adaptation to restricted feeding schedules, suggesting that NPAS2 is required for effective control of a food entrainable oscillator. However, an alternative possibility, that NPAS2 is required for detection of metabolic cues signaling energy deficiency or for arousal of appropriate behavioral responses to such cues, as not been directly examined. Therefore, we examined the effect of targeted disruption of Npas2 on responses to several acute and chronic metabolic challenges. We found that under normal light-dark and ad libitum feeding conditions, Npas2 knockout (KO) mice did not differ from wild type (WT) controls with respect to diurnal feeding or blood glucose levels, body weight or size or body composition. Furthermore, feeding responses to overnight food deprivation, insulin- or 2-deoxy-D-glucose (2DG)-induced glucoprivation, mercaptoacetate (MA)-induced blockade of fatty acid oxidation and cold exposure did not differ by genotype. However, KO mice lost more weight than WT during overnight food deprivation and when placed on a 4-hr restricted feeding schedule, even though food intake did not differ between groups. Thus, it appears that NPAS2 is not required for detection of or behavioral responses to a variety of acute or chronic metabolic deficits, but is more likely to be involved in effective synchronization of feeding behavior with scheduled food availability.
Keywords: NPAS2, clock genes, food intake, body weight, 2-deoxy-D-glucose, mercaptoacetate, restricted feeding, phase shift, metabolic challenge, cold exposure, food deprivation
1. Introduction
Clock genes are widely expressed throughout the brain and are present in most peripheral tissues. The clock genes outside the light sensitive suprachiasmatic nucleus (SCN) express endogenous circadian rhythms that persist for several cycles, even in the absence of the SCN (1-2). The functions of clock genes outside the SCN, the physiological roles of the rhythms they generate, the mechanism that co-ordinate their rhythms and the zeitgebers that entrain these rhythms are poorly understood. However, the existence of a circadian controller, located outside the SCN and entrainable by food availability rather than light, has been recognized for several decades (3). This latter circadian control mechanism that entrains the animal's activity to scheduled food availability is referred to as the food entrainable oscillator (FEO) (4, 5).
Neither the location of the FEO nor the participant genes are currently known (6). However, Rutter and colleagues have recently suggested a role for neuronal PAS domain protein 2 (Npas2), a clock gene widely expressed in brain (7-8) and peripheral tissues (1). An important characteristic that makes NPAS2 a candidate player in the FEO is its responsiveness to cellular metabolic state. DNA binding of NPAS2: BMAL1 heterodimers (9), required for expression of genes encoding other components of the molecular clock (10), is regulated by the redox state of nicotinamide adenine dinucleotide (NAD) cofactors. Reduced forms of these cofactors enhance and oxidized forms inhibit DNA binding of the NPAS2:BMAL1 heterodimer (11). Thus, cellular metabolic state potentially constitutes an entrainment signal for this gene, coupling gene expression to changes in cellular activity, which is in turn dependent on systemic nutrient flux and food intake. Furthermore, Dudley et al. (12) have reported that mice with targeted disruption of Npas2 have abnormal activity and sleep rhythms under normal light:dark (LD) conditions. In addition, the mutant mice are more severely impaired than wild-type (WT) controls in their ability to adapt to a 4-hr light phase restricted feeding schedule. The investigators attributed these deficits to dysfunction of CNS mechanisms governing a food-entrainable oscillator.
In the present study, we further examine the effect of Npas2 deletion on feeding and body weight. As noted, previous work demonstrated that the KO mice given access to running wheels had difficulty adapting to a 4-hr light phase restricted feeding schedule. However, genetically intact rats and some strains of mice are known to be susceptible to activity-based anorexia when placed on restricted feeding schedules in combination with access to a running wheel (13-14) and this susceptibility can be influenced by seemingly subtle changes in environmental conditions (15). This phenomenon may have contributed to the deficits in Npas2 KO mice, since even the WT controls in the Dudley study had difficulty in adapting to this schedule (12). Therefore, in this experiment we evaluated mice in the absence of running wheel access to determine whether Npas2 KO mice exhibit deficits in response to a restricted feeding schedule that are independent of running wheel-induced activity.
Second, the greater vulnerability of Npas2 KO mice to restricted feeding demonstrated in the Dudley experiment may be due to an impaired ability to detect cellular metabolic deficits. Although the ability of Npas2 KO to respond to metabolic signals known to elicit increased food intake in genetically intact mice has not been evaluated, it has been shown that mice with mutations of Clock exhibit metabolic dysfunction. CLOCK, like NPAS2, forms heterodimers with BMAL1 and is sensitive to cellular redox state (11). Clock mutants are mildly hyperphagic and obese, lack a diurnal distribution of feeding (16), and exhibit delayed recovery from insulin-induced hypoglycemia (17). Thus, deletion of Npas2, which is similar to Clock in a number of ways, may also alter metabolic function. Furthermore, NPAS2 is widely distributed in diverse brain structures and in metabolically-crucial peripheral tissues such as liver and adipose tissue (18-20), where its functions are still unknown and where a metabolic role is likely. Therefore, in this study, we examined the effect of acute and chronic metabolic challenge on feeding and body weight of Npas2 KO mice. We analyzed feeding responses of KO and WT mice to both chronic and acute metabolic challenges, including a 10-hr dark phase advance, 4-hr light phase restricted feeding, overnight food deprivation, exposure to cold ambient temperature, glucoprivation induced by 2-deoxy-D-glucose (2DG, a glycolytic inhibitor) (21) or hyperinsulinemia, and lipoprivation induced by β-mercaptoacetate (MA, a mitochondrial acyl-coA dehydrogenase antagonist) (22). We also compared body weight, size and composition in adult littermates of the different genotypes. Our results strengthen the interpretation that the primary deficit in the Npas2 mutant mice is related to the brain's oscillatory mechanism for food-entrainable rhythmicity and not to the inability of these mice to detect or respond to metabolic challenges.
2. Materials and Methods
2.1. Animals
The Npas2 KO mice used in this study were offspring of mice kindly provided by Dr. McKnight (University of Texas Southwestern Medical Center, Dallas, Texas). They were generated by targeted disruption of the Npas2 allele and backcrossed to the C57BL/6J background (6 Garcia et al, 2000). Npas2 heterozygous mice were paired and caged separately. Each mouse pup was genotyped by PCR using the primer pairs that specifically recognize the wild type and mutant allele, respectively (8). Npas2 (+/+) mice were used as genotype (WT) controls. Wild type and mutant mice were housed in groups of 3-4 in cages located in a temperature-controlled room (25° C). A 12:12 hr light:dark (LD) cycle (lights on at 7 AM) was maintained throughout, except as noted. Animals were maintained and tested on standard rodent chow (5001, Purina Mills, LLC, Gray Summit, MO) and tap water. Food and water were available ad libitum unless specifically stated. All protocols were approved by Washington State University Institutional Animal Care and Use Committee.
2.2. Experimental designs
2.2.1. Feeding tests
After weaning, age-matched WT and Npas2 KO mice, at least 10 per genotype, were housed in groups of 3-4 in suspended wire mesh cages, respectively. Prior to feeding tests, a tray was placed underneath each cage to collect food spillage. At the beginning of each test, a weighed quantity of mouse chow was placed on the cage floor. At the end of each test period, food remaining in the cage, along with food spillage collected from the underlying tray, was collected and weighed. Food intake was calculated by subtracting the remaining chow, including spillage, from the weight of the chow given. To measure day- and night-time food consumption, food was measured at lights-off and lights-on, respectively. To examine the effects of photoperiod shifts, the dark phase was advanced 10 hours and the new light:dark schedule (lights on at 10 PM: lights off at 10 AM) was maintained for 12 days (until the rats adjusted their food intake to this schedule). For restricted feeding, mice were given fresh chow for 4 hours from 10:00 AM to 2:00 PM for 16 consecutive days. To test responses to overnight food deprivation, food was removed from the cages 2 hours before the onset of the dark period. Food intake was measured 16 hours later in a 4 hr test. To test glucoprivic feeding, ad libitum fed mice were injected with saline (0.9%, 2 ml/kg) or 2DG (Sigma-Aldrich Co., St. Louis, MO; 250 or 500 mg/kg, s.c., 2 ml/kg) at 10:00 AM. Fresh chow was provided immediately after the injection, and food intake was measured two and four hours later. Alternatively, mice were injected with saline or a hypoglycemic dose of insulin (Hospira, Inc., Lake Forest, IL, 3 U/kg, s.c.) at 10:00 AM and food intake was measured 2 and 4 hours later. To test lipoprivic feeding, MA (Sigma-Aldrich) was administered intraperitoneally using a dose (68 mg/kg, 2 ml/kg) shown previously to be effective in stimulating feeding in rats (23). MA or control solution (NaCl, 0.9%) was injected at 10:00AM. Fresh food was presented immediately after the injections and intake was measured 2 and 4 hours later.
2.2.2. DEXA scan
Wild type (n = 4) and Npas2 KO (n = 4) littermates were euthanized by inhalation of halothane (Halocarbon Laboratories, Inc., River Edge, NJ). Body length of each mouse was determined by the distance from the nose to the base of the tail. Body fat was determined by dual energy X-ray absorptiometry (DEXA) using a Hologic QDR 4500A machine (Hologic, Inc., Bedford, MA) with 11.1:3 software. DEXA has been used extensively for the direct determination of body fat in animals (24-25)
2.2.3. Blood glucose
Blood glucose concentrations were determined from tail blood samples using a hand held Fast Take glucose meter (LifeScan, Inc., Milpitas, CA). To determine daily blood glucose fluctuation, glucose was measured in the WT (n =10) and the KO (n=12) mice every four hours for 28 hours, starting at 7AM (Zeitgeber time = 0). Food availability was not restricted during this test. To examine effect of 2DG on the glucoregulatory increase in blood glucose, blood was sampled in the absence of food after injection of 2DG (500 mg/kg, s.c.). 2DG was injected at 10:00 AM. Blood samples were collected at 0, 30, 60, 90, 120, 180, and 240 min after the injection.
2.2.4. Cold adaptation
Prior to cold exposure, mice (n = 4 per genotype) were implanted surgically with a telemetry devices for continuous measurement of core body temperatures and locomotor activity. Mice were briefly anesthetized with isofluorene vapors (Webster Veterinary Supply, Sterling, MA) and then injected IP (0.1 ml/10 g body weight) with a ketamine-xylazine-acepromazine cocktail containing ketamine HCl (5 ml, 100 mg/ml, Fort Dodge Animal Health, Fort Dodge, IA), xylazine (2.5 ml, 20 mg/ml, Vedco, Inc., St. Joseph, MO); acepromazine (1 ml, 10 mg/ml, Vedco, Inc.) and 0.9% saline, 1.5 ml). The transmitter for telemetry (VitalView 3000 series, Philips, Andover, MA), which transmits signals through receivers in the cage floor to a computer, was implanted in the intraperitoneal cavity. The animal was then allowed to recover from surgery for one week. During this time, the mice were housed in and habituated to the environmental chamber in which the experiment was to be conducted. While in the chamber, mice were maintained on a 12:12 light:dark schedule. During the habituation period, the temperature was held at 24° C. Subsequently, the temperature was lowered 5° C/day until 4° C was reached on day 4. The mice were then maintained at 4° C for six days. Ambient temperature, core body temperature, food intake, and body weight, measured at 10:00 AM daily, were used in the data analysis. The baseline for food intake was calculated as the mean of the last five days of food intake for each mouse prior to the reduction of ambient temperature.
2.3. Statistical Analysis
Data are expressed as means ± standard error of mean (SEM). Results were analyzed using SigmaStat© software. For multivariate analyses across time, two-way repeated measures ANOVA was used. Holm-Sidak or Student-Newman-Keuls post hoc tests were applied when the F value was significant. The critical level for significance was set at P < 0.05.
3. Results
3.1. Feeding rhythms and body weights
Npas2 (-/-) mice were healthy and did not exhibit chronic metabolic problems that altered body weight. Table 1 shows that body weights of adult KO mice (n=15) were virtually identical to WT mice (n=15) at 6, 7, 8 and 9 months of age. Body length and body composition were not different between the genotypes (Table 2). Fat as percentage of body weight was 20.5 ± 1.7 % (WT) and 23.4 ± 2.1 % (KO) and did not differ significantly by genotype. Figure 1 shows that the KO and WT mice consumed similar amounts of food during both the light (1.15 ± 0.06 g and 1.14 ± 0.07 g) and dark (3.16 ± 0.05g and 3.20 ± 0.08 g) phases of the circadian cycle and there were no differences in total daily food intake between the two genotypes (4.31 ± 0.10 g and 4.34 ± 0.13 g). Blood glucose concentration under ad libitum feeding conditions exhibited a clear and significant peak 4 hr into the light phase in both groups (one way ANOVA, WT, F(5, 59) = 5.97, P < 0.001; Npas2 KO, F(5, 69) = 4.09, P = 0.003) but there were no differences between genotypes in blood glucose level at any time during the light/dark cycle (F(5, 129) = 0.16; P = 0.98).
Table 1.
Body weight of Npas2 KO and WT mice at various ages.
| Genotype | 6 mo | 7 mo | 8 mo | 9 mo |
|---|---|---|---|---|
| WT | 30.1 ± 1.1 | 30.8 ± 1.1 | 31.2 ± 1.2 | 31.6 ± 1.9 |
| KO | 29.7 ± 1.6 | 30.6 ± 1.5 | 30.7 ± 1.6 | 30.6 ± 1.5 |
Body weights are expressed as mean ± SEM (g).
Table 2.
Body weight, length and composition of Npas2 KO and WT littermates.
| Genotype | Body Length (mm) | Lean Mass + BMC | Fat (g) | Body Weight (g) |
|---|---|---|---|---|
| WT | 85.3 ± 0.6 | 26.5 ± 0.9 | 6.8 ± 0.7 | 33.5 ± 1.1 |
| KO | 86.0 ± 0.4 | 27.8 ± 0.6 | 8.6 ± 1.0 | 36.3 ± 1.1 |
Values are expressed as means + SEM. Body length is distance from nose to base of tail. BMC is bone mineral content.
Figure 1.
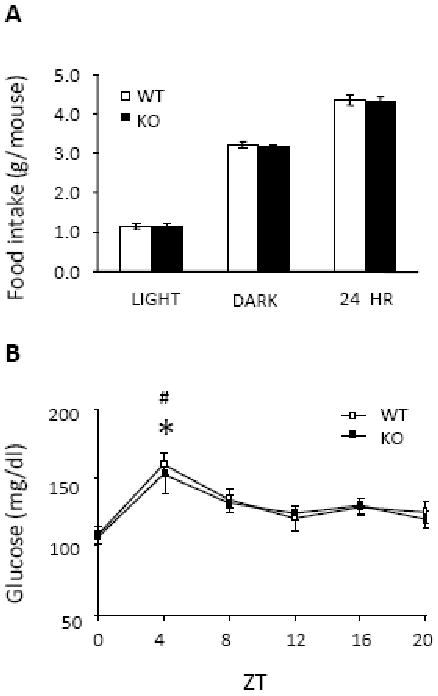
Food intake and blood glucose level under ad libitum feeding conditions in WT and Npas2 KO mice. A, day time, night time, and 24-hour food intake of age-matched WT (n = 15) and Npas2 KO (n = 16) mice. B, blood glucose levels in WT (n = 10) and KO (n = 12) mice measured at 4-hr intervals across a 12: 12 light/dark cycle. Blood glucose levels showed a significant peak 4 hr into the light phase, but values did not differ between genotypes at any time point. * P < 0.05 versus other ZT points in WT; # P < 0.05 versus other ZT points in KO mice. ZT, Zeitgeber time.
3.2. Food intake in response to chronic challenges
Figure 2 shows adaptation of WT and KO mice to a 10-hr dark phase advance. The means of the light phase and dark phase food intake during the four days preceding the phase shift was used as the baseline (day 0). To analyze effects of the phase shift, the ratio of food intake during the light phase to intake during the dark phase was determined (light/dark). A two-way repeated measures ANOVA was significant for the main effect of day (F(12, 91) = 256.0, P < 0.001) and group (F(1, 102) = 26.5, P = 0.002) and the interaction of group by day (F(12,91) = 5.3, P <0.001). With post hoc analysis, baselines of WT and KO mice were determined to be not different, but KO mice adapted more quickly than WT mice to the phase shift. Groups differed significantly from day 2 until day 7 (F(12, 103) = 5.07, P < 0.001). Intakes of KO returned to their pre-shift baseline on day 7, while WT intakes returned to their baseline on day 8. Total daily intakes did not differ between genotypes at any time during the 12-day period (F(12, 103) = 1.49; P = 0.15)
Figure 2.
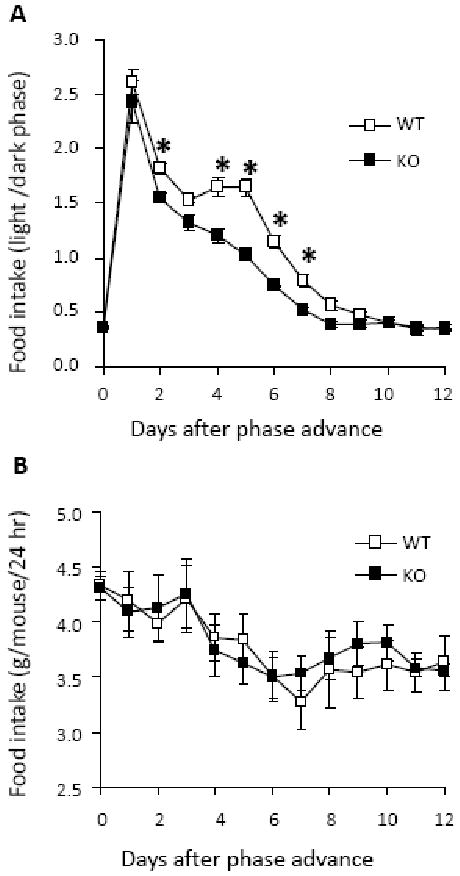
Food intake of WT (n = 15) and KO (n = 16) mice during the dark phase and light phase after a 10-hr dark phase advance. Ratios of feeding at lights on versus light off in a 12-day period after the advance are shown in A. Both genotypes adjusted their food intake to the new light/dark schedule, but KO mice adapted more quickly than WT mice. Groups differed significantly from day 2 until day 7. Intakes of KO returned to their pre-shift baseline on day 7, while WT intakes returned to their baseline on day 8. Total daily intakes (B) did not differ between genotypes at any time during the 12-day period. In both A and B, the day 0 value is the mean of the intakes for the 4 days immediately preceding the phase advance. #P < 0.05, KO versus WT; **P < 0.001, KO vs KO baseline; *P < .05, WT versus WT baseline.
Figure 3 shows the adjustment of food intake and body weight of Npas2 KO and WT mice to a 4-hr daily restricted feeding schedule during the light phase. The 24-hr food intake on the day preceding the food restriction period was used as the baseline (day 0) for analysis of the restricted feeding data. A two-way repeated measures ANOVA was significant for the main effect of day (F(16, 153) = 224.4, P < 0.001) but not of group (F(1, 168) = 1.1, P = 0.316). The interaction of group by day was significant (F(6, 153) = 3.2, P <0.001). With post hoc analysis, WT and KO mice were determined to be different only on day 6. Neither KO nor WT mice normalized their body weight during the 16 day restricted feeding period. Body weight (expressed as percent change from baseline) was significant for the main effect of group (F[1, 88] = 5.7, P = 0.043), day (F [8, 81] = 104.1, P <0.001) and their interaction (F[8, 81] = 2.8, P = 0.01). Body weights of WT and KO groups differed significantly from each other from day 8 onward. Bothe WT and KO mice differed significantly from their own baselines from day 2 onward.
Figure 3.
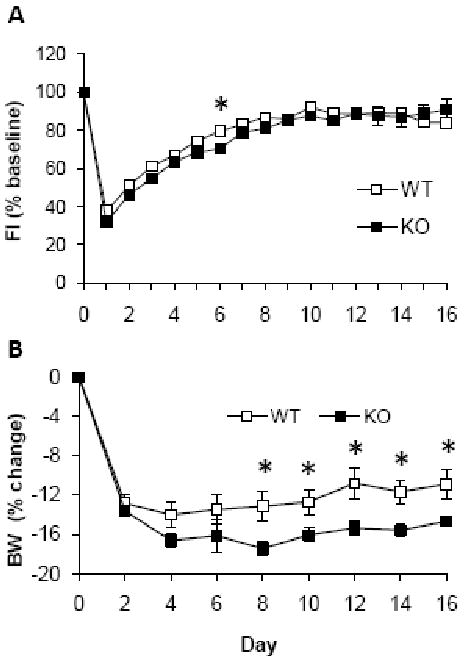
Food intake (A) and body weight (B) in WT (n = 17) and Npas2 KO (n = 14) mice during a 16-day period during which food access was restricted to a 4 hr period during the light phase (10AM - 2PM). Food intake did not differ significantly between WT and KO mice, except on day 6. Body weight (measured at 10AM each day before food was given) was significantly reduced from baseline in both groups beginning on day 2, and the body weight loss was significantly greater in KO mice from day 8 onward. Neither group recovered their body weight to baseline levels during the restricted feeding. * P < 0.05 KO versus WT.
Responses of KO and WT mice to overnight (16 hr) food deprivation are shown in Figure 4. The food consumed in the 4-hr test after deprivation were similar (KO 1.11 ± 0.06 g versus WT 1.16 ± 0.06 g; P = 0.51). Body weights at the start of the fast were also similar (KO 33.58 ± 0.61 g versus WT 35.51 ± 0.96 g; P = 0.1). However, the loss in body weight due to deprivation differed significantly between groups (KO -2.88 ± 0.12 g versus WT -2.58 ± 0.07 g, P = 0.04). Npas2 KO mice lost a greater percentage of their body weight after food deprivation (KO -8.61% ± 0.37% versus WT -7.31 % ± 0.23%, P = 0.01).
Figure 4.
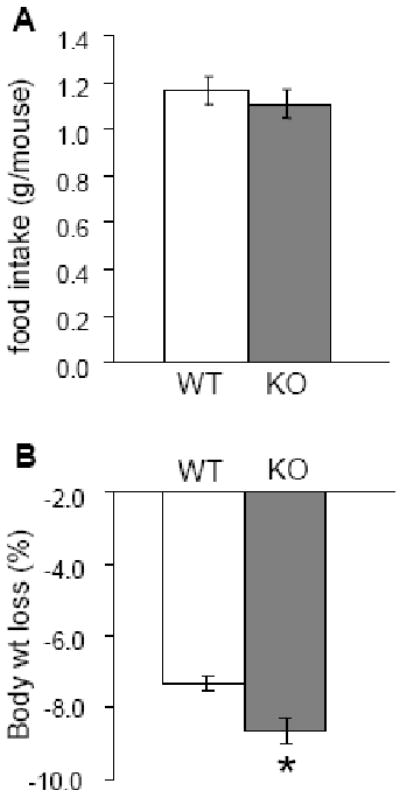
Food intake and body weight loss in WT (n = 17) and Npas2 KO (n = 13) mice after 16 hr overnight food deprivation. A, feeding measured in a 4-hour test after the fast did not differ by genotype (P = 0.51). B, body weights before the fast did not differ between WT and KO mice (P = 0.1). C, body weight lost after a 16-hr overnight fast was expressed as percentage of the initial weight. KO mice lost significantly more weight than WT after the fast. * P < 0.05 KO vs. WT.
Core body temperature, activity, food intake, and body weight of each mouse was measured daily during cold exposure (Figure 5). Both WT and KO mice maintained normal core temperature even at 4° C ambient temperature and were not different from each other (F(9, 72) = 0.69; P = 0.72). Although there was a significant effect of ambient temperature on activity (F = 8.3; P < .001), activity did not differ significantly between genotypes during the experiment. However, there was an interesting suggestion that activity was differentially increased in the KO mice on the day that the ambient temperature was initially lowered. WT and KO mice increased their daily food intake (F(9, 79) = 62.74; P < 0.001) to a similar degree during cold exposure (F(9, 79) = 0.56; P = 0.83), reaching a plateau after 4 days of exposure to 4° C ambient temperature. Mice gained body weight during cold exposure (F(9, 79) = 10.61; P < 0.001), except for a slight drop in the first two days at 4° C. Neither body weight at the beginning of the test (26.3 ± 0.6 g versus 25.1 ± 0.2 g; P = 0.11) nor weight change during cold exposure (F(9, 79) = 0.32; P = 0.97) differed by genotype.
Figure 5.
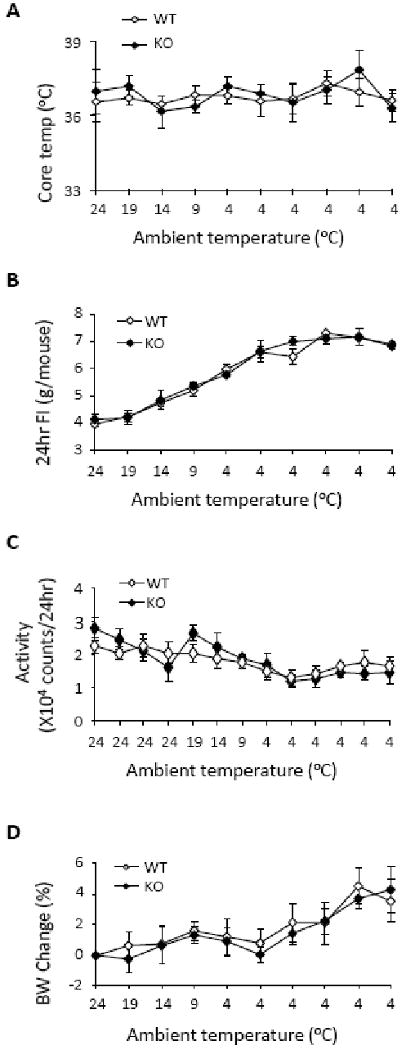
Adaptation of WT (n = 4) and KO (n = 4) mice to hypothermic challenge. A, core temperature did not differ between WT and KO mice at any time during the period of cold exposure. B, daily food intake (FI) increased as environmental temperature decreased, but was similar between genotypes. C, daily activity was measured continuously throughout the experiment and did not differ due to genotype. D, body weights (BW) did not differ between WT and KO mice either prior to or during cold exposure. Both WT and KO mice gained body weight during their exposure to cold.
3.3. Responses to acute metabolic challenges
Responses to acute blockade of glucose and fatty acid utilization are shown in Figure 6. Blood glucose response to 500 mg/kg 2DG, tested in the absence of food, did not differ between WT and KO mice at any time point (F(6, 181) = 0.41; P = 0.87). Both groups responded robustly with hyperglycemic responses that peaked 60 - 90 min and returned to baseline 240 min after 2DG injection (F(6, 181) = 110.33, P < 0.001). Food intake was also significantly increased in both KO and WT mice in response to 250 mg/kg of 2DG, insulin-induced hypoglycemia and MA. There were no differences in any test or time point due to genotype (WT versus KO with 2DG, F(1, 31) = 0.09, P = 0.77; insulin, F(1, 31) = 0.57, P = 0.46; or MA, F(1, 31) = 0.003, P = 0.96 by three-way ANOVA). Food intake after 500 mg/kg of 2DG was also examined in a 4-hr test. Both genotypes increased their food intake (F(1, 14) = 14.476, P = 0.009) to a similar extent in response to this 2DG dose, F(1, 14) = 0.263, P = 0.627 (data not shown).
Figure 6.
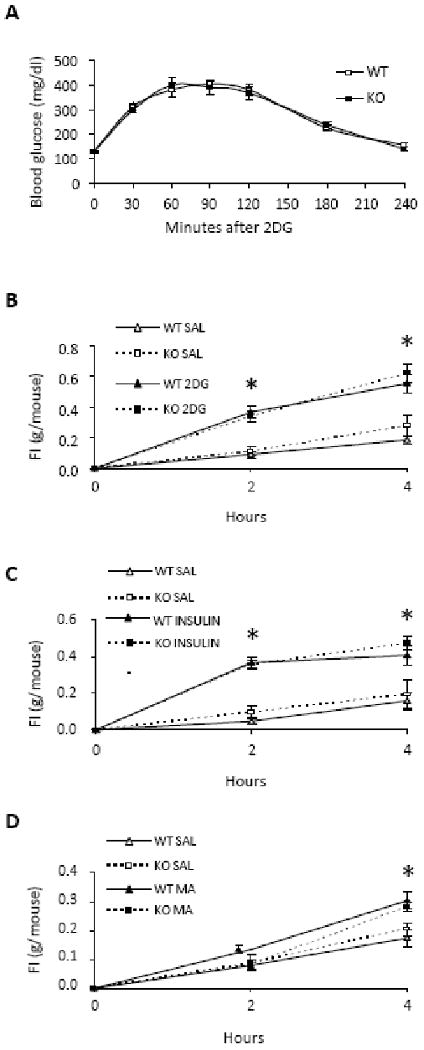
Responses to acute metabolic challenges in WT and Npas2 KO mice. The hyperglycemic response to systemic 2DG (500 mg/kg), tested in the absence of food, did not differ between WT (n = 13) and KO mice (n = 13) in A. Food intake was measured 2 and 4 hr after 2DG (250 mg/kg, s.c.) (B), a hypoglycemic dose of insulin (3 U/kg, s.c.) (C), MA (68 mg/kg, i.p.) (D). Saline (0.9%) was injected as control. Both KO (n = 11) and WT (n = 11) mice increased their food intake above baseline in response to all metabolic challenges, but the responses did not differ between phenotypes. *P < .05, within group drug vs saline.
4. Discussion
Under standard laboratory conditions, consisting of a 12h:12h light-dark cycle and ad libitum access to food, Npas2 KO and WT mice were similar in their responses to a number of acute and chronic metabolic challenges. Genotypes did not differ with respect to diurnal rhythm in blood glucose or feeding, in their total daily caloric intake, or in their blood glucose response to 2DG. Body weights measured at 6, 7, 8 and 9 months of age did not differ between genotypes. Neither did body length and composition differ between adult littermates of the two genotypes. Likewise, feeding in response to acute metabolic challenges, including 2DG-induced or insulin-induced glucoprivation and MA-induced reduction of fatty acid oxidation, did not differ between genotypes. Moreover, NPAS2 deletion did not impair the feeding response or the ability to maintain core body temperature and body weight during chronic hypothermic challenge. The normal responses to these challenges indicate that Npas2 KO mice are capable of detecting both acute and chronic metabolic challenges of various sorts and of using the associated cues to organize compensatory feeding responses.
Npas2 KO mice remained sensitive to photic cues. Indeed, they were significantly more efficient than WT mice in adapting their food intake to the 10 hr phase shift. A similar finding, reported previously, showed that Npas2 KO mice adapted their activity schedules more rapidly than WTs to a phase shift (12). This enhancement may suggest that the Npas mutant mice have an increased responsiveness to photic cues. Recent work has indicated that Npas2 in the suprachiasmatic nucleus can compensate for the loss of Clock in maintaining circadian rhythms (26). Therefore, it is possible that the more rapid adaptation to phase shift in the present experiment reflects a compensatory response to Npas2 mutation in critical areas by other photically-driven clock genes, such as Clock. Alternatively, the enhanced entrainment to phase shift may indicate that the mutant mice have a weaker entrainment of their feeding behavior to the previous light/dark schedule.
In contrast to their enhanced adaptation to phase shift, Npas2 KO mice responded with more difficulty than WT mice to a 4-hr restricted feeding schedule during the light phase, as was also reported previously (12). Although food intake did not differ between genotypes, except on a single day, KO mice lost significantly more weight than WT during restricted feeding. The KO mice in our study were not as severely impaired in their response to restricted feeding as in that study, where mice had access to a running wheel during restricted feeding. However, our results reveal that even without running wheel access, and when consuming the same amount of food as WT, the KO mice had more difficulty maintaining body weight during restricted feeding than WT controls. Moreover, the KO mice lost more body weight than WTs even in response to a single overnight food deprivation period, and despite the fact that both groups ate the same amount of food in the 4-hr test at the end of the deprivation period.
The reason for these differences between genotypes in ability to maintain body weight is presently unclear, but it seems unlikely that it is due to differences in either general activity or metabolic rate. Our Npas2 KO mice were indistinguishable from WTs across their life span with respect to body weight, length and composition, diurnal distribution of feeding and total daily food intake. In addition, the activity levels measured over several days during normal ambient temperature and cold exposure did not differ significantly between KO and WT mice. This would suggest that an increase in level of activity in the KO mice, if present, is related specifically to food deprivation. If so, this would strengthening the hypothesis that NPAS2 plays a role in coordinating activity level with feeding schedule (12, 27). Alternatively, the robust expression of Npas2 in liver and other peripheral tissues (1, 18-20) suggests the alternative possibility that Npas2 is involved in the temporal coordination of metabolically important visceral functions involved in digestion, absorption, storage and mobilization of ingested nutrients. If loss of this gene impairs the coordination of these functions, the KO mice would be more vulnerable to changes in food availability or feeding schedule.
NPAS2 deletion produced significant impairment in the ability of the KO mice to maintain body weight during restricted feeding and overnight food deprivation but does not impair the ability to control food intake in response to acute metabolic or thermal challenges. The fact that NPAS2 deletion impaired the ability of animals to adapt efficiently to an altered feeding schedule is consistent with the hypothesis that NPAS2 is required for effective control of a food entrainable oscillator. However, our data also indicate that this gene is not involved directly in monitoring metabolic signals for control of ingestion.
Acknowledgments
We wish to thank Dr. Steven L. McKnight (University of Texas Southwestern Medical Center, Dallas, Texas) for generously providing us Npas2 knockout mice. We also thank Dinh Thu and Dr. Ai Jun Li for technical assistance, Dr. James Krueger for use of his temperature-controlled chambers and Dr. Eva Szentirmai for expert assistance in their use. This work was supported by PHS grants DK40498 and DK081546 to S.R.
Footnotes
Publisher's Disclaimer: This is a PDF file of an unedited manuscript that has been accepted for publication. As a service to our customers we are providing this early version of the manuscript. The manuscript will undergo copyediting, typesetting, and review of the resulting proof before it is published in its final citable form. Please note that during the production process errors may be discovered which could affect the content, and all legal disclaimers that apply to the journal pertain.
References
- 1.Yamamoto T, Nakahata Y, Soma H, Akashi M, Mamine T, Takumi T. Transcriptional oscillation of canonical clock genes in mouse peripheral tissues. BMC Mol Biol. 2004;5:18–26. doi: 10.1186/1471-2199-5-18. [DOI] [PMC free article] [PubMed] [Google Scholar]
- 2.Yoo SH, Yamazaki S, Lowrey PL, Shimomura K, Ko CH, Burh ED, Siepka SM, Hong HK, Oh WJ, Yoo OJ, Menaker M, Takahashi JS. PERIOD2: LUCIFERASE real-time reporting of circadian dynamics reveals persistent circadian oscillations in mouse peripheral tissues. Proc Natl Acad Sci USA. 2004;101:5339–5346. doi: 10.1073/pnas.0308709101. [DOI] [PMC free article] [PubMed] [Google Scholar]
- 3.Stephan FK, Swann JM, Sisk CL. Entrainment of circadian rhythms by feeding schedules in rats with suprachiasmatic lesions. Behav Neural Biol. 1979;25:545–554. doi: 10.1016/s0163-1047(79)90332-7. [DOI] [PubMed] [Google Scholar]
- 4.Mistlberger RE. Circadian food anticipatory activity: formal models and physiological mechanisms. Neurosci Biobehav Rev. 1994;18:171–195. doi: 10.1016/0149-7634(94)90023-x. [DOI] [PubMed] [Google Scholar]
- 5.Stephan FK. The “other” circadian system: food as a Zeitgeber. J Biol Rhythms. 2002;17:284–292. doi: 10.1177/074873040201700402. [DOI] [PubMed] [Google Scholar]
- 6.Mendoza J. Circadian Clocks: Setting time by food. J Neuroendocrinol. 2007;19:127–137. doi: 10.1111/j.1365-2826.2006.01510.x. [DOI] [PubMed] [Google Scholar]
- 7.Zhou YD, Barnard M, Tian H, Li X, Ring HZ, Francke U, Shelton J, Richardson J, Russell DW, McKnight SL. Molecular characterization of two mammalian bHLH-PAS domain proteins selectively expressed in the central nervous system. Proc Natl Acad Sci USA. 1997;94:713–718. doi: 10.1073/pnas.94.2.713. [DOI] [PMC free article] [PubMed] [Google Scholar]
- 8.Garcia JA, Zhang D, Estill SJ, Michnoff C, Rutter J, Reick M, Scott K, Diaz-Arrastia R, McKnight SL. Impaired cued and contextual memory in NPAS2-deficient mice. Science. 2000;288:2226–2230. doi: 10.1126/science.288.5474.2226. [DOI] [PubMed] [Google Scholar]
- 9.Hogenesch JB, Gu Y, Jain S, Bradfield CA. The basic-helix-loop-helix-PAS orphan MOP3 forms transcriptionally active complexes with circadian and hypoxia factors. Proc, Natl Acad Sci USA. 1998;95:5474–5479. doi: 10.1073/pnas.95.10.5474. [DOI] [PMC free article] [PubMed] [Google Scholar]
- 10.Reick M, Garcia JA, Dudley C, McKnight SL. NPAS2: An analog of clock operative in the mammalian forebrain. Science. 2001;293:506–509. doi: 10.1126/science.1060699. [DOI] [PubMed] [Google Scholar]
- 11.Rutter J, Reick M, Wu LC, McKnight SL. Regulation of clock and NPAS2 DNA binding by the redox state of NAD cofactors. Science. 2001;293:510–514. doi: 10.1126/science.1060698. [DOI] [PubMed] [Google Scholar]
- 12.Dudley CA, Erbel-Sieler C, Estill SJ, Reick M, Franken P, Pitts S, McKnight SL. Altered patterns of sleep and behavioral adaptability in NPAS2-deficient mice. Science. 2003;301:379–383. doi: 10.1126/science.1082795. [DOI] [PubMed] [Google Scholar]
- 13.Routtenberg A, Kuznesof AW. Self-starvation of rats living in activity wheels on a restricted feeding schedule. J Comp Physiol Psychol. 1967;64:414–421. doi: 10.1037/h0025205. [DOI] [PubMed] [Google Scholar]
- 14.Gelegen C, Collier DA, Campbell IC, Oppelaar H, van den Heuvel J, Adan RA, Kas MJ. Difference in susceptibility to activity-based anorexia in two inbred strains of mice. Eur Neuropsychopharmacol. 2007;17:199–205. doi: 10.1016/j.euroneuro.2006.04.007. [DOI] [PubMed] [Google Scholar]
- 15.de Groot MH, Rusak B. Housing conditions influence the expression of food-anticipatory activity in mice. Physiol Behav. 2004;83:447–457. doi: 10.1016/j.physbeh.2004.08.037. [DOI] [PubMed] [Google Scholar]
- 16.Turek FW, Joshu C, Kohsaka A, Lin E, Ivanova G, McDearmon E, Laposky A, Losee-Olson S, Easton A, Jensen DR, Eckel RH, Takahashi JS, Bass J. Obesity and metabolic syndrome in circadian clock mutant mice. Science. 2005;308:1043–1045. doi: 10.1126/science.1108750. [DOI] [PMC free article] [PubMed] [Google Scholar]
- 17.Rudic RD, McNamara P, Curtis AM, Boston RC, Panda S, Hogenesch JB, FitzGerald GA. BMAL1 and CLOCK, two essential components of the circadian clock, are involved in glucose homeostasis. PLoS Bio. 2004;2:1893–1899. doi: 10.1371/journal.pbio.0020377. [DOI] [PMC free article] [PubMed] [Google Scholar]
- 18.Liu S, Cai Y, Sothern RB, Guan Y, Chan P. Chronobiological analysis of circadian patterns in transcription of seven key clock genes in six peripheral tissues in mice. Chronobiol Int. 2007;24:793–820. doi: 10.1080/07420520701672556. [DOI] [PubMed] [Google Scholar]
- 19.Bertolucci C, Cavallari N, Colognesi I, Aguzzi J, Chen Z, Caruso P, Foá A, Tosini G, Bernardi F, Pinotti M. Evidence for an overlapping role of CLOCK and NPAS2 transcription factors in liver circadian oscillators. Mol Cell Biol. 2008;28:3070–3075. doi: 10.1128/MCB.01931-07. [DOI] [PMC free article] [PubMed] [Google Scholar]
- 20.Zvonic S, Ptitsyn AA, Conrad SA, Scott LK, Floyd ZE, Kilroy G, Wu X, Goh BC, Mynatt RL, Gimble JM. Characterization of peripheral circadian clocks in adipose tissues. Diabetes. 2006;55:962–970. doi: 10.2337/diabetes.55.04.06.db05-0873. [DOI] [PubMed] [Google Scholar]
- 21.Brown J. Effects of 2-deoxy-d-glucose on carbohydrate metabolism: review of the literature and studies in the rat. Metabolism. 1962;11:1098–1112. [PubMed] [Google Scholar]
- 22.Bauché F, Sabourault D, Guidicelli Y, Nordmann J, Nordmann R. 2-mercaptoacetate administration depresses the β-oxidation pathway through an inhibition of long-chain acyl-CoA dehydrogenase activity. Biochem J. 1981;196:803–809. doi: 10.1042/bj1960803. [DOI] [PMC free article] [PubMed] [Google Scholar]
- 23.Singer-Koegler LK, Magluyan P, Ritter S. The effects of low-, medium-, and high-fat diets on 2-deoxy-D-glucose- and mercaptoacetate-induced feeding. Physiol Behav. 1996;60:321–323. doi: 10.1016/0031-9384(95)02142-6. [DOI] [PubMed] [Google Scholar]
- 24.Rose BS, Flatt WP, Martin RJ, Lewis RD. Whole body composition of rats determined by dual energy X-ray absorptiometry is correlated with chemical analysis. J Nutr. 1998;128:246–250. doi: 10.1093/jn/128.2.246. [DOI] [PubMed] [Google Scholar]
- 25.Lukaski HC, Hall CB, Marchello MJ, Siders WA. Validation of dual x-ray absorptiometry for body-composition assessment of rats exposed to dietary stressors. Nutrition. 2001;17:607–613. doi: 10.1016/s0899-9007(01)00577-9. [DOI] [PubMed] [Google Scholar]
- 26.DeBruyne JP, Weaver RD, Reppert SM. CLOCK and NPAS2 have overlapping roles in the suprachiasmatic circadian clock. Nat Neurosci. 2007;10:543–545. doi: 10.1038/nn1884. [DOI] [PMC free article] [PubMed] [Google Scholar]
- 27.Rutter J, Reick M, McKnight SL. Metabolism and the control of circadian rhythms. Annu Rev Biochem. 2002;71:307–331. doi: 10.1146/annurev.biochem.71.090501.142857. [DOI] [PubMed] [Google Scholar]


