Abstract
Recently, a novel method for detection of DNA synthesis has been developed based on the incorporation of 5–ethynyl–2′–deoxyuridine (EdU), a thymidine analogue, into cellular DNA and the subsequent reaction of EdU with a fluorescent azide in a copper–catalyzed [3+2] cycloaddition (“Click” reaction). In the present study, we evaluated this method for studying cell proliferation in the adult central nervous system in comparison with the “gold standard” method of 5–bromo–2′–deoxyuridine (BrdU) staining using two behavioral paradigms, voluntary exercise and restraint stress. Our data demonstrate that the number of EdU positive cells in the dentate gyrus of the hippocampus (DG) slightly increased in an EdU dose–dependent manner in both the control and voluntary exercise (running) mouse groups. The number of EdU–labeled cells was comparable to the number of BrdU–labeled cells in both the control and running mice. Furthermore, EdU and BrdU co–localized to the same cells within the DG. Voluntary exercise significantly increased the number of EdU and BrdU positive cells in the DG. In contrast, restraint stress significantly decreased the number of EdU positive cells. The EdU positive cells differentiated into mature neurons. EdU staining is compatible with immunohistochemical staining of other antigens. Moreover, our data demonstrated EdU staining can be combined with BrdU staining, providing a valuable tool of double labeling DNA synthesis, e.g., for tracking the two populations of neurons generated at different time points. In conclusion, our results suggest that EdU staining is a fast, sensitive and reproducible method to study cell proliferation in the central nervous system.
Keywords: 5–ethynyl–2′–deoxyuridine, 5–bromo–2′–deoxyuridine, BrdU, adult neurogenesis, hippocampus
1. Introduction
The development of effective methods to study cell proliferation in the nervous system is critical for understanding developmental neurobiology and neural plasticity (Crawley et al., 1997). Two techniques, [3H]thymidine autoradiography and 5-bromo-2′-deoxyruidine (BrdU) immunohistochemistry, have been developed to label dividing cells. Both [3H]thymidine and BrdU are incorporated into dividing cells during DNA synthesis and are subsequently detected by autoradiography and immunohistochemistry, respectively. The BrdU staining method is more convenient than [3H]thymidine. Immunohistochemistry using anti-BrdU antibody allows co-localization of BrdU with up to three cell-type markers (Breunig et al., 2008). However, one major drawback of the BrdU staining method is that the protocol requires a DNA denaturation step, typically by hydrochloric acid treatment or by heating, in order to expose the incorporated BrdU to the anti-BrdU antibody (Rakic, 2002). These harsh staining conditions may damage tissue structure and potentially destroy cellular epitopes.
Recently, a novel method for detecting DNA synthesis has been developed by using 5-ethynyl-2′-deoxyuridine (EdU) (Buck et al., 2008; Cappella et al., 2008; Chehrehasa et al., 2009; Salic and Mitchison, 2008). EdU, also a thymidine analogue, is incorporated into cellular DNA during DNA replication. The incorporated EdU can be detected through a reaction between ethynyl group of EdU and a fluorescent azide in a copper-catalyzed [3+2] cycloaddition (“Click” reaction) (Fig. 1). Because the fluorescent azide is small in size, it can effectively diffuse into the double-stranded DNA and react with the ethynyl group of the incorporated EdU. As a result, EdU staining does not require DNA denaturation. The elimination of the DNA denaturation step preserves both the physical integrity of the specimen and the antigenicity of various protein markers.
Fig. 1.
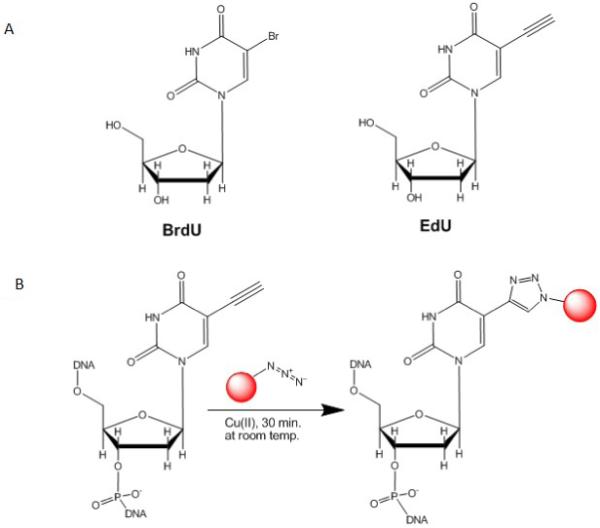
Chemistry of EdU detection. A: Chemical structures of BrdU and EdU. B: Click reaction between EdU and azide–modified dye. EdU contains an alkyne group which can be reacted with an azide–containing detection reagent to form a stable triazole ring.
New neurons are continuously generated from neural stem and progenitor cells in the adult mammalian brain (Encinas and Enikolopov, 2008; Zhao et al., 2008). Neurogenesis in the adult brain is limited to two areas: the subventricular zone (SVZ) of the lateral ventricles and the subgranular zone (SGZ) of the hippocampal dentate gyrus. In the dentate gyrus, neural precursors are born in the SGZ and migrate locally to the granule cell layer, where they differentiate into granule neurons and integrate into the existing circuitry of the hippocampus. Adult neurogenesis is regulated by both normal physiology as well as pathological behavior. For example, voluntary exercise has been demonstrated to increase neurogenesis in the hippocampal dentate gyrus (Kronenberg et al., 2006; van Praag et al., 1999). In contrast, restraint stress has been shown to decrease neurogenesis in the same region (Drew and Hen, 2007; Kannangara et al., 2008; Li et al., 2008) .
The use of EdU for studying proliferating cells in mouse brain has been reported by two groups. Salic and Mitchison made the first observation that EdU labeled very low levels of cell proliferation in adult mouse brain (Salic and Mitchison, 2008). Chehrehasa et al. have validated that the EdU staining method is a useful means to study neurogenesis by mainly using embryonic/neonatal mouse brain (Chehrehasa et al., 2009). In the current study we explore the possibility that the EdU staining method can be used to study adult neurogenesis in physiological models. We assessed EdU staining in mice undergoing voluntary exercise and restraint stress and directly compared EdU staining to the “gold standard” method of BrdU staining (Wojtowicz and Kee, 2006). Our results suggest that EdU staining is a fast and sensitive alternative to BrdU, and can be used in conjunction with BrdU to study neurogenesis in the adult brain.
2. Results
2.1. The number of EdU positive cells in the DG slightly increased in a dose-dependent manner
We first performed the EdU dose-response study in order to determine the adequate dose to label the maximal amount of proliferating cells. Groups of two month old female mice received a single injection of EdU intraperitoneally at a dose of 10, 20, 50, 100 or 200 mg/kg body weight. Each group consisted of six control mice and six running mice for each of the five dose levels. Four hours after EdU injection, mice were euthanized and brains were removed, snap frozen and stored at −80°C, then sectioned and stained for EdU-labeled cells. Our results showed that the numbers of cells which stained positive for EdU slightly increased in a dose-dependent manner within the range of the EdU doses tested both in the control and running mice (Fig. 2). After fitting the data to the statistical model (see methods), the maximal numbers of EdU positive cells (Nmax) were 1281 ± 21 (mean ± standard error) and 1751 ± 72 for the control and running mice, respectively; the EdU doses for 50% of the maximal labeling (D50) were 5.5 ± 0.6 mg (mean ± standard error) and 4.4 ± 1.3 mg for the control and running mice, respectively. For the majority of EdU doses examined, the running mouse group showed approximately1.3-fold increase in the number of EdU positive cells compared to the control mouse group. In addition, the fluorescent intensity of EdU-labeled cells significantly increased as the EdU doses increased from 10 to 200 mg/kg; the 50 mg/kg dose of EdU rendered near maximal intensity both in the control and running mice (data not shown). These data indicate that 50 mg/kg EdU was adequate for labeling proliferating cells at near saturation levels in terms of EdU positive cell numbers as well as the fluorescence intensity of the cells. These data also demonstrate that EdU staining is a sensitive and reliable method to detect and quantify proliferating cells in the adult brain.
Fig. 2.
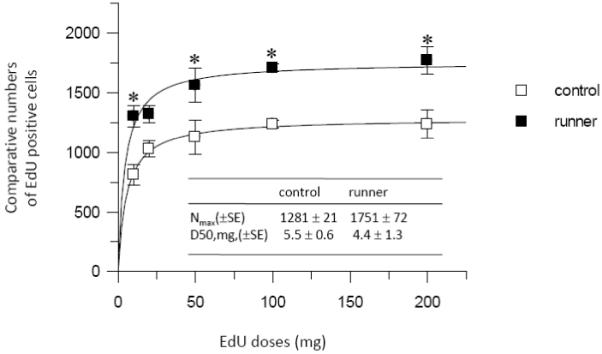
EdU dose–response experiment. Five groups (n=6) of two month old female mice received single injection of EdU intraperitoneally at a dose of 10, 20, 50, 100 or 200 mg/kg body weight. Four hours after EdU injection, brains were processed for EdU staining. EdU positive cell numbers slightly increased in a dose–dependent manner both in control and running mice. The data were fitted by Eq. A (see methods) to obtain a solid line from which Nmax and D50 values were calculated. SE stands for standard error. Bars represent mean ± SEM. * p < 0.05 in comparison to the control mouse group is considered significant using a two–tailed Student’s t–test.
2.2. The number of EdU-labeled cells was comparable to the number of BrdU-labeled cells
We directly compared EdU labeling with the gold standard BrdU technique for detection of proliferating cells in the adult hippocampus. It has been reported that a single injection of BrdU at a dose of 200-300 mg/kg is required to label the maximal amount of proliferating cells in the DG of adult rat brain (Cameron and McKay, 2001). Therefore, 200 mg/kg EdU and the equal molar dose of BrdU (243.5 mg/kg) were chosen for the comparison. Two groups of mice were injected with EdU (200 mg/kg) or BrdU (243.5 mg/kg). Each group consisted of six control mice and six running mice. Four hours after injection, mice were euthanized and brains were removed, snap frozen, stored at −80°C, then sectioned and stained for EdU or BrdU. Representative staining images are shown in Fig. 3A and B, and statistical data are shown in Fig 3C. Analysis using two-way ANOVA revealed that there was no significant interaction between the thymidine analogue treatment and exercise experience (p = 0.689). Mice undergoing voluntary exercise displayed significantly more EdU and BrdU positive cells than the control mice (p = 0.0012). However, there was no significant difference between the number of EdU-positive cells (1284 ± 124 for controls and 1661 ± 135 for the exercise group, mean ± SEM) and BrdU-positive cells (1236 ± 116 for controls and 1767 ± 172 for the exercise group) in both the control and exercise groups (p = 0.893). Therefore, both EdU labeling and BrdU labeling resulted in comparable numbers of proliferating cells in both groups of mice.
Fig. 3.
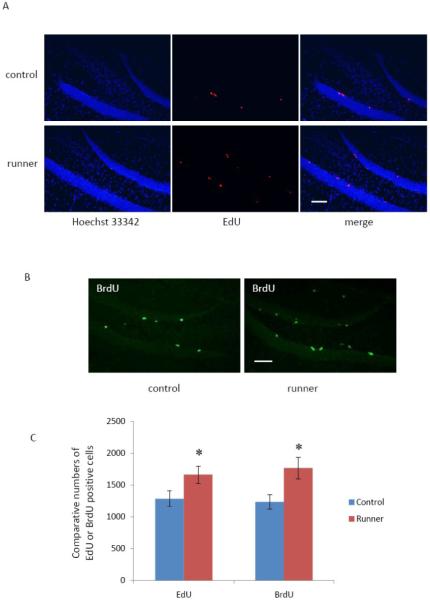
Comparison of EdU staining and BrdU staining. Two groups (n = 6) of mice were injected with EdU (200 mg/kg) or BrdU (243.5 mg/kg). Four hours after injection, brains were processed for EdU or BrdU staining. A: Representative images showing that running mice exhibited more EdU positive cells than control mice. EdU (red), Hoechst 33342 (blue). B: Representative images showing that running mice exhibited more BrdU positive cells than control mice. BrdU (green). C: Quantitative data showing that EdU and BrdU positive cell numbers are comparable. The bars represent mean ± SEM. * p < 0.05 in comparison to the control mouse group is considered significant using a two–way ANOVA. Scale bar = 100 μm.
2.3. EdU and BrdU co-localized in the dentate gyrus
Four mice received a single injection of EdU (200 mg/kg) and a single injection of BrdU (243.5 mg/kg). Four hours after injection the brains were processed as described above, and double immunolabeling of EdU and BrdU was performed. We first determined whether the “Click” reaction for the EdU staining had cross-reactivity to BrdU and whether the anti-BrdU antibody had cross-reactivity to EdU. Two anti-BrdU antibodies, one from Sigma-Aldrich and the other from Accurate Chemical & Scientific Corporation, were tested for their cross-reactivity to EdU in brain sections from mice injected only with EdU (200 mg/kg). We found that the anti-BrdU antibody from Sigma did not cross-react with EdU, while the anti-BrdU antibody from Accurate did cross-react with EdU (Fig. 4A). Both anti-BrdU antibodies labeled BrdU in control mice injected with BrdU alone (data not shown). Therefore, we chose the anti-BrdU antibody from Sigma for the double-labeling experiment. Next, we tested the “Click” EdU reaction for its cross-reactivity to BrdU in brain sections from mice injected with BrdU (243.5 mg/kg) alone. As expected, the “Click” reaction did not recognize BrdU because there is no ethynyl group in BrdU to react with the fluorescent azide (Fig. 4B). Finally, we performed the “Click” reaction and BrdU staining on brain sections from mice injected with EdU (200 mg/kg) and BrdU (243.5mg/kg). EdU and BrdU positive cells were quantified in the brain sections containing the dentate gyrus from both the control mouse and the running mouse. Every eighth 20 μm coronal section throughout the whole hippocampus was analyzed for each mouse. Our results showed that almost all (over 95%) the EdU positive cells and BrdU positive cells were co-localized (Fig. 4C). These data demonstrate that EdU and BrdU label the same cells in the dentate gyrus of the adult brain with similar efficiency.
Fig. 4.
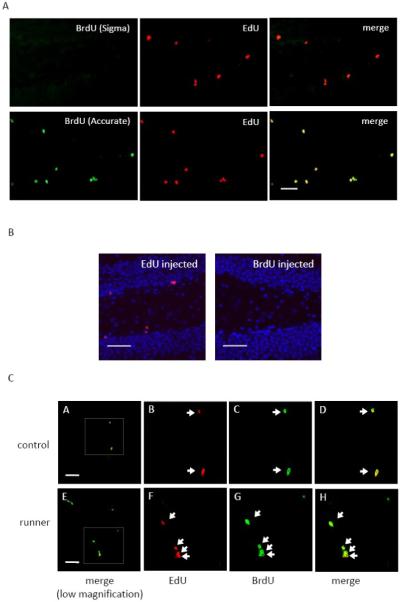
EdU and BrdU co–localize within the same cells of the DG. A: Representative images showing that the anti–BrdU antibody from Sigma did not recognize EdU on the DG sections from the mouse injected with only EdU (200 mg/kg); in contrast, the anti–BrdU antibody from Accurate had cross–reactivity to EdU. EdU (red), BrdU (green). Scale bar = 50 μm. B: Representative images showing that “Click” reaction recognized EdU (red) but not BrdU. Scale bar = 50 μm. C: Representative images showing that EdU and BrdU co–localize within the same cells (arrows) of the DG in control and running mice, both of whom received a single injection of EdU (200 mg/kg) and BrdU (243.5 mg/kg). a and e are images in low magnification. Scale bar = 50 μm. b-d are high magnification images for the region delineated by the box in a. Scale bar = 20 μm. f-h are high magnification images for the region delineated by the box in e. Scale bar = 20 μm.
2.4. Voluntary exercise significantly increased the survival of EdU positive cells and EdU positive cells differentiated into neurons
We examined the survival of EdU positive cells in the control and running mice. Six control mice and six running mice each received a single injection of EdU (100 gm/kg). Mouse brains were harvested after 30 days and EdU positive cells in the DG of the hippocampus were counted. The number of EdU positive cells in the running mice (632 ± 64, mean ± SEM) was significantly higher than in the control mice (80 ± 15, mean ± SEM) (Fig. 5A). In addition, the number of EdU positive cells at 30 days after EdU injection (Fig. 5A) was significantly less than at the 4 hour time point after EdU injection (Fig. 2), suggesting that only a small percentage of the newborn cells survive. This observation was true across both the control and running mice groups. In addition, the ratios of EdU positive cells in the running group over the control group at 4 hour and 30 day time points were approximately 1.3 and 7.9, respectively. This data suggests that voluntary exercise increases both cell genesis and cell survival, consistent with the reports in the literature (Steiner et al., 2004; van Praag et al., 2005). The data also demonstrate that EdU staining method is sufficiently sensitive to detect very low levels of the EdU positive cells and can be used to study the fate of the newborn cells in survival studies.
Fig. 5.
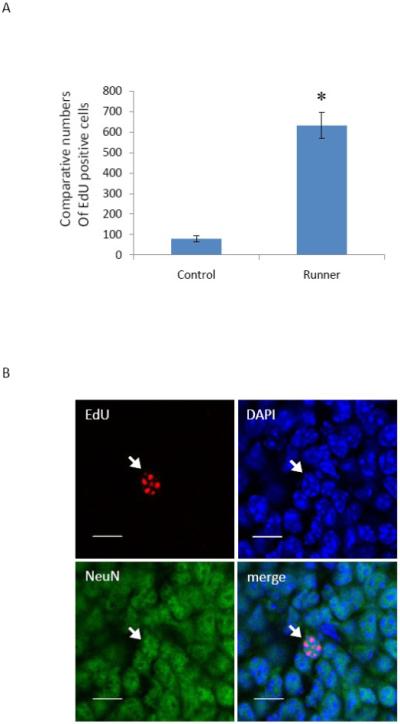
Voluntary exercise significantly increases the survival of the EdU positive cells and the EdU positive cells differentiated into neurons. Six control and running mice received a single injection of EdU (100 mg/kg) and continued in the respective conditions for 30 days. A: Quantitative data showing that voluntary exercise significantly increased the number of EdU positive cells. The bars represent mean ± SEM. p = 0.000029. * p < 0.05 in comparison to the control mouse group is considered significant using a two-tailed Student’s t–test. B: Representative confocal images showing the nucleus (arrows) triple–labeled with EdU (red), NeuN (green) and DAPI (blue). Scale bar = 10 μm.
We also examined whether EdU labeled cells differentiated into neurons. The brain sections from the mice at the 30 day time point were stained for EdU, neuronal nuclear protein (NeuN), and a DNA dye 4′, 6-diamidino-2-phenylindole (DAPI). EdU labeled cells co-expressed NeuN, a marker of mature neurons (Fig. 5B), suggesting that newborn cells differentiate into neurons 30 days after genesis.
2.5. Restraint stress significantly decreased the number of EdU-labeled cells in the dentate gyrus
We examined EdU staining in mice that underwent restraint stress for two hours daily, seven days in a row, compared to cage-control sibling littermates. All mice were injected i.p. with 100 mg/kg of EdU four hours prior to sacrifice. EdU staining results showed that the EdU-positive cell numbers in the DG of control and stressed mice were 1284 ± 231 and 669 ± 147 (mean ± SEM), respectively. Thus restraint stress significantly decreased the number of EdU-labeled cells in the subgranular zone of the dentate gyrus (p < 0.05) (Fig. 6).
Fig. 6.
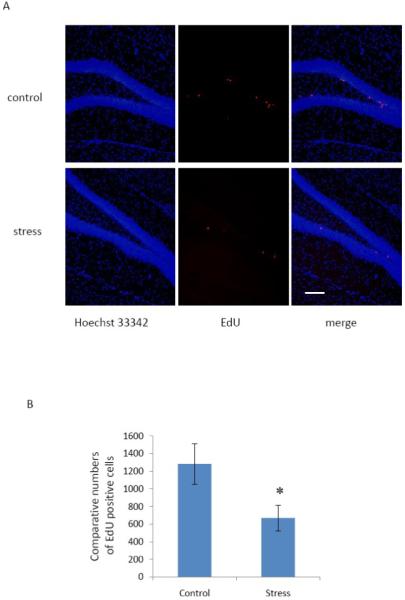
Restraint stress significantly decreases EdU positive cells. Control and stressed mice were injected i.p. with 100 mg/kg of EdU four hours prior to sacrifice. A: Representative images showing that the mice under stress show fewer numbers of EdU positive cells than control mice. EdU (red), Hoechst 33342 (blue). B: Quantitative data showing that restraint stress significantly decreases the number of EdU–labeled cells in the dentate gyrus. The bars represent mean ± SEM. * p < 0.05 in comparison to the control mouse group is considered significant using a two–tailed Student’s t–test. Scale bar = 100 μm.
2.6. EdU staining was compatible with the immunostaining methods for various molecular markers
To determine if the “Click” reaction protocol is compatible with the immunostaining methods for other molecular markers, we processed brain sections by double staining EdU and glial fibrillary acidic protein (GFAP) (Fig. 7), which is an astrocyte marker and also expressed in radial neuronal precursor cells. Our data showed that EdU staining was compatible with GFAP staining. As shown previously in Fig. 5B, EdU was also compatible with staining of the mature neuronal marker, NeuN. Furthermore, EdU staining was compatible with DNA staining with Hoechst 33342 and DAPI (Fig. 6A and Fig. 7). Hoechst 33342 and DAPI are fluorescent dyes used for labeling DNA by binding to the minor groove of the DNA. Hoechst 33342 and DAPI staining are useful for revealing the nuclear structure of DG neurons, allowing for determination of the location of newborn cells. The compatibility of EdU staining and the immunostaining for various molecular markers allows for convenient co-localization studies of EdU with different molecular markers. Moreover, we previously showed that EdU staining can be used in combination with BrdU staining (Fig. 4C). The double staining of EdU and BrdU provides a valuable tool to study biological questions regarding cell proliferation and DNA synthesis and allows the potential to identify different cell populations within the brain generated at different time points.
Fig. 7.
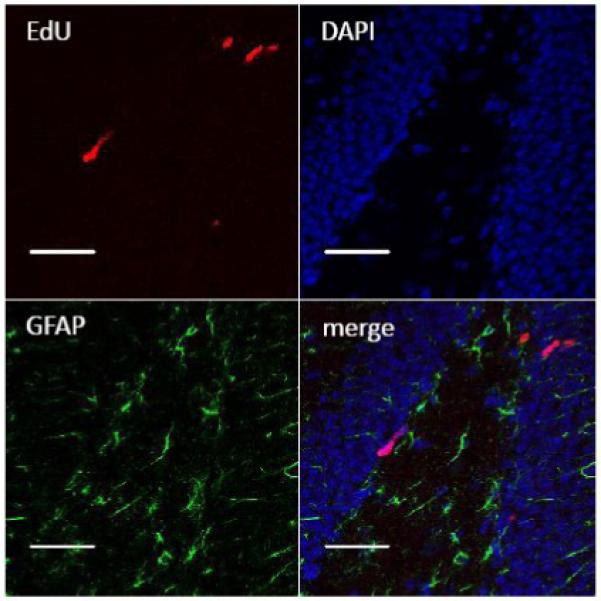
EdU staining is compatible with GFAP immunostaining. Representative images show that EdU (red) staining is compatible with GFAP (green) immunostaining. DAPI (blue) stains nuclei. Scale bar = 50 μm.
3. Discussion
In the current study, we report the use of EdU for detecting adult neurogenesis in mice using both the voluntary exercise and restraint stress mouse models. We demonstrate that EdU staining reliably labels proliferating cells in the dentate gyrus region of the hippocampus, and the number of EdU positive cells slightly increases in an EdU dose-dependent manner both in control and running mice. We then compared EdU staining with the gold standard BrdU assay. The EdU method identified a comparable number of proliferating cells in the hippocampus compared to BrdU assay in control and running mice. Furthermore, EdU and BrdU staining co-localized to the same proliferating cells in the dentate gyrus. We also showed that voluntary exercise significantly increases EdU positive cell numbers in the DG, whereas restraint stress significantly decreases EdU positive cell numbers compared to control mice. Lastly, we show that the EdU positive cells differentiate into mature neurons and the EdU staining is compatible with the immunostaining techniques used for various molecular markers.
The EdU dose-response data showed that the EdU-labeled cell numbers slightly increased as the EdU dose increased from 10 to 200 mg/kg. The 50 mg/kg dose of EdU resulted in near saturation labeling of proliferating cells in the DG. We compared our EdU dose response data with the BrdU dose response data with the similar experimental setting in the literature. Mandyam et al reported that the BrdU positive cell numbers in the DG of C57BL/6 mice increased in a dose-dependent manner within a range of 25-500 mg/kg, and 150 mg/kg labeled all the actively dividing cells. It appears that the EdU assay is, at least, as sensitive as the BrdU assay (Mandyam et al., 2007). We also compared our dose-response data with the data reported by Chehrehasa et al. (Chehrehasa et al., 2009). They performed EdU labeling in the embryonic mouse brain, and found that 12 mg/kg and 50 mg/kg EdU, the highest dose tested, labeled a similar amount of proliferating cells. The slight discrepancy between our data and the data reported by Chehrehasa et al could be due to the possible underestimation of the EdU-labeled cell numbers at the lower dose such as 10 mg/kg in our study. At the lower dose of EdU, the fluorescent intensity of EdU positive cells is low and consequently the detectability is low. Therefore, the saturating dose of EdU should be used to obtain reliable quantitative data.
We reported that the fluorescence intensity of EdU-labeled cells markedly increased as the EdU doses increased and 50 mg/kg EdU resulted in the near maximal fluorescence intensity within the EdU dose range tested (10 to 200 mg/kg). This phenomenon could be due to the increased rate of EdU incorporation into DNA, the increased bioavailability of EdU, or both, as the EdU dose increased. The bioavailability of EdU depends on at least two factors: transportation of EdU into the brain and its clearance from the brain. Recent studies in vivo showed that thymidine enters the brain primarily through facilitative nucleoside transport systems at the blood-brain barriers (Thomas and Segal, 1997). Also, in vitro studies suggest that BrdU is transported by the same active nucleoside transport systems (Spector, 1982; Spector and Huntoon, 1984). It is possible that EdU uses the same transport system and this possibility should be further studied. The clearance of [3H] thymidine and BrdU from the body has long been believed to occur rapidly, around 30 minutes (Packard et al., 1973). However, a recent study using embryonic tissue suggests that both markers may continue to label cells in the brain for 5-6 hours (Hayes and Nowakowski, 2000). It is also suggested that [3H] -thymidine and BrdU continue to label S-phase cells for 2 hours in the dentate gyrus of adult rat (Cameron and McKay, 2001). The clearance rate of EdU from the brain has not yet been studied. It is possible that with a higher EdU dose, more EdU is transported into the brain and therefore it takes a longer time to clear EdU from the brain. It is also possible that the increased concentration of EdU in the brain facilitates the incorporation of EdU into DNA per unit time. The increased bioavailability of EdU and/or EdU incorporation rate could contribute to the more intense fluorescence at higher EdU doses.
The double labeling of DNA synthesis has been achieved by injecting chlorodeoxyuridine (CldU) and iododeoxyuridine (IdU), two thymidine analogues, in tissues and subsequently detecting CldU and IdU with different antibodies against them (Burns and Kuan, 2005; Vega and Peterson, 2005). The use of two different DNA synthesis markers together is a valuable tool to study many types of biological questions such as cell cycle kinetics as well as the temporal and regional patterns of new born cells in the nervous system. The thymidine analogue double-labeling method has been used to determine the length of the S-phase of cell cycle of neural progenitor cells in the adult mouse DG (Burns and Kuan, 2005). This doubling method has also been used to track the two populations of neurons generated on different embryonic days by separate injection of CldU (or BrdU) and IdU on the two different days and subsequent detection of the thymdine analogues on the postnatal day using immunohistochemistry (Breunig et al., 2008; Vega and Peterson, 2005). In the current study we showed that EdU staining was compatible with BrdU staining. Almost all the EdU-labeled cells and BrdU-positive cells co-localized. These data suggested that the EdU and BrdU staining methods detected DNA synthesis with the same efficiency, which is a critical requirement for both qualitative and quantitative studies of cell proliferation. The use of EdU and one of the halogenated thymidine analogues such as BrdU appears to be an excellent alternative for double-labeling DNA synthesis in tissues.
EdU and BrdU staining methods shared several common characteristics. Both EdU and BrdU label the same population of proliferating cells. Both EdU and BrdU staining methods detect proliferating cells with similar sensitivities under our experimental conditions. Both methods are compatible with immunohistochemical staining for certain molecular markers such as NeuN and GFAP. On the other hand, there are several advantages of EdU staining over BrdU staining. First, EdU staining does not require DNA denaturation and therefore preserves the integrity of tissue. Second, EdU staining techniques may conserve antigenicities for molecular markers, whereas BrdU staining may damage some antigen epitopes during the necessary DNA denaturation step. Using DNAse treatment to denature DNA for BrdU immunocytochemistry has been shown to offer better antigenicity compared to acid denaturation; however, this method decreases the sensitivity of the BrdU staining (Dinjens et al., 1992). Third, EdU staining is much faster than BrdU staining. The standard “Click” reaction for detecting EdU takes 30 minutes, whereas BrdU detection usually requires overnight incubation of tissues with primary anti-BrdU antibodies. Thus, EdU staining can be used to study cell proliferation in the nervous system as an alternative of BrdU staining and will be an important tool in the field of cellular proliferation.
In conclusion, our data in the present study, in combination with previous reports including Chehrehasa et al., demonstrate that EdU staining is a fast, sensitive and reproducible method to study cell proliferation in the embryonic, early post-natal and adult brain.
4. Experimental procedures
4.1. Voluntary exercise mouse model
All animal experiments were conducted in compliance with the US National Institutes of Health Guidelines for the Care and Use of Laboratory Animals, with the approval of Washington University’s Animal Studies Committee. Two month old female mice (C57BL/6) were either housed in standard mouse shoebox cages with 4 mice per cage (control) or in a larger rat shoebox cage with 2 exercise wheels and 3 mice per cage (runner). The mice were allowed to run for 12 days. Use of exercise wheels was visually confirmed. On day 13, mice were injected with the appropriate thymidine analogue. Mouse brains were then harvested 4 hours after injection of EdU or BrdU in all studies except for the survival studies of the EdU positive cells, in which the mouse brains were harvested 30 days after EdU injection as described below.
For the EdU dose-response experiment, five groups of mice received single intraperitoneal injection of EdU (Invitrogen, Carlsbad, CA) at a dose of 10, 20, 50, 100 or 200 mg/kg body weight. Each group had six control mice and six running mice. For comparison of EdU and BrdU staining, two groups of mice received a single intraperitoneal injection of EdU (200 mg/kg) or the equimolar dose of BrdU (Sigma, St. Louis, MO) (243.5 mg/kg). Each group had six control mice and six running mice. For survival studies, six control mice and six running mice received a single injection of EdU (100 mg/kg). The mice continued in the respective experimental conditions for 30 days. The brains were then harvested. For co-localization studies of EdU and BrdU, two independent experiments were performed. In one experiment, one control mouse and one running mouse received a single intraperitoneal injection of EdU (200 mg/kg) and a single injection of BrdU (243.5 mg/kg). In the other experiment, two control mice were treated in the same way.
Mouse brains were harvested 4 hours or 30 days after injection of the thymidine analogue. Mice were euthanized, and brains were removed, snap-frozen and stored at −80°C. The frozen mouse brains were sectioned at 20 μm with a cryostat and mounted onto Fisher Superfrost Plus slides. Every eighth 20 μm coronal section (160 μm apart) throughout the whole hippocampus was collected as one set; a total of eight sets were collected for each brain. One set of sections was randomly chosen for each of the following processes: EdU or/and BrdU staining, quantification of the fluorescence intensity of EdU-labeled cells, or immunohistochemical staining for protein markers, as described below.
4.2. Restraint stress mouse model
Two month old male mice (BL6/SJL) were randomly assigned to restraint stress or control groups (n=6 per group). Mice were subjected to restraint stress in a 50 mL conical tube as previously described (Drew and Hen, 2007) for two hours daily for 7 days in total. Control mice remained in their home cages. On the 7th day, all mice were injected i.p. with EdU 100 mg/kg and sacrificed four hours later. Brains were removed, snap-frozen on powdered dry ice, and sectioned using a cryostat as described above.
4.3. EdU staining
EdU staining was conducted using Click-iT™ EdU imaging kit (Invitrogen, Carlsbad, CA) according to the manufacturer’s protocol. This protocol is normally intended for use in cell culture, but was adapted for histological staining of brain tissue as follows. Slides containing mounted frozen brain sections were allowed to thaw to room temperature, and then fixed with 4% paraformaldehyde in phosphate buffer saline (PBS) for 15 min. After washing twice with 3% bovine serum albumin (BSA) in PBS the sections were permeablized with 0.5% Triton X-100 in PBS for 20 min. The sections were again washed twice with 3% BSA in PBS and then incubated with a Click-iT™ reaction cocktail containing Click-iT™ reaction buffer, CuSO4, Alexa Fluor® 594 Azide, and reaction buffer additive for 30 min while protected from light. The sections were washed once more with 3% BSA in PBS. For subsequent DNA staining, sections were washed once with PBS and then incubated with 5 μg/mL Hoechst 33342 for 30 min. The slides were then washed twice with PBS and coverslipped with Vectashield mounting media (Vector Laboratories Inc, Burlingame, CA). All steps were carried out at room temperature.
4.4. BrdU immunohistochemistry
Slides containing mounted frozen brain sections were allowed to thaw to room temperature, then were fixed with 4% paraformaldehyde in phosphate buffer saline (PBS) for 15 min and permeablized with 0.5% Triton X-100 in PBS for 20 min. The sections were then incubated with 2 N HCl for 60 min at 37 °C to denature DNA and neutralized with 0.1 M boric acid (pH 8.5) for 30 min. The sections were blocked with 1.5% normal horse serum (Vector Laboratories Inc, Burlingame, CA) in PBS for 1 h and incubated with rat anti-BrdU antibody (Accurate Chemical & Scientific, Westbury, NY) at 1:1000 dilution in the blocking serum overnight at 4 °C. After washing, sections were incubated with FITC-conjugated donkey anti-rat IgG secondary antibody (Jackson ImmunoResearch Laboratories, Inc, West Grove, PA) for 1 h. The slides were then immediately coverslipped with Vectashield mounting media (Vector Laboratories Inc, Burlingame, CA).
4.5. Double labeling of EdU and BrdU, or EdU and other molecular markers
EdU staining and BrdU staining were performed sequentially as described above. Briefly, brain sections were fixed with 4% paraformaldehyde in phosphate buffer saline (PBS) for 15 min and permeablized with 0.5% Triton X-100 in PBS for 20 min. The sections were then incubated with a Click-iT™ reaction cocktail for 30 min for EdU staining. The sections were then incubated in 2 N HCl for 60 min at 37 °C to denature DNA and neutralized with 0.1 M boric acid (pH8.5) for 30 min. The sections were blocked with 1.5% horse normal serum (Vector Laboratories Inc, Burlingame, CA) in PBS for 1 h and incubated with mouse anti-BrdU antibody (Sigma, St. Louis, MO) at 1:200 dilution in the blocking serum overnight at 4 °C. After washing, sections were incubated with FITC-conjugated donkey anti-mouse IgG secondary antibody (Jackson ImmunoResearch Laboratories, Inc, West Grove, PA) for 1 h. For immunostaining of neuronal nuclear protein (NeuN), mouse anti-NeuN antibody (Millipore, Billerica, MA) at 1: 50 dilution and FITC-conjugated donkey anti-mouse IgG (Jackson ImmunoResearch Laboratories, Inc, West Grove, PA) at 1:100 dilution were used. For immunostaining of glial fibrillary acidic protein (GFAP), rabbit anti-GFAP polyclonal antibody (Abcam Inc, Cambridge, MA) at 1:500 dilution and FITC-conjugated donkey anti-rabbit IgG secondary antibody (Jackson ImmunoResearch Laboratories, Inc, West Grove, PA) at 1:100 dilution were used. The slides were coverslipped with Vectashield mounting media (Vector Laboratories Inc, Burlingame, CA).
4.6. Microscopy and cell counting
Every eighth 20 μm coronal section throughout the entire hippocampus was analyzed from each animal after immunostaining for EdU and/or BrdU. The positive cells in the SGZ of the DG were manually counted using a 20x/0.75 objective under an epifluorescence microscope (Nikon Eclipse E600, Nikon Instrument Inc., Melville, NY) equipped with a digital camera (Nikon DXM1200F) while focusing down through the tissue. Resulting numbers were multiplied by eight to provide an estimate of the total number of positive cells in the SGZ of the DG for each half brain and were reported as the comparative numbers of EdU positive cells. For counting BrdU positive cells, a B-2E/C FITC filter block containing a 465-495 nm excitation filter and a 515-555 band-pass filter for collecting emission was used. For counting EdU positive cells, a G-2E/C TRITC filter block containing a 528-553 nm excitation filter and a 600-660 band-pass filter for collecting emission was used. The optical path was set to 100% of the binocular eyepiece to provide the maximal fluorescent intensity to visualize the positive cells for cell counting. Control brain sections from animals that were not injected with EdU or BrdU were immunostained as background controls. In the majority of cases, BrdU (or EdU) positive cells displayed significantly stronger fluorescent intensity than the background control and allowed for easy manual recognition of the positive cells. In the cases when the fluorescent intensity was weak, a 40x/0.95 objective was used to carefully examine the fluorescent intensity and the nuclear shape of the staining. The cells which showed nuclear staining and a brighter fluorescence intensity than controls were counted as positive.
4.7. Quantification of the fluorescence intensity in EdU-labeled cells
To study the EdU-dose dependence of the fluorescence intensity in EdU-labeled cells, we used two control mice and two running mice for each EdU dose group (10, 20, 50, 100 or 200 mg/kg). For each mouse two brain sections were chosen so that the sections were from the same region of the DG for all the analyzed mice. About one hundred cells were analyzed for each dose group. The EdU-labeled cells in the sections were imaged with a 20x/0.75 objective under an epifluorescence microscope with the same exposure setting for all the dose groups. The fluorescence intensity of each EdU-labeled cell was quantified using Image J software (National Institute of Health) and averaged for each dose group.
4.8. Statistical analysis
EdU and BrdU positive cell numbers were expressed as the mean ± SEM. The EdU dose response data were analyzed by nonlinear regression using GraFit software, version 5 (Erithacus Software Limited ,UK). The data were fitted by Eq. A:
| (A) |
Where N is the EdU positive cell number at each EdU dose, Nmax is the maximal EdU positive cell number, and D50 is the EdU dose at which the EdU positive cell number equals one-half of Nmax. The standard errors, which were equal to the squared standard deviation, were calculated for Nmax and D50 by the GraFit software.
The differences in EdU positive cell numbers between the control and running groups at each EdU dose were analyzed using a two-tailed student’s t-test. The differences in EdU and BrdU positive cell numbers in both the control and running groups were analyzed by a two way ANOVA using PRISM software (GraphPad Software, Inc. San Diego, CA). A p value of < 0.05 was considered significant.
Acknowledgments
Research funded by NS 48056, the McDonnell Center for Systems Neuroscience at Washington University, and Charles and Joanne Knight Alzheimer’s Research Initiative of the Washington University Alzheimer’s Disease Research Center. Research is also partly funded by Cure Alzheimer’s Fund and NIH Neuroscience Blueprint Center Core Grant P30 NS057105 to Washington University. We thank the Alafi Neuroimaging Laboratory Core of the Hope Center for Neurologic Disorders at Washington University for assistance with confocal microscopy. We thank our colleagues, Jinbin Xu in our laboratory and Zhengyuan Wang at the Genome Center of Washington University for their assistance with statistical analysis of the data.
Abbreviations
- EdU
5–ethynyl–2′–deoxyuridine
- BrdU
5–bromo–2′–deoxyuridine
- DG
dentate gyrus
- SVZ
subventricular zone
- SGZ
subgranular zone
Footnotes
Publisher's Disclaimer: This is a PDF file of an unedited manuscript that has been accepted for publication. As a service to our customers we are providing this early version of the manuscript. The manuscript will undergo copyediting, typesetting, and review of the resulting proof before it is published in its final citable form. Please note that during the production process errors may be discovered which could affect the content, and all legal disclaimers that apply to the journal pertain.
Section: Nervous system development, regeneration and aging
REFERENCES
- Breunig JJ, Macklis JD, Rakic P. Evloving methods for the labeling and mutation of postnatal neuronal precursor cells: a critical review. Adult neurogenesis. Cold Spring Harbor Laboratory Press; New York: 2008. pp. 49–80. [Google Scholar]
- Buck SB, Bradford J, Gee KR, Agnew BJ, Clarke ST, Salic A. Detection of S–phase cell cycle progression using 5–ethynyl–2′–deoxyuridine incorporation with click chemistry, an alternative to using 5–bromo–2′–deoxyuridine antibodies. Biotechniques. 2008;44:927–929. doi: 10.2144/000112812. [DOI] [PubMed] [Google Scholar]
- Burns KA, Kuan CY. Low doses of bromo– and iododeoxyuridine produce near–saturation labeling of adult proliferative populations in the dentate gyrus. Eur J Neurosci. 2005;21:803–807. doi: 10.1111/j.1460-9568.2005.03907.x. [DOI] [PubMed] [Google Scholar]
- Cameron HA, McKay RD. Adult neurogenesis produces a large pool of new granule cells in the dentate gyrus. J Comp Neurol. 2001;435:406–417. doi: 10.1002/cne.1040. [DOI] [PubMed] [Google Scholar]
- Cappella P, Gasparri F, Pulici M, Moll J. A novel method based on click chemistry, which overcomes limitations of cell cycle analysis by classical determination of BrdU incorporation, allowing multiplex antibody staining. Cytometry A. 2008;73:626–636. doi: 10.1002/cyto.a.20582. [DOI] [PubMed] [Google Scholar]
- Chehrehasa F, Meedeniya AC, Dwyer P, Abrahamsen G, Mackay–Sim A. EdU, a new thymidine analogue for labelling proliferating cells in the nervous system. J Neurosci Methods. 2009;177:122–130. doi: 10.1016/j.jneumeth.2008.10.006. [DOI] [PubMed] [Google Scholar]
- Dinjens WN, ten Kate J, Lenders MH, van der Linden EP, Bosman FT. Bromodeoxyuridine (BrdU) immunocytochemistry by exonuclease III (Exo III) digestion. Histochemistry. 1992;98:199–205. doi: 10.1007/BF00315878. [DOI] [PubMed] [Google Scholar]
- Drew MR, Hen R. Adult hippocampal neurogenesis as target for the treatment of depression. CNS Neurol Disord Drug Targets. 2007;6:205–218. doi: 10.2174/187152707780619353. [DOI] [PubMed] [Google Scholar]
- Encinas JM, Enikolopov G. Identifying and quantitating neural stem and progenitor cells in the adult brain. Methods Cell Biol. 2008;85:243–272. doi: 10.1016/S0091-679X(08)85011-X. [DOI] [PubMed] [Google Scholar]
- Hayes NL, Nowakowski RS. Exploiting the dynamics of S–phase tracers in developing brain: interkinetic nuclear migration for cells entering versus leaving the S–phase. Dev Neurosci. 2000;22:44–55. doi: 10.1159/000017426. [DOI] [PubMed] [Google Scholar]
- Kannangara TS, Webber A, Gil–Mohapel J, Christie BR. Stress differentially regulates the effects of voluntary exercise on cell proliferation in the dentate gyrus of mice. Hippocampus. 2008 doi: 10.1002/hipo.20514. [DOI] [PubMed] [Google Scholar]
- Kronenberg G, Bick–Sander A, Bunk E, Wolf C, Ehninger D, Kempermann G. Physical exercise prevents age–related decline in precursor cell activity in the mouse dentate gyrus. Neurobiol Aging. 2006;27:1505–1513. doi: 10.1016/j.neurobiolaging.2005.09.016. [DOI] [PubMed] [Google Scholar]
- Li S, Wang C, Wang W, Dong H, Hou P, Tang Y. Chronic mild stress impairs cognition in mice: from brain homeostasis to behavior. Life Sci. 2008;82:934–942. doi: 10.1016/j.lfs.2008.02.010. [DOI] [PubMed] [Google Scholar]
- Mandyam CD, Harburg GC, Eisch AJ. Determination of key aspects of precursor cell proliferation, cell cycle length and kinetics in the adult mouse subgranular zone. Neuroscience. 2007;146:108–122. doi: 10.1016/j.neuroscience.2006.12.064. [DOI] [PMC free article] [PubMed] [Google Scholar]
- Packard DS, Jr., Menzies RA, Skalko RG. Incorportaiton of thymidine and its analogue, bromodeoxyuridine, into embryos and maternal tissues of the mouse. Differentiation. 1973;1:397–404. doi: 10.1111/j.1432-0436.1973.tb00137.x. [DOI] [PubMed] [Google Scholar]
- Rakic P. Neurogenesis in adult primate neocortex: an evaluation of the evidence. Nat Rev Neurosci. 2002;3:65–71. doi: 10.1038/nrn700. [DOI] [PubMed] [Google Scholar]
- Salic A, Mitchison TJ. A chemical method for fast and sensitive detection of DNA synthesis in vivo. Proc Natl Acad Sci U S A. 2008;105:2415–2420. doi: 10.1073/pnas.0712168105. [DOI] [PMC free article] [PubMed] [Google Scholar]
- Spector R. Nucleoside transport in choroid plexus: mechanism and specificity. Arch Biochem Biophys. 1982;216:693–703. doi: 10.1016/0003-9861(82)90259-4. [DOI] [PubMed] [Google Scholar]
- Spector R, Huntoon S. Specificity and sodium dependence of the active nucleoside transport system in choroid plexus. J Neurochem. 1984;42:1048–1052. doi: 10.1111/j.1471-4159.1984.tb12709.x. [DOI] [PubMed] [Google Scholar]
- Steiner B, Kronenberg G, Jessberger S, Brandt MD, Reuter K, Kempermann G. Differential regulation of gliogenesis in the context of adult hippocampal neurogenesis in mice. Glia. 2004;46:41–52. doi: 10.1002/glia.10337. [DOI] [PubMed] [Google Scholar]
- Thomas SA, Segal MB. Saturation kinetics, specificity and NBMPR sensitivity of thymidine entry into the central nervous system. Brain Res. 1997;760:59–67. doi: 10.1016/s0006-8993(97)00276-x. [DOI] [PubMed] [Google Scholar]
- van Praag H, Kempermann G, Gage FH. Running increases cell proliferation and neurogenesis in the adult mouse dentate gyrus. Nat Neurosci. 1999;2:266–270. doi: 10.1038/6368. [DOI] [PubMed] [Google Scholar]
- van Praag H, Shubert T, Zhao C, Gage FH. Exercise enhances learning and hippocampal neurogenesis in aged mice. J Neurosci. 2005;25:8680–8685. doi: 10.1523/JNEUROSCI.1731-05.2005. [DOI] [PMC free article] [PubMed] [Google Scholar]
- Vega CJ, Peterson DA. Stem cell proliferative history in tissue revealed by temporal halogenated thymidine analog discrimination. Nat Methods. 2005;2:167–169. doi: 10.1038/nmeth741. [DOI] [PubMed] [Google Scholar]
- Wojtowicz JM, Kee N. BrdU assay for neurogenesis in rodents. Nat Protoc. 2006;1:1399–1405. doi: 10.1038/nprot.2006.224. [DOI] [PubMed] [Google Scholar]
- Zhao C, Deng W, Gage FH. Mechanisms and functional implications of adult neurogenesis. Cell. 2008;132:645–660. doi: 10.1016/j.cell.2008.01.033. [DOI] [PubMed] [Google Scholar]


