

Abstract
Diffusion tensor imaging (DTI) measures diffusion of molecular water, which can be used to calculate indices of white matter integrity. Early DTI studies of aging primarily focused on two global measures of integrity; the average rate (mean diffusivity, MD) and orientation coherence (fractional anisotropy, FA) of diffusion. More recent studies have added measures of water movement parallel (axial diffusivity, AD) and perpendicular (radial diffusivity, RD) to the primary diffusion direction, which are thought to reflect the neural bases of age differences in diffusion (i.e., axonal shrinkage and demyelination, respectively). In this study, patterns of age differences in white matter integrity were assessed by comparing younger and healthy older adults on multiple measures of integrity (FA, AD, and RD). Results revealed two commonly reported patterns (Radial Increase Only and Radial/Axial Increase), and one relatively novel pattern (Radial Increase/Axial Decrease) that varied by brain region and may reflect differential aging of microstructural (e.g., degree of myelination) and macrostructural (e.g., coherence of fiber orientation) properties of white matter. In addition, larger age differences in FA in frontal white matter were consistent with the anterior–posterior gradient of age differences in white matter integrity. Together, these findings complement other recent studies in providing information about patterns of diffusivity that are characteristic of healthy aging. Hum Brain Mapp, 2010. © 2009 Wiley‐Liss, Inc.
Keywords: aging, axial diffusivity, DTI, fractional anisotropy, radial diffusivity
INTRODUCTION
Brain aging research has been dominated by examinations of age‐related differences in the structure and function of gray matter (Cabeza et al., 2005), with the other half of the brain—white matter—having been largely ignored. The lack of attention to white matter aging in the past likely resulted from limitations in imaging technology, because the relatively recent advent of diffusion tensor imaging (DTI) has led to widespread interest in age‐related changes in white matter.
DTI is a magnetic resonance imaging (MRI) technique that measures the diffusion of molecular water (Basser et al., 1994; Pierpaoli and Basser, 1996). Water diffuses three to seven times more rapidly along the length of axons aligned in white matter tracts compared to movement perpendicular to the axons (Le Bihan, 2003; Pierpaoli et al., 1996), because the latter is restricted by axonal cell membranes, myelin sheaths, and neurofilaments (Beaulieu, 2002). Various properties of water diffusion can be calculated from DTI‐based eigenvalue measures (λ1, λ2, and λ3, which indicate the rate of diffusion along the three principal axes of the diffusion ellipsoid), providing information about the integrity of these white matter structures.
Mean diffusivity (MD) and fractional anisotropy (FA) are the two most commonly used measures of white matter integrity. MD is the average amount of water diffusion, calculated as the average diffusivity across all three eigenvalues, with higher values denoting increased rate of diffusion. On the other hand, FA refers to the coherence of the orientation of water diffusion, independent of rate. It is calculated as the fraction of total diffusion that can be attributed to anisotropic diffusion, which is derived from the normalized variances of the three eigenvalues (see Basser and Pierpaoli, 1996 for this equation), with higher values corresponding to a more consistent diffusion orientation. Taken together, a breakdown in white matter integrity would be seen as higher MD and/or lower FA.
Accordingly, it is not surprising that the most pervasive findings from DTI aging research are age‐related increases in MD and decreases in FA (Abe et al., 2002; Grieve et al., 2007; Head et al., 2004; Hsu et al., 2008; Hugenschmidt et al., 2008; Pfefferbaum et al., 2000, 2005; Salat et al., 2005; Sullivan and Pfefferbaum, 2006; Yoon et al., 2008). These age differences in integrity are seen throughout the brain, with most studies reporting the magnitude of the difference to be larger in anterior white matter compared to posterior regions (Abe et al., 2002; Ardekani et al., 2007; Bucur et al., 2008; Grieve et al., 2007; Gunning‐Dixon et al., 2009; Head et al., 2004; Hedden and Gabrieli, 2005; Madden et al., 2009; Pfefferbaum et al., 2005; Pfefferbaum and Sullivan, 2003; Salat et al., 2004, 2005; Sullivan et al., 2008; Zahr et al., 2009). This effect, referred to as the anterior–posterior gradient, has also been seen in the time course of age‐related declines in white matter integrity, with age differences in FA occurring earlier in frontal white matter (Yoon et al., 2008).
What remains relatively unknown is what these age differences in white matter integrity mean in terms of underlying neural substrates. With the aim of shedding light on this issue, DTI aging studies have begun to examine the more frequently used integrity measures (FA, MD) in relation to axial (AD) and radial (RD) diffusivity, which correspond to diffusion in the primary (λ1) and perpendicular ((λ2 + λ3)/2) directions, respectively. Although DTI cannot resolve neural changes within a voxel, this shift was motivated by animal research indicating that these measures may be selectively sensitive to specific neural changes, with AD reflecting axonal differences (e.g., axonal damage or loss) (Budde et al., 2007; Song et al., 2003) and RD reflecting differences in the degree of myelination (Budde et al., 2007; Nair et al., 2005; Song et al., 2002, 2003, 2005).
Previous DTI aging studies that included AD and RD measures have revealed two prominent patterns of age differences in diffusivity. In the first pattern (Radial Increase Only), age‐related decreases in FA are primarily associated with a significant increase in RD, but not AD (Bhagat and Beaulieu, 2004; Davis et al., 2009; Madden et al., 2009; Zhang et al., 2008). In the second pattern (Radial/Axial Increase), age‐related decreases in FA are associated with significant increases in both RD and AD (Sullivan et al., 2006, 2008; Zahr et al., 2009). Both patterns are characterized by an increase in RD with aging. Given the animal literature cited above showing that increased RD is associated with decreased myelin, and evidence that healthy aging is accompanied by myelin damage and loss (Peters, 2002), it is not surprising that these patterns are often interpreted to reflect age‐related demyelination. However, because the focus has been on age differences in RD, potentially important age differences in AD, and the corresponding neural underpinnings, have been largely ignored.
Shifting attention to age differences in AD may provide insight into a number of neural substrates underlying age differences in white matter integrity. Diffusion anisotropy is known to be influenced by both microstructural, cellular variables (e.g., axonal packing density, degree of myelination, axonal diameter, and inflammation) and macrostructural, voxel‐level variables (e.g., axonal organization such as aligned, crossing, and “kissing” fibers) (Giorgio et al., 2008; Mori and Zhang, 2006; Pierpaoli et al., 1996). Thus, if AD does reflect axonal differences as suggested by the animal literature cited above, then inferences can be made about the contribution of axon‐based microstructural variables to white matter aging. In addition, we may identify macrostructural level changes with aging by examining the regional variation of age differences in AD, because the organization of underlying white matter tracts would need to be considered.
Therefore, this study assessed region‐specific patterns of age differences in multiple measures of white matter integrity. To furthering our understanding of the neural substrates underlying the widely reported age differences in FA, younger and healthy older adults were compared on diffusivity measures (AD and RD; MD was not included because it is not independent of these measures) in white matter regions that showed significant age differences in FA, with particularly attention to age differences in AD. Regional variation of these patterns may reflect differential aging of the underlying white matter, comparable to studies showing different patterns of aging across gray matter regions (e.g., Head et al., 2005; Raz et al., 2005). Furthermore, because white matter integrity is compromised (i.e., decreased FA) in a variety of populations, including individuals diagnosed with schizophrenia, multiple sclerosis, and Alzheimer's disease (Sullivan and Pfefferbaum, 2003; Sundgren et al., 2004), our results may help identify region‐specific patterns of diffusivity that are unique to healthy aging.
MATERIALS AND METHODS
Participants
Fourteen Georgetown University undergraduate students (18–20 years old) and 14 older adults (63–72 years old) who responded to advertisements in the Washington Post Health Section were recruited. Demographic and neuropsychological characterizations for each group are presented in Table I. All participants gave informed consent and received either payment or course credit for their participation. The Georgetown University Institutional Review Board approved the experimental procedures.
Table I.
Demographic and neuropsychological test results
| Younger adults | Older adults | t | |
|---|---|---|---|
| Demographics | |||
| Age | 18.9 ± 0.7 | 67.6 ± 3.1 | 57.5** |
| Education | 12.2 ± 0.4 | 17.0 ± 2.3 | 7.7** |
| Male/female | 5/9 | 4/10 | |
| Neuropsychological tests | |||
| MMSEa | 29.9 ± 0.3 | 29.4 ± 0.7 | −2.7* |
| WAIS‐III vocabularyb | 62.6 ± 6.0 | 68.0 ± 5.3 | 2.6* |
| WAIS‐III digit symbol codingc | 91.9 ± 13.9 | 61.6 ± 13.3 | −5.9** |
| WAIS‐III digit symbol pairingd | 16.0 ± 3.3 | 11.1 ± 4.9 | −3.1* |
| WAIS‐III digit symbol recalle | 8.1 ± 1.2 | 7.0 ± 1.4 | −2.4* |
| WAIS‐III digit span forwardf | 11.8 ± 2.5 | 11.6 ± 2.2 | ns |
| WAIS‐III digit span backwardf | 7.0 ± 2.5 | 8.9 ± 2.9 | ns |
| COWAT‐FAS sumg | 46.1 ± 11.4 | 47.2 ± 12.9 | ns |
| USC‐REMT free recall correcte | 32.5 ± 5.1 | 25.4 ± 5.2 | −3.4* |
| USC‐REMT free recall repetitionse | 2.4 ± 2.5 | 2.9 ± 3.5 | ns |
| USC‐REMT free recall intrusionse | 0.5 ± 0.9 | 1.0 ± 0.9 | ns |
| WJ‐III word attack SSh | 92.6 ± 8.3 | 101.1 ± 2.7 | 3.6* |
| WJ‐III word identification SSh | 108.6 ± 10.4 | 112.7 ± 5.0 | ns |
Notes: All scores are given as mean ± SD, with neuropsychological test scores based on raw data except where standard scores (SS = age‐adjusted standard score with a mean of 100 and standard deviation of 15) are noted. Independent sample t tests show group effects (*P < 0.05; **P < 0.001; ns, not significant). Neuropsychological tests screened for dementiaa; and measured vocabularyb, processing speedc, cued recalld, free recalle, working memoryf, verbal fluencyg, and reading abilityh. Three participants did not complete the COWAT‐FAS and USC‐REMT tests. MMSE, Mini Mental State Examination; WAIS‐III, Wechsler Adult Intelligence Scale, 3rd edition; COWAT‐FAS, Controlled Oral Word Association Test‐FAS; USC‐REMT, University of Southern California‐Repeatable Episodic Memory Test; WJ‐III, Woodcock‐Johnson, 3rd edition.
Prior to participation, individuals were screened for conditions that would prevent them from being able to enter the MRI scanner. These conditions included being pregnant, having ferrous metal implants, having difficulty lying in the supine position for 30 min, and being claustrophobic. In addition, individuals were excluded prior to scanning if they reported having a health condition or neurological disease or disorder that is known to influence cognitive functioning and/or contribute to white matter pathology (e.g., stroke, dementia, diabetes, and uncontrolled depression or hypertension).
General Procedure
Participants completed 3 days of testing. On the first day, they completed screening procedures (informed consent, biographical and health screen questionnaires, and MRI safety form) and the MRI scanning protocol. On the second and third days of testing, participants completed the comprehensive neuropsychological test battery (see Table I) and a computer‐based learning task (data not presented here).
MRI scanning protocol
Participants were scanned using the 3.0 Tesla MRI system (Siemens Magnetom Trio, Erlangen, Germany) at Georgetown University's Center for Functional and Molecular Imaging. An imaging technician positioned participants in the scanner, laying them in the supine position with a circularly polarized head coil. A mirror mounted on the head coil allowed them to watch cable television programming during scanning. Fitted padding was used to minimize head movements.
A high resolution T1‐weighted structural scan (MPRAGE) was acquired first with the following parameters: scan time = 7:23 min, TR = 2,300 ms, TE = 2.94 ms, TI = 900 ms, 9° flip angle, 1 slab, 160 sagittal slices with a 1.0‐mm slice thickness, and FOV = 256 × 256 mm with a 256 × 256 matrix resulting in an effective resolution of 1.0 mm3 isotropic voxels. A Neurologist reviewed these images, and no participant exhibited a clinically significant structural abnormality that was atypical for their age (e.g., lesions and excessive atrophy).
Two 35‐direction diffusion weighted echo planar imaging sequences were then acquired using gradient values of b = 0 and b = 1,000 s/mm2 applied in 35 orthogonal directions. Each acquisition had the following parameters: scan time = 4:39 min, TR = 7,700 ms, TE = 100 ms, 55 axial interleaved slices with a 2.5 mm slices thickness with no gap, and FOV = 240 × 240 mm with a 64 × 64 matrix resulting in an effective resolution of 2.5 mm3 isotropic voxels. The entire scanning session took ∼30 min.
Data Analysis
Diffusion data processing
Diffusion‐weighted data were separately processed for each participant using the University of Oxford's Center for Functional Magnetic Resonance Imaging of the Brain (FMRIB) Software Library (FSL) release 4.0 (http://www.fmrib.ox.ac.uk/fsl). First, the two diffusion acquisitions were concatenated in time to increase the signal‐to‐noise ratio. The first volume within this merged data file that did not have gradient applied (i.e., the first b = 0 image) was used to generate a binary brain mask with the Brain Extraction Tool. These data were then corrected for head movement and eddy current distortions using Eddycorrect, which aligns all the volumes. Finally, DTIfit was used to independently fit diffusion tensors to each voxel, with the brain mask limiting the fitting of tensors to brain space. The output of DTIfit yielded voxelwise maps of FA, AD (λ1), and RD (average of λ2 and λ3) for each participant.
Between‐group t‐tests
A between‐group skeleton‐wise t‐test analysis was performed for the FA measure using Tract‐Based Spatial Statistics (Smith et al., 2006). In this analysis, individual FA maps were nonlinearly aligned to the FMRIB58_FA template, affine transformed into MNI152 1 mm3 standard space, and then averaged across all participants to form a mean FA image. The mean FA image was used to generate a white matter skeleton that identifies the center of white matter tracts shared by all participants. This mean FA skeleton was thresholded at 2,000 (corresponding to FA > 0.2) to exclude voxels containing gray matter or cerebrospinal fluid (CBF). Prealigned FA images from each participant were registered to the mean FA skeleton by searching for maximum FA values perpendicular to the skeleton. This second registration corrected for any misalignment from the initial nonlinear registration and affine transformation. The resulting skeletonized FA data were then subjected to a skeleton‐wise (i.e., voxel‐wise comparison limited to voxels within the mean skeleton) comparison of FA between younger and older adults. This between‐group t‐test was conducted using the Randomise tool, which tests the t value at each voxel against a null distribution generated from 5,000 random permutations of group membership. The output contained statistical maps corrected for multiple comparisons at the cluster level (cluster‐forming threshold t > 3.0, P < 0.05).
Significant clusters from the FA analysis were separately masked and labeled with reference to the JHU ICBM‐DTI‐81 White Matter Labels, part of the FSL atlas tools. To obtain mean FA values for each participant from the significant clusters, each mask was projected back into the native space of each individual's FA map using the FSL Deproject tool. Back projected masks were then binarized and multiplied by the individual's FA map, leaving just the FA values for voxels within that cluster, which were then averaged. The same back projection and averaging was conducted for each of the non‐FA maps (λ1, λ2, and λ3) to obtain mean values for each participant for the significant clusters from the FA analysis. Values for the λ2 and λ3 maps were averaged to get a single measure of mean RD for each individual.
Finally, between‐group t‐test analyses were conducted separately for AD and RD at each of the 28 significant clusters from the FA analysis. Results for each diffusivity measure were corrected for multiple comparisons using Bonferroni corrections for 28 comparisons.
RESULTS
Neuropsychological Data
Neuropsychological test results, seen in Table I, revealed the typical pattern of age effects, with all participants performing within the age‐expected range. That is, older adults performed significantly worse than younger adults on measures of processing speed, cued recall, and free recall, but not vocabulary or reading ability. All participants had Mini‐Mental State Examination (Folstein et al., 1975) scores that were ≥28.
Age Group Differences in FA
Results of the skeleton‐wise between‐group t‐test for FA are presented in Figure 1. Significantly lower FA was seen in older adults compared to younger adults in 28 white matter clusters (see descriptions in Table II), which included two midline, 11 bilateral, and four unilateral regions. Three of the unilateral clusters were in the left hemisphere, suggesting a slight hemispheric asymmetry, especially in frontal regions (left anterior/inferior corona radiata, left frontal cluster). Consistent with the notion that the integrity of white matter connections degrade with age, there were no regions with significantly higher FA in older versus younger adults.
Figure 1.
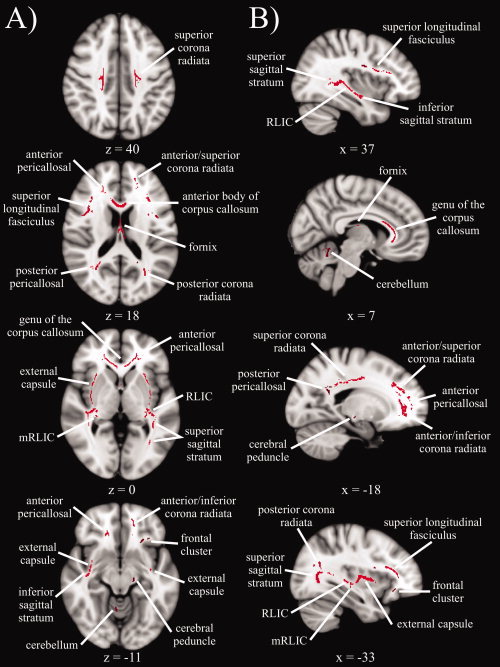
Statistical map showing white matter clusters (red) where FA was significantly greater in younger versus older adults, across four axial slices (panel A) and four sagittal slices (panel B). Axial slices are presented in radiological orientation (right = left). RLIC = retrolenticular part of the internal capsule.
Table II.
Descriptions of white matter clusters
| White matter cluster | Description |
|---|---|
| Genu of the corpus callosum | Anterior portion (y ≥ 5), includes anterior body of the corpus callosum |
| Fornix | Between the thalamus and lateral ventricles |
| External capsule | Between putamen and insular cortex |
| Retrolenticular part of the internal capsule (RLIC) | Junction of the posterior limb of the internal capsule, external capsule and superior sagittal stratum |
| Medial RLIC | Medial to RLIC, behind the thalamus |
| Anterior/inferior corona radiata | Anterior and inferior to the genu of the corpus callosum and anterior pericallosal WM, left hemisphere |
| Anterior/superior corona radiata | Anterior and superior to the genu of the corpus callosum and anterior pericallosal WM |
| Superior corona radiata | Superior WM adjacent to BA 2, 3, 4, and 6 |
| Posterior corona radiata | Parietal WM superior to posterior pericallosal WM (y < −52, z > 15) |
| Superior longitudinal fasciculus | Anterior to WM adjacent to BA 44/45 and the precentral gyrus |
| Superior sagittal stratum | Between posterior corona radiata and RLIC |
| Inferior sagittal stratum | Temporal lobe between RLIC and inferior external capsule |
| Anterior pericallosal | Lateral to the genu of the corpus callosum |
| Posterior pericallosal | Lateral to the splenium of the corpus callosum |
| Cerebellum | Anterior lobe, right hemisphere |
| Cerebral peduncle | Posterior portion of the crus ceribri, left hemisphere |
| Frontal cluster | Frontal lobe adjacent to insular cortex, left hemisphere |
Note: Descriptions indicate when the age group difference in FA was only significant in one hemisphere for a given white matter cluster. Coordinates (y and z) are given in mm according to Montreal Neurological Institute (MNI) space. WM, white matter; BA, Brodmann area.
Age Group Differences in Diffusivity Measures
Between group t‐test results for the non‐FA, diffusivity measures are summarized in Table III, and the corresponding statistics are presented in Table IV. These data revealed that age‐related decreases in FA are characterized by three distinct patterns of age differences in diffusivity measures. In the first pattern, Radial Increase Only, clusters with significant age‐related decreases in FA also had significant age‐related increases in RD, but no age group effects in AD. For the second pattern, Radial/Axial Increase, clusters in which FA decreased with age also had significantly higher RD and AD values for older adults relative to younger adults. In the third pattern, Radial Increase/Axial Decrease, clusters with significant age‐related decreases in FA also had significantly higher RD and lower AD in older versus younger adults.
Table III.
Age group differences in white matter integrity
| FA | AD | RD | |
|---|---|---|---|
| Radial increase only | |||
| L anterior/inferior corona radiata | Y > O | O > Y | |
| L frontal cluster | Y > O | O > Y | |
| Posterior pericallosal | Y > O | O > Y | |
| R cerebellum | Y > O | O > Y | |
| Inferior sagittal stratum | Y > O | O > Yrt, † | |
| Posterior corona radiata | Y > O | O > Ylt, † | |
| Medial RLIC | Y > O | O > Y | |
| Superior longitudinal fasciculus | Y > O | O > Y | |
| Superior sagittal stratum | Y > O | O > Y | |
| Radial/axial increase | |||
| Genu of corpus callosum | Y > O | O > Y | O > Y |
| External capsule | Y > O | O > Y | O > Y |
| Fornix | Y > O | O > Y | O > Y |
| Radial increase/axial decrease | |||
| Anterior pericallosal | Y > O | Y > O | O > Yrt |
| Anterior/superior corona radiata | Y > O | Y > O | O > Y |
| Superior corona radiata | Y > O | Y > Olt | O > Y |
| RLIC | Y > O | Y > Ort | O > Y |
| L cerebral peduncle | Y > O | Y > O | O > Y |
Note. Significant white matter clusters from the FA comparison are organized according to the pattern of age group differences in diffusivity measures. Results indicate where significant effects for each diffusivity measure (P < 0.0018, Bonferroni‐corrected for 28 comparisons per diffusivity measure) were due to higher values in younger adults (Y > O) or older adults (O > Y). In some cases, effects were only significant for the left (lt) or right hemisphere (rt), or marginally significant (P < 0.0020) for the left (lt, †) or right hemisphere (rt, †). L, unilateral cluster in the left hemisphere; R, unilateral cluster in the right hemisphere.
Table IV.
Statistics for age group differences in diffusivity measures
| White matter cluster | AD (×10−3 mm2/s) | RD (×10−4 mm2/s) | ||||
|---|---|---|---|---|---|---|
| t | Younger | Older | t | Younger | Older | |
| Radial increase only | ||||||
| L anterior/inferior corona radiata | −2.9 | 1.309 ± 0.09 | 1.219 ± 0.08 | 3.7* | 5.208 ± 0.51 | 6.015 ± 0.64 |
| L frontal cluster | −1.2 | 1.070 ± 0.06 | 1.037 ± 0.08 | 4.0* | 5.750 ± 0.40 | 6.510 ± 0.59 |
| L posterior pericallosal | 0.7 | 1.321 ± 0.10 | 1.350 ± 0.12 | 4.0* | 3.880 ± 0.49 | 4.786 ± 0.70 |
| R posterior pericallosal | −0.4 | 1.543 ± 0.15 | 1.521 ± 0.17 | 2.9* | 2.909 ± 1.00 | 3.980 ± 0.93 |
| R cerebellum | −0.6 | 1.016 ± 0.06 | 1.004 ± 0.06 | 4.5* | 5.646 ± 0.37 | 6.495 ± 0.37 |
| L inferior sagittal stratum | −1.6 | 1.247 ± 0.10 | 1.045 ± 0.46 | −0.3 | 5.557 ± 0.87 | 5.371 ± 2.53 |
| R inferior sagittal stratum | −3.1 | 1.298 ± 0.07 | 1.205 ± 0.09 | 3.4† | 5.479 ± 0.45 | 6.244 ± 0.70 |
| L posterior corona radiata | −3.2 | 1.405 ± 0.10 | 1.300 ± 0.07 | 3.5† | 4.421 ± 0.68 | 5.349 ± 0.74 |
| R posterior corona radiata | −1.7 | 1.377 ± 0.06 | 1.283 ± 0.10 | 2.8 | 4.455 ± 0.65 | 5.607 ± 1.37 |
| L medial RLIC | −2.1 | 1.307 ± 0.07 | 1.255 ± 0.06 | 5.4* | 4.755 ± 0.44 | 5.638 ± 0.43 |
| R medial RLIC | −1.8 | 1.298 ± 0.08 | 1.247 ± 0.07 | 4.1* | 5.005 ± 0.43 | 5.844 ± 0.62 |
| L superior longitudinal fasciculus | 0.6 | 1.073 ± 0.04 | 1.085 ± 0.05 | 6.9* | 5.245 ± 0.32 | 6.289 ± 0.47 |
| R superior longitudinal fasciculus | 1.5 | 1.072 ± 0.03 | 1.097 ± 0.06 | 6.9* | 5.056 ± 0.27 | 6.159 ± 0.54 |
| L superior sagittal stratum | −0.4 | 1.325 ± 0.07 | 1.313 ± 0.08 | 4.9* | 4.016 ± 0.43 | 5.365 ± 0.94 |
| R superior sagittal stratum | −0.7 | 1.332 ± 0.05 | 1.316 ± 0.07 | 4.8* | 4.252 ± 0.50 | 5.622 ± 0.94 |
| Radial/axial increase | ||||||
| Genu of corpus callosum | 3.5* | 1.610 ± 0.06 | 1.754 ± 0.14 | 6.8* | 3.018 ± 0.50 | 5.358 ± 1.19 |
| L external capsule | 4.4* | 1.145 ± 0.04 | 1.229 ± 0.06 | 9.1* | 6.225 ± 0.36 | 7.646 ± 0.46 |
| R external capsule | 3.5* | 1.145 ± 0.04 | 1.212 ± 0.06 | 9.8* | 6.113 ± 0.26 | 7.515 ± 0.47 |
| Fornix | 6.3* | 1.914 ± 0.29 | 2.882 ± 0.49 | 6.3* | 11.183 ± 3.21 | 21.128 ± 4.91 |
| Radial increase/axial decrease | ||||||
| L anterior pericallosal | −4.3* | 1.284 ± 0.05 | 1.184 ± 0.07 | 3.3 | 5.059 ± 0.48 | 5.760 ± 0.63 |
| R anterior pericallosal | −4.0* | 1.248 ± 0.05 | 1.167 ± 0.05 | 3.8* | 4.818 ± 0.42 | 5.646 ± 0.70 |
| L anterior/superior corona radiata | −3.7* | 1.185 ± 0.05 | 1.110 ± 0.06 | 4.1* | 4.840 ± 0.36 | 5.543 ± 0.53 |
| R anterior/superior corona radiata | −4.1* | 1.147 ± 0.06 | 1.063 ± 0.05 | 3.8* | 4.751 ± 0.51 | 5.568 ± 0.63 |
| L superior corona radiata | −5.0* | 1.224 ± 0.05 | 1.134 ± 0.05 | 3.8* | 4.541 ± 0.43 | 5.229 ± 0.52 |
| R superior corona radiata | −3.1 | 1.188 ± 0.06 | 1.116 ± 0.06 | 4.5* | 4.570 ± 0.42 | 5.334 ± 0.47 |
| L RLIC | 1.8 | 1.417 ± 0.04 | 1.378 ± 0.07 | 4.8* | 5.009 ± 0.41 | 5.680 ± 0.33 |
| R RLIC | −3.6* | 1.427 ± 0.04 | 1.372 ± 0.04 | 5.0* | 5.050 ± 0.33 | 5.854 ± 0.50 |
| L cerebral peduncle | −3.6* | 1.602 ± 0.06 | 1.501 ± 0.09 | 5.4* | 4.228 ± 0.54 | 5.425 ± 0.62 |
Note: The t statistic and mean ± standard deviation (M ± SD) scores for younger and older adults are presented for each diffusivity measure at significant white matter clusters from the FA comparison. Bolded text with an asterisk (*) denotes significant effects at P < 0.0018 (Bonferroni‐corrected for 28 comparisons per diffusivity measure), bolded text with a cross (†) denotes marginally significant effects at P < 0.0020, L = left hemisphere, R = right hemisphere.
Age Group Differences in RD across Diffusivity Patterns
Significant age‐related increases in RD were seen in all clusters that had significant age differences in FA. To determine whether the magnitude of the age difference in RD differed across the three diffusivity patterns, an Age Group (younger, older) × Pattern (Radial Increase Only, Radial/Axial Increase, Radial Increase/Axial Decrease) ANOVA was conducted for the RD measure. As expected, results revealed a significant main effect of Age Group, F(1,26) = 65.7, P < 0.001, indicating that RD was higher in older (8.52 ± 2.48 × 10⁻⁴ mm2/s) compared to younger (5.39 ± 1.07 × 10⁻⁴ mm2/s) adults. There was also a significant main effect of Pattern, F(2,52) = 224.1, P < 0.001, with higher RD in the Radial/Axial Increase pattern (8.52 ± 2.30 × 10⁻⁴ mm2/s) compared to the Radial Increase Only (3.23 ± 0.65 × 10⁻⁴ mm2/s) and Radial Increase/Axial Decrease (5.16 ± 0.54 × 10⁻⁴ mm2/s) patterns. Importantly, the Age Group × Pattern interaction, F(2,52) = 43.3, P < 0.001, revealed that the age‐related difference in RD (older minus younger adults) was significantly larger for the Radial/Axial Increase pattern (3.78 × 10⁻⁴ mm2/s) compared to the Radial Increase Only (0.90 × 10⁻⁴ mm2/s) and Radial Increase/Axial Decrease (0.80 × 10⁻⁴ mm2/s) patterns. A follow‐up two Age Group × two Pattern ANOVA confirmed that the magnitude of the age difference in RD was comparable in the Radial Increase Only and Radial Increase/Axial Decrease patterns (P > 0.20).
Age Group Differences in AD across Diffusivity Patterns
As can be seen in Table III, the three diffusivity patterns differ with respect to age differences in AD. That is, clusters either had no significant age differences in AD (Radial Increase Only), significantly higher AD in older versus younger adults (Radial/Axial Increase), or significantly lower AD in older versus younger adults (Radial Increase/Axial Decrease). To determine whether the magnitude of the age difference in AD was significantly different across the three diffusivity patterns, an Age Group × Pattern ANOVA was conducted for the AD measure. Results revealed significant main effects of Age Group, F(1,26) = 14.3, P < 0.001 and Pattern, F(2,52) = 211.1, P < 0.001, such that AD was higher in older (1.40 ± 0.28 × 10⁻³ mm2/s) versus younger (1.34 ± 0.10 × 10⁻³ mm2/s) adults, and higher in the Radial/Axial Increase pattern (1.61 ± 0.20 × 10⁻³ mm2/s) compared to the Radial Increase Only (1.24 ± 0.05 × 10⁻³ mm2/s) and Radial Increase/Axial Decrease (1.26 ± 0.05 × 10⁻³ mm2/s) patterns. There was also a significant Age Group × Pattern interaction, F(2,52) = 58.3, P < 0.001, which indicated that the age‐related difference in AD (older minus younger adults) was significantly larger for the Radial/Axial Increase pattern (3.15 × 10⁻³ mm2/s) compared to the Radial Increase Only (−0.05 × 10⁻³ mm2/s) and Radial Increase/Axial Decrease (−0.08 × 10⁻³ mm2/s) patterns. Importantly, a follow‐up two Age Group × two Pattern ANOVA revealed a significant interaction, F(1,26) = 6.8, P < 0.02, indicating that the magnitude of the age difference in AD was significantly different for the Radial Increase Only and Radial Increase/Axial Decrease patterns.
Anterior–Posterior Gradient
There was evidence of an anterior–posterior gradient in the magnitude of the age‐related difference in FA (see Fig. 2). A correlation between the percent age group difference in FA (calculated as FA in older adults minus FA in younger adults, divided by the average FA value) and the location of each cluster (measured as the average y coordinate) revealed a significant positive relationship, r = 0.40, P < 0.04, such that age‐related decreases in FA were larger in more anterior clusters. When analyzed separately for each hemisphere, the relationship remained positive (left hemisphere, r = 0.43; right hemisphere, r = 0.39), but no longer attained significance (P's > 0.13). The strength of the correlation was magnified when only superior clusters with z coordinates above or traversing zero were assessed, r = 0.60, P < 0.01, whereas it did not approach significance for inferior clusters, P > 0.85. This latter result is comparable to previous research in which significant anterior–posterior gradients of age differences in FA are reported for superior white matter (e.g., Davis et al., 2009; Pfefferbaum et al., 2005).
Figure 2.
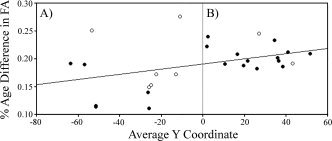
The percent of age group difference in FA, calculated for each white matter cluster by dividing the group difference in FA (younger minus older adults) by the average FA for that cluster, is plotted as a function of each cluster's average y coordinate (in mm according to MNI space). As the regression line indicates, age‐related decreases in FA were significantly larger in anterior (panel B) versus posterior (panel A) clusters. This relationship was significant for the frequently reported superior clusters (closed circle) with z coordinates above or traversing zero, but did not attain significance for inferior clusters (open circles). Average y coordinates (from left to right) correspond to the following cluster: −63.5, left posterior corona radiata; −57.0, right posterior corona radiata; −53.5, right cerebellum; −51.5, left posterior pericallosal; −51.5, right posterior pericallosal; −26.5, right retrolenticular part of the internal capsule (RLIC); −26.0, left medial RLIC (mRLIC); −26.0, left RLIC; −25.0, right mRLIC; −22.5, left cerebral peduncle; −13.0, right inferior sagittal stratum; −11.0, left inferior sagittal stratum; 2.0, left external capsule; 2.5, right external capsule; 10.5, right superior longitudinal fasciculus; 16.5, left superior longitudinal fasciculus; 19.5, genu of the corpus callosum; 21.5, right superior corona radiata; 26.0, left superior corona radiata; 27.0, left frontal cluster; 34.5, right anterior/superior corona radiata; 36, right anterior pericallosal; 36.5, left anterior pericallosal; 38.5, left anterior/superior corona radiata; 41.0, right superior sagittal stratum; 43, left anterior/inferior corona radiata; 51.5, left superior sagittal stratum.
Before concluding that anterior white matter is more susceptible to aging than posterior regions, it is important to recognize that the age‐related decline is regionally complex. For example, variability of the magnitude of age differences was greater in posterior clusters, which included regions with both the largest (left inferior sagittal stratum, right cerebellum) and smallest (bilateral retrolenticular part of the internal capsule and posterior pericallosal white matter) age group differences in FA. Note that the fornix was removed from this analysis and from Figure 2, because the percentage of age‐related FA decrease was more than four standard deviations above the average difference of the remaining white matter clusters.
DISCUSSION
Summary of Findings
This study examined age group differences in white matter microstructure by comparing younger and healthy older adults on multiple measures of white matter integrity. The main finding was that age‐related decreases in FA were associated with three region‐specific patterns of age differences in diffusivity measures (AD and RD).
Radial increase only
In most clusters, decreased FA in older adults was associated with an age‐related increase in RD but no age difference in AD. This has been the predominant pattern reported in several previous DTI aging studies (Bhagat and Beaulieu, 2004; Davis et al., 2009; Fjell et al., 2008; Madden et al., 2009; Zhang et al., 2008). The present findings replicated earlier studies that also showed this pattern in frontal (Zhang et al., 2008), posterior pericallosal (Vernooij et al., 2008; Zhang et al., 2008), superior longitudinal fasciculus (Madden et al., 2009; Sullivan et al., 2008), and sagittal stratum (Burzynska et al., submitted) white matter.
Radial/Axial increase
In other clusters, decreased FA in older adults was associated with an age‐related increase in both RD and AD, which has also been the primary pattern reported in several other DTI aging studies (Sullivan et al., 2006, 2008; Zahr et al., 2009). The current findings replicated some earlier reports of this pattern in the genu of the corpus callosum (Burzynska et al., submitted; Sullivan et al., 2006, 2008; Zahr et al., 2009), external capsule (Burzynska et al., submitted; Sullivan et al., 2008), and fornix (Burzynska et al., submitted; Sullivan et al., 2008; Vernooij et al., 2008; Zahr et al., 2009). A few studies found that the genu of the corpus callosum (Davis et al., 2009; Madden et al., 2009; Vernooij et al., 2008) or external capsule (Bhagat and Beaulieu, 2004) fit into the Radial Increase Only pattern, which may be linked to the possibility that the Radial Increase Only and Radial/Axial Increase patterns reflect different degrees of severity of the same underlying neural changes that affect RD.
Radial increase/Axial decrease
Remaining clusters with decreased FA in older adults had an age‐related increase in RD and decrease in AD. This pattern was only recently identified in another DTI aging study (Burzynska et al., submitted), with two earlier studies having each observed this pattern in a single white matter region. The present finding of the Radial Increase/Axial Decrease pattern in frontal white matter (anterior pericallosal, anterior/superior corona radiata) overlaps with earlier observations in the superior frontal gyrus (Bhagat and Beaulieu, 2004), superior corona radiata (Burzynska et al., submitted), and frontal forceps (Burzynska et al., submitted; Sullivan et al., 2008). This pattern was also previously seen in the retrolenticular part of the internal capsule (Burzynska et al., submitted). In contrast to the other patterns, possible neural substrates underlying the Radial Increase/Axial Decrease pattern in healthy aging have only recently been proposed (e.g., lesion‐induced axonal loss and gliosis; Burzynska et al., submitted).
Age‐Related Increases in RD
In this study, age‐related increases in RD were characteristic of all clusters in each of the three patterns, suggesting that the neural changes underlying RD increases with healthy aging affect white matter microstructure throughout the brain. However, the magnitude of the age difference in RD was significantly larger in the Radial/Axial Increase pattern, indicating that the severity of these neural changes may be exacerbated in these clusters.
Animal literature has shown RD increases in mice that have been genetically modified to be myelin deficient (Nair et al., 2005; Song et al., 2002) or treated with cuprizone to induce myelin loss (Song et al., 2005). Combined with evidence that myelin damage and loss is prevalent in healthy aging (Peters, 2002), these findings suggest that age‐related demyelination contributes to RD increases in older compared to younger adults. However, myelin is not the only factor contributing to restricted diffusion measured by FA because anisotropic diffusion can occur in the absence of myelin (Beaulieu, 2002; Berman et al., 2005; Le Bihan, 2003; Pierpaoli et al., 1996). Thus, it may be an oversimplification to conclude that age‐related increases in RD are due solely to demyelination in healthy aging.
Alternatively, some researchers have proposed that the primary determinant of anisotropy is the packing density of axons within a voxel (Beaulieu, 2002; Shenkin et al., 2003; cf., Pierpaoli et al., 1996). Axonal packing density encompasses a variety of microstructural level variables (e.g., degree of myelination, axonal diameter, and inflammation) that can influence the amount of extracellular water between axons, and thus the amount of diffusion in the non‐primary direction. One benefit of this explanation is that it applies to multiple white matter changes known to occur with aging (Gunning‐Dixon et al., 2009; Peters, 2002), but that cannot be separately assessed with the current resolution of most DTI sequences (Sullivan et al., 2008).
Region‐specific differences in the degree of age‐related change in axonal packing density may explain why the age difference in RD was significantly larger in the Radial/Axial Increase pattern. For example, age differences in microstructural level variables contributing to decreased axonal packing density may be mild enough in Radial Increase Only and Radial Increase/Axial Decrease clusters to only increase RD. However, more severe decreases in axonal packing density from, for example, a greater loss of myelin or axons in aging, would lead to a global increase in extracellular water, resulting in larger RD increases and subsequent AD increases in Radial/Axial Increase clusters. This hypothesis is supported by evidence that the genu of the corpus callosum, a Radial/Axial Increase cluster, contains many small diameter unmyelinated and thinly myelinated axons (Aboitiz et al., 1992), the latter of which are highly susceptible to degeneration and demyelination in aging (Marner et al., 2003; Tang et al., 1997).
Age‐Related Decreases in AD
Previous DTI aging articles that have examined AD and RD tend to focus on age‐related increases in the latter, which, as mentioned earlier, are often interpreted to reflect age‐related demyelination (e.g., Davis et al., 2009). As a result, the DTI aging literature has largely ignored age differences in AD and its potential underlying neural substrates.
In this study, the three observed patterns differed with respect to age effects for the AD measure, with either no significant age differences in AD (Radial Increase Only), significantly higher AD in older adults (Radial/Axial Increase), or significantly higher AD in younger adults (Radial Increase/Axial Decrease). As can be seen from the statistics presented in Table IV, 80% of the Radial Increase Only clusters have non‐significant age‐related decreases in AD. Importantly, however, follow‐up comparisons revealed that the magnitude of the age‐related decrease in AD was significantly larger in the Radial Increase/Axial Decrease pattern compared to the Radial Increase Only pattern, indicating that these patterns are quantitatively different.
One interpretation of age‐related decreases in AD can be inferred from previous research on the effect of ischemic stroke on DTI‐based measures of white matter integrity in humans (Pierpaoli et al., 2001; Thomalla et al., 2004) and mice (Song et al., 2003). These studies suggest that axonal degeneration and subsequent gliosis that follow an ischemic incident or lesion formation lead to a disruption of diffusion coherence, which decreases diffusion parallel to the primary diffusion direction. Burzynska et al. (submitted) recently interpreted a Radial Increase/Axial Decrease pattern in this manner. However, it may not completely explain the present results given that examination of high‐resolution structural scans by a Neurologist did not reveal any clinically significant structural abnormalities. Furthermore, this pattern of diffusivity change is commonly seen following insults in regions with consistent fiber orientation (Pierpaoli et al., 2001), whereas Radial Increase/Axial Decrease clusters in this study often contained projection tracts in regions with many crossing fibers, especially inferior‐to‐superior tracts that pass through long range anterior‐to‐posterior tracts (e.g., thalamic radiations in the RLIC, anterior/superior and superior corona radiata, and anterior pericallosal clusters; and corticospinal tract in superior corona radiata and cerebral peduncle clusters).
We propose an alternative interpretation: age‐related AD decreases may result from disrupted macrostructural organization. Radial Increase/Axial Decrease clusters with multiple white matter tracts likely have less coherent diffusion in any given orientation, and thus decreased AD. On its own, this effect should not differ across age groups (Head et al., 2004). However, macrostructural organization of these regions may be disrupted in older adults because of existing age differences in microstructural variables that affect axonal packing density (e.g., demyelination and axonal shrinkage) (Stadlbauer et al., 2008; Zhou et al., 1997), which may magnify the AD decrease in these regions with aging. In other words, AD in a cluster with crossing fibers would reflect the average primary diffusion direction of two highly aligned tracts in younger adults, but the average of two loosely aligned tracts (due to age‐related decreased packing density) in older adults, leading to lower AD in the latter group. Future research will be necessary to determine whether the Radial Increase/Axial Decrease pattern results from age‐related axonal degeneration versus age differences in macrostructural organization.
Anterior–Posterior Gradient
Results of this study support an anterior–posterior gradient, with the magnitude of the age difference in FA being significantly larger in anterior white matter clusters. The present findings are in line with histological studies showing that anterior white matter is more susceptible to age‐related alterations on variables affecting measures of integrity (e.g., myelin loss or damage) (e.g., Peters, 2002), and studies showing that other changes in the aging brain (e.g., gray matter shrinkage and neurotransmitter functioning) predominantly affect frontal regions (Raz, 2000; Salat et al., 2004; West, 1996). Nonetheless, it is important to note that the anterior–posterior gradient of age differences may be misleading, because age differences in white matter integrity often occur throughout the brain, as seen in the present data (see Fig. 1) and in previous studies (Head et al., 2004; Madden et al., 2004; Salat et al., 2005), with substantial variability in the magnitude of age differences across regions (see Fig. 2).
Limitations
The primary limitation of this study is that DTI, as implemented here and in most previous studies, cannot assess individual neural substrates that contribute to anisotropy and diffusivity smaller than the 1–3‐mm voxel size, such as degree of myelination, fiber orientation, and axonal loss. Thus, future studies using either higher resolution DTI or other techniques that can assess white matter microstructure at the cellular level (e.g., magnetic resonance spectroscopy) will be necessary to validate interpretations of patterns of age differences in diffusivity, such as those proposed here.
Nonetheless, certain DTI‐based studies may be useful in furthering our understanding of these patterns. For example, future studies that can incorporate measures of intervoxel coherence (e.g. lattice index) may be able to assess whether clusters with decreased FA and AD are in regions with crossing fibers (i.e., in regions with low lattice index), which may provide additional support for the theory that the Radial Increase/Axial Decrease pattern reflects age differences in macrostructural organization in these regions. Similarly, future studies could examine the classification of various white matter regions longitudinally to provide additional support for the notion that the patterns reflect varying degrees of severity of underlying neural changes. For example, such studies may show that at younger ages where white matter aging is minimal, most regions are classified as the Radial Increase Only pattern, whereas with increasing age and severity of underlying microstructural changes, more regions may be classified by the Radial/Axial Increase pattern. The presence of nonsignificant trends for age‐related increases and decreases in AD in most regions classified by the Radial Increase Only pattern (see Table IV) indicate that clusters have the potential to be reclassified over time depending on the progression of underlying microstructural and/or macrostructral level white matter changes.
Another potential limitation of the present study stems from the use of Tract‐Based Spatial Statistics (TBSS). This technique was chosen because it involves a high quality across‐subject registration procedure that relies on a “skeleton” created from the center of white matter tracts common to all participants (Smith et al., 2006, 2007), which minimizes alignment issues commonly seen when comparing groups, such as healthy older versus younger adults, with gross‐level brain differences (e.g., atrophy, ventricular enlargement, and sulcal expansion). This approach restricts analyses to major white matter tracts, thus reducing the area of white matter that could be identified as having significant age differences in FA. However, it has the benefit of reducing false identification of group differences, because it excludes white matter regions subject to partial voluming effects due to, for example, gray matter atrophy (Hugenschmidt et al., 2008) or CSF contamination (Bhagat and Beaulieu, 2004; Hirsch et al., 1999; Papadakis et al., 2002) that can decrease anisotropy and increase diffusivity measures. Thus, the skeletonizing technique used here minimized the likelihood that partial voluming effects can explain the present results, even in Radial/Axial Increase pattern clusters that are surrounded by gray matter and CSF.
The present analyses restricted age group comparisons of RD and AD to regions with significant age differences in FA, because the primary aim was to make inferences about the possible neural substrates underlying this commonly observed age difference in white matter integrity. However, certain patterns of age differences cannot be detected using this approach (e.g., regions with increased RD and/or AD, but not FA), and potential variations in the pattern of effects across voxels within each cluster were not assessed. Importantly, the region specificity of patterns identified here showed substantial overlap with findings from earlier DTI aging studies that used unrestricted analyses (i.e., voxel‐wise comparisons for each diffusivity measure) (Burzynska et al., submitted; Vernooij et al., 2008; Zhang et al., 2008). Similarly, when skeleton‐wise comparisons were conducted separately for each diffusivity measure (AD and RD) using the present data (not shown), every Radial/Axial Increase region continued to show the same pattern, as did the majority of Radial Increase Only (9/15) and Radial Increase/Axial Decrease (4/9) regions. Together, these results suggest that limiting analyses to regions with significant age differences in FA had minimal impact on the generality of the present results.
CONCLUSIONS AND IMPLICATIONS
This study used the well‐established approach of examining AD and RD in conjunction with FA to assess patterns of age differences in diffusivity and to make inferences about the underlying neural substrates. Of the nine previous DTI aging studies that have also assessed age differences in these diffusivity measures, only one recent report has taken steps to categorize these patterns and discuss the relevance of age‐related AD decreases (Burzynska et al., submitted), complementing this study. However, this study is one of the first to propose that a macrostructural level variable may underlie age differences in white matter integrity.
Taken together, results revealed three patterns of age differences in diffusivity in white matter clusters that had significant age‐related decreases in FA. In line with evidence from animal research, we propose that these three patterns reflect various combinations of at least two qualitatively different changes in underlying white matter that differentially affect RD and AD. First, age‐related increases in RD, seen in all white matter clusters in this study, may reflect an age‐related decrease in axonal packing density from microstructural level variables including demyelination, axonal loss or damage, and inflammation. These underlying neural changes may be mild in certain brain regions (Radial Increase Only pattern), whereas other regions that are more susceptible to aging, such as the genu of the corpus callosum, may have moderate to severe changes leading to increased RD and AD (Radial/Axial Increase pattern). Second, age‐related decreases in AD, seen in the Radial Increase/Axial Decrease pattern, may reflect age‐related axonal degeneration. However, given that this pattern primarily occurred in white matter regions with crossing fibers, the age‐related decrease in the coherence of diffusion may instead be due to age‐related differences in macrostructural organization. Results also revealed that age differences in FA were larger in anterior white matter clusters, consistent with the anterior–posterior gradient of aging, though differences were seen throughout the brain.
This study takes an important step toward understanding the neural substrates underlying differences in white matter integrity in healthy aging, though future research replicating these results and interpretations is necessary. Because many populations are characterized by decreased FA (e.g., schizophrenia, multiple sclerosis, mild cognitive impairment, and Alzheimer's disease), regional specificity of the various patterns of diffusivity may help dissociate changes in white matter integrity that are unique to healthy aging. Previous research suggests that age differences in FA are largest and occur earliest in frontal brain regions (i.e., the anterior–posterior gradient), but it may be possible to identify specific patterns of diffusivity occurring in specific locations that are characteristic of healthy brain aging, such as increases in all diffusivity measures occurring earliest in the genu of the corpus callosum.
Acknowledgements
The authors thank Dr. William Gaillard for screening the high‐resolution structural scans for abnormalities, Dr. Xiong Jiang for assistance with the imaging software, Meghan Shapiro and Alison Lenet for help with data collection, and Dawn Joseph and Kristin Thomas for their contributions to data analysis. Preliminary findings from this project were presented at the Society for Neuroscience Conferences in San Diego, CA in November, 2007 and Washington, DC in November, 2008; and the Cognitive Neuroscience Society Conference in San Francisco, CA in April, 2008.
REFERENCES
- Abe O, Aoki S, Hayashi N, Yamada H, Kunimatsu A, Mori H, Yoshikawa T, Okubo T, Ohtomo K ( 2002): Normal aging in the central nervous system: Quantitative MR diffusion‐tensor analysis. Neurobiol Aging 23: 433–441. [DOI] [PubMed] [Google Scholar]
- Aboitiz F, Scheibel AB, Fisher RS, Zaidel E ( 1992): Fiber composition of the human corpus callosum. Brain Res 598: 143–153. [DOI] [PubMed] [Google Scholar]
- Ardekani S, Kumar A, Bartzokis G, Sinha U ( 2007): Exploratory voxel‐based analysis of diffusion indices and hemispheric asymmetry in normal aging. J Magn Reson Imaging 25: 154–167. [DOI] [PubMed] [Google Scholar]
- Basser PJ, Mattiello J, LeBihan D ( 1994): MR diffusion tensor spectroscopy and imaging. Biophys J 66: 259–267. [DOI] [PMC free article] [PubMed] [Google Scholar]
- Basser PJ, Pierpaoli C ( 1996): Microstructural and physiological features of tissues elucidated by quantitative‐diffusion‐tensor MRI. J Magn Reson B 111: 209–219. [DOI] [PubMed] [Google Scholar]
- Beaulieu C ( 2002): The basis of anisotropic water diffusion in the nervous system—A technical review. NMR Biomed 15: 435–455. [DOI] [PubMed] [Google Scholar]
- Berman JI, Mukherjee P, Partridge SC, Miller SP, Ferriero DM, Barkovich AJ, Vigneron DB, Henry RG ( 2005): Quantitative diffusion tensor MRI fiber tractography of sensorimotor white matter development in premature infants. Neuroimage 27: 862–871. [DOI] [PubMed] [Google Scholar]
- Bhagat YA, Beaulieu C ( 2004): Diffusion anisotropy in subcortical white matter and cortical gray matter: Changes with aging and the role of CSF‐suppression. J Magn Reson Imaging 20: 216–227. [DOI] [PubMed] [Google Scholar]
- Bucur B, Madden DJ, Spaniol J, Provenzale JM, Cabeza R, White LE, Huettel SA ( 2008): Age‐related slowing of memory retrieval: Contributions of perceptual speed and cerebral white matter integrity. Neurobiol Aging 29: 1070–1079. [DOI] [PMC free article] [PubMed] [Google Scholar]
- Budde MD, Kim JH, Liang HF, Schmidt RE, Russell JH, Cross AH, Song SK ( 2007): Toward accurate diagnosis of white matter pathology using diffusion tensor imaging. Magn Reson Med 57: 688–695. [DOI] [PubMed] [Google Scholar]
- Cabeza R, Nyberg L, Park D, editors. 2005. Cognitive neuroscience of aging: Linking cognitive and cerebral aging. New York: Oxford University Press; 400 p. [Google Scholar]
- Davis SW, Dennis NA, Buchler NG, White LE, Madden DJ, Cabeza R ( 2009): Assessing the effects of aging on long white matter tracts using diffusion tensor tractography. Neuroimage 46: 530–541. [DOI] [PMC free article] [PubMed] [Google Scholar]
- Fjell AM, Westlye LT, Greve DN, Fischl B, Benner T, van der Kouwe AJ, Salat D, Bjornerud A, Due‐Tonnessen P, Walhovd KB ( 2008): The relationship between diffusion tensor imaging and volumetry as measures of white matter properties. Neuroimage 42: 1654–1668. [DOI] [PMC free article] [PubMed] [Google Scholar]
- Folstein MF, Folstein SE, McHugh PR ( 1975): “Mini‐mental state.” A practical method for grading the cognitive state of patients for the clinician. J Psychiatr Res 12: 189–198. [DOI] [PubMed] [Google Scholar]
- Giorgio A, Watkins KE, Douaud G, James AC, James S, De Stefano N, Matthews PM, Smith SM, Johansen‐Berg H ( 2008): Changes in white matter microstructure during adolescence. Neuroimage 39: 52–61. [DOI] [PubMed] [Google Scholar]
- Grieve SM, Williams LM, Paul RH, Clark CR, Gordon E ( 2007): Cognitive aging, executive function, and fractional anisotropy: A diffusion tenor MR imaging study. Am J Neuroradiol 28: 226–235. [PMC free article] [PubMed] [Google Scholar]
- Gunning‐Dixon FM, Brickman AM, Cheng JC, Alexopoulos GS ( 2009): Aging of cerebral white matter: A review of MRI findings. Int J Geriatr Psychiatry 24: 109–117. [DOI] [PMC free article] [PubMed] [Google Scholar]
- Head D, Buckner RL, Shimony JS, Williams LE, Akbudak E, Conturo TE, McAvoy M, Morris JC, Snyder AZ ( 2004): Differential vulnerability of anterior white matter in nondemented aging with minimal acceleration in dementia of the Alzheimer type: Evidence from diffusion tensor imaging. Cereb Cortex 14: 410–423. [DOI] [PubMed] [Google Scholar]
- Head D, Snyder AZ, Girton LE, Morris JC, Buckner RL ( 2005): Frontal‐hippocampal double dissociation between normal aging and Alzheimer's disease. Cereb Cortex 15: 732–739. [DOI] [PubMed] [Google Scholar]
- Hedden T, Gabrieli JD ( 2005): Healthy and pathological processes in adult development: New evidence from neuroimaging of the aging brain. Curr Opin Neurol 18: 740–747. [DOI] [PubMed] [Google Scholar]
- Hirsch JG, Bock M, Essig M, Schad LR ( 1999): Comparison of diffusion anisotropy measurements in combination with the flair‐technique. Magn Reson Med 17: 705–716. [DOI] [PubMed] [Google Scholar]
- Hsu JL, Leemans A, Bai CH, Lee CH, Tsai YF, Chiu HC, Chen WH ( 2008): Gender differences and age‐related white matter changes of the human brain: A diffusion tensor imaging study. Neuroimage 39: 566–577. [DOI] [PubMed] [Google Scholar]
- Hugenschmidt CE, Peiffer AM, Kraft RA, Casanova R, Deibler AR, Burdette JH, Maldjian JA, Laurienti PJ ( 2008): Relating imaging indices of white matter integrity and volume in healthy older adults. Cereb Cortex 18: 433–442. [DOI] [PubMed] [Google Scholar]
- Le Bihan D ( 2003): Looking in the functional architecture of the brain with diffusion MRI. Nat Rev Neurosci 4: 469–480. [DOI] [PubMed] [Google Scholar]
- Madden DJ, Spaniol J, Costello MC, Bucur B, White LE, Cabeza R, Davis SW, Dennis NA, Provenzale JM, Huettel SA ( 2009): Cerebral white matter integrity mediates adult age differences in cognitive performance. J Cogn Neurosci 21: 289–302. [DOI] [PMC free article] [PubMed] [Google Scholar]
- Madden DJ, Whiting WL, Huettel SA, White LE, MacFall JR, Provenzale JM ( 2004): Diffusion tensor imaging of adult age differences in cerebral white matter: Relation to response time. Neuroimage 21: 1174–1181. [DOI] [PubMed] [Google Scholar]
- Marner L, Nyengaard JR, Tang Y, Pakkenberg B ( 2003): Marked loss of myelinated nerve fibers in the human brain with age. J Comp Neurol 462: 144–152. [DOI] [PubMed] [Google Scholar]
- Mori S, Zhang J ( 2006): Principles of diffusion tensor imaging and its applications to basic neuroscience research. Neuron 51: 527–539. [DOI] [PubMed] [Google Scholar]
- Nair G, Tanahashi Y, Low HP, Billings‐Gagliardi S, Schwartz WJ, Duong TQ ( 2005): Myelination and long diffusion times alter diffusion‐tensor‐imaging contrast in myelin‐deficient shiverer mice. Neuroimage 28: 165–174. [DOI] [PMC free article] [PubMed] [Google Scholar]
- Papadakis NG, Martin KM, Mustafa MH, Wilkinson ID, Griffiths PD, Huang CL, Woodruff PW ( 2002): Study of the effect of CSF suppression on white matter diffusion anisotropy mapping of healthy human brain. Magn Reson Med 48: 394–398. [DOI] [PubMed] [Google Scholar]
- Peters A ( 2002): The effects of normal aging on myelin and nerve fibers: A review. J Neurocytol 31: 581–593. [DOI] [PubMed] [Google Scholar]
- Pfefferbaum A, Adalsteinsson E, Sullivan EV ( 2005): Frontal circuitry degradation marks healthy adult aging: Evidence from diffusion tensor imaging. Neuroimage 16: 891–899. [DOI] [PubMed] [Google Scholar]
- Pfefferbaum A, Sullivan EV ( 2003): Increased brain white matter diffusivity in normal adult aging: Relationship to anisotropy and partial voluming. Magn Reson Med 49: 953–961. [DOI] [PubMed] [Google Scholar]
- Pfefferbaum A, Sullivan EV, Hedehus M, Lim KO, Adalsteinsson E, Moseley M ( 2000): Age‐related decline in brain white matter anisotropy measured with spatially corrected echo‐planar diffusion tensor imaging. Magn Reson Med 44: 259–268. [DOI] [PubMed] [Google Scholar]
- Pierpaoli C, Barnett A, Pajevic S, Chen R, Penix LR, Virta A, Basser P ( 2001): Water diffusion changes in Wallerian degeneration and their dependence on white matter architecture. Neuroimage 13: 1174–1185. [DOI] [PubMed] [Google Scholar]
- Pierpaoli C, Basser PJ ( 1996): Toward a quantitative assessment of diffusion anisotropy. Magn Reson Med 36: 893–906. [DOI] [PubMed] [Google Scholar]
- Pierpaoli C, Jezzard P, Basser PJ, Barnett A, Di Chiro G ( 1996): Diffusion tensor MR imaging of the human brain. Radiology 201: 637–648. [DOI] [PubMed] [Google Scholar]
- Raz N ( 2000): Aging of the brain and its impact on cognitive performance: Integration of structural and functional findings In: Craik FIM, Salthouse TA, editors. The Handbook of Aging and Cognition, 2nd ed Mahwah: Lawrence Erlbaum Assoc; pp 1–90. [Google Scholar]
- Raz N, Lindenberger U, Rodrigue KM, Kennedy KM, Head D, Williamson A, Dahle C, Gerstorf D, Sacker JD ( 2005): Regional brain changes in aging healthy adults: General trends, individual differences, and modifiers. Cereb Cortex 15: 1676–1689. [DOI] [PubMed] [Google Scholar]
- Salat DH, Buckner RL, Snyder AZ, Greve DN, Desikan RS, Busa E, Morris JC, Dale AM, Fischl B ( 2004): Thinning of the cerebral cortex in aging. Cereb Cortex 14: 721–730. [DOI] [PubMed] [Google Scholar]
- Salat DH, Tuch DS, Greve DN, van der Kouwe AJ, Hevelone ND, Zaleta AK, Rosen BR, Fischl B, Corkin S, Rosas HD, Dale AM ( 2005): Age‐related alterations in white matter microstructure measured by diffusion tensor imaging. Neurobiol Aging 26: 1215–1227. [DOI] [PubMed] [Google Scholar]
- Shenkin SD, Bastin ME, MacGillivray TJ, Deary IJ, Starr JM, Wardlaw JM ( 2003): Childhood and current cognitive function in healthy 80‐year‐olds: A DT‐MRI study. Neuroreport 14: 345–349. [DOI] [PubMed] [Google Scholar]
- Smith SM, Jenkinson M, Johansen‐Berg H, Rueckert D, Nichols TE, Mackay CE, Watkins KE, Ciccarelli O, Cader MZ, Matthews PM, Behrns TEJ ( 2006): Tract‐based spatial statistics: Voxelwise analysis of multi‐subject diffusion data. Neuroimage 31: 1487–1505. [DOI] [PubMed] [Google Scholar]
- Smith SM, Johansen‐Berg H, Jenkinson M, Rueckert D, Nichols TE, Miller KL, Robson MD, Jones DK, Klein JC, Bartsch AJ, Behrens TEJ ( 2007): Acquisition and voxelwise analysis of multi‐subject diffusion data with tract‐based spatial statistics. Nat Protoc 2: 499–503. [DOI] [PubMed] [Google Scholar]
- Song SK, Sun SW, Ju WK, Lin SJ, Cross AH, Neufeld AH ( 2003): Diffusion tensor imaging detects and differentiates axon and myelin degeneration in mouse optic nerve after retinal ischemia. Neuroimage 20: 1714–1722. [DOI] [PubMed] [Google Scholar]
- Song SK, Sun SW, Ramsbottom MJ, Chang C, Russell J, Cross AH ( 2002): Dysmyelination revealed through MRI as increased radial (but unchanged axial) diffusion of water. Neuroimage 17: 1429–1436. [DOI] [PubMed] [Google Scholar]
- Song SK, Yoshino J, Le TQ, Lin SJ, Sun SW, Cross AH, Armstrong RC ( 2005): Demyelination increases radial diffusivity in corpus callosum of mouse brain. Neuroimage 26: 132–140. [DOI] [PubMed] [Google Scholar]
- Stadlbauer A, Salomonowitz E, Strunk G, Hammen T, Ganslandt O ( 2008): Age‐related degradation in the central nervous system: Assessment with diffusion‐tensor imaging and quantitative fiber tracking. Radiology 247: 179–188. [DOI] [PubMed] [Google Scholar]
- Sullivan EV, Adalsteinsson E, Pfefferbaum A ( 2006): Selective age‐related degradation of anterior callosal fiber bundles quantified in vivo with fiber tracking. Cereb Cortex 16: 1030–1039. [DOI] [PubMed] [Google Scholar]
- Sullivan EV, Pfefferbaum A ( 2003): Diffusion tensor imaging in normal aging and neuropsychiatric disorders. Eur J Radiol 45: 244–255. [DOI] [PubMed] [Google Scholar]
- Sullivan EV, Pfefferbaum A ( 2006): Diffusion tensor imaging and aging. Neurosci Biobehav Rev 30: 749–761. [DOI] [PubMed] [Google Scholar]
- Sullivan EV, Rohlfing T, Pfefferbaum A ( 2008): Quantitative fiber tracking of lateral and interhemispheric white matter systems in normal aging: Relations to timed performance. Neurobiol Aging. [DOI] [PMC free article] [PubMed] [Google Scholar]
- Sundgren PC, Dong Q, Gomez‐Hassan D, Mukherji SK, Maly P, Welsh R ( 2004): Diffusion tensor imaging of the brain: Review of clinical applications. Neuroradiology 46: 339–350. [DOI] [PubMed] [Google Scholar]
- Tang Y, Nyengaard JR, Pakkenberg B, Gundersen HJ ( 1997): Age‐induced white matter changes in the human brain: A stereological investigation. Neurobiol Aging 18: 609–615. [DOI] [PubMed] [Google Scholar]
- Thomalla G, Glauche V, Koch MA, Beaulieu C, Weiller C, Rother J ( 2004): Diffusion tensor imaging detects early Wallerian degeneration of the pyramidal tract after ischemic stroke. Neuroimage 22: 1767–1774. [DOI] [PubMed] [Google Scholar]
- Vernooij MW, de Groot M, van der Lugt A, Ikram MA, Krestin GP, Hofman A, Niessen WJ, Breteler MM ( 2008): White matter atrophy and lesion formation explain the loss of structural integrity of white matter in aging. Neuroimage 43: 470–477. [DOI] [PubMed] [Google Scholar]
- West RL ( 1996): An application of prefrontal cortex function theory to cognitive aging. Psychol Bull 120: 272–292. [DOI] [PubMed] [Google Scholar]
- Yoon B, Shim YS, Lee KS, Shon YM, Yang DW ( 2008): Region‐specific changes of cerebral white matter during normal aging: A diffusion‐tensor analysis. Arch Gerontol Geriatr 47: 129–138. [DOI] [PubMed] [Google Scholar]
- Zahr NM, Rohlfing T, Pfefferbaum A, Sullivan EV ( 2009): Problem solving, working memory, and motor correlates of association and commissural fiber bundles in normal aging: A quantitative fiber tracking study. Neuroimage 44: 1050–1062. [DOI] [PMC free article] [PubMed] [Google Scholar]
- Zhang Y, Du AT, Hayasaka S, Jahng GH, Hlavin J, Zhan W, Weiner MW, Schuff N ( 2008): Patterns of age‐related water diffusion changes in human brain by concordance and discordance analysis. Neurobiol Aging. [DOI] [PMC free article] [PubMed] [Google Scholar]
- Zhou M, Goto N, Otsuka N, Moriyama H, Nakamura Y ( 1997): Morphometric analyses of axons in the lateral corticospinal tract with ageing process. Okajimas Folia Anatom Japonica 74: 133–138. [DOI] [PubMed] [Google Scholar]