

Summary
Objective
Small hyaluronan oligosaccharides displace hyaluronan from the cell surface and induce cell signaling events. In articular chondrocytes this cell signaling is mediated by the hyaluronan receptor CD44 and includes stimulation of genes involved in matrix degradation such as matrix metalloproteinases (MMP) as well as matrix repair genes including collagen type II, aggrecan and hyaluronan synthase-2 (HAS-2). The objective of this study was to determine whether stimulation of HAS-2 and MMP-3 by hyaluronan oligosaccharides is due to the activation of a single, cascading pathway or multiple signaling pathways.
Method
Bovine articular chondrocytes were pre-treated with a variety of inhibitors of major signaling pathways prior to the addition of HA oligosaccharides. Changes in hyaluronan were monitored by realtime RT-PCR analysis of HAS-2 mRNA, HA-ELISA and hyaluronan accumulation at the cell surface. A 1900 base pair sequence containing the proximal promoter of HAS-2 was inserted into a luciferase reporter construct, transfected into human immortalized chondrocytes and assayed in a similar fashion.
Results
While our previous studies demonstrated that hyaluronan oligosaccharides stimulate MMP-13 activity via activation of p38 MAP kinase and NF-κB, inhibitors of these pathways did not affect the stimulation of HAS-2 mRNA expression. However, inhibiting the phosphatidylinositol-3-kinase pathway blocked hyaluronan oligosaccharide-mediated stimulation of HAS-2 yet had no effect on MMP-3. Wortmannin and LY294002 also blocked hyaluronan oligosaccharide-induced serine and threonine Akt phosphorylation. Treatment of transfected immortalized chondrocytes with hyaluronan oligosaccharides resulted in stimulation of HAS-2 mRNA, activation of Akt and enhanced luciferase activity—activity that was blocked by inhibitors of Akt phosphorylation.
Conclusions
Changes in chondrocyte-matrix interactions by hyaluronan oligosaccharides induce altered matrix metabolism by the activation of least two distinct signaling pathways.
Keywords: hyaluronan, hyaluronan oligosaccharides, CD44, HAS-2, chondrocytes
Introduction
Many connective tissue cells exhibit a large hyaluronan (HA) and proteoglycan-rich pericellular matrix that is tethered to the cell surface via interactions with the HA receptor, CD441,2. HA oligosaccharides, of the size of a HA hexasaccharide or larger, can compete with the binding of high molecular mass HA to CD44 and competitively displace HA (and the proteoglycan-rich pericellular matrix) from the cell surface1–7. In addition to the physical loss of this cell-associated pericellular matrix, the uncoupling of HA from CD44 gives rise to signal transduction events—responses that differ depending on the cell type2, 3, 6–9. In some cells, such as chondrocytes, HA polysaccharide bound at the cell surface represents the quiescent state. Thus, the binding of a ligand alone is not the inductive signal. Under these conditions, HA oligosaccharides function as specific HA antagonists. The best model currently is that CD44 is clustered at the plasma membrane by way of multivalent interactions with high molecular mass HA—clustering that is reversed by addition of excess monovalent HA oligosaccharides3,10. The transmembrane receptor CD44 has a 72 amino acid intracellular tail domain but no inherent kinase activity. Thus, signaling events induced by HA oligosaccharide unclustering of CD44 likely involve the activation of CD44-associated proteins including changes in the cytoskeletal components.
In articular cartilage, chondrocytes sense and respond to changes in their extensive extracellular matrix10–11. In osteoarthritis, early events in the degenerative process may be initiated by changes in chondrocyte-matrix interactions. To explore the role of HA and CD44 in these processes, intact cartilage slices were treated with HA oligosaccharides to effect a displacement of the HA-rich matrix from the chondrocyte cell surface. In our previous study, HA oligosaccharides initiated a chondrocytic chondrolysis cascade including a dramatic loss of safranin O staining8. This cascade included initiation of proteolytic events including the activation of several matrix metalloproteinases (MMPs) as well as an increase in NITEGE neoepitope8 (indicative of aggrecan cleavage by ADAMTS-5 or other aggrecanases12). This catabolic activation could be modeled by treating chondrocyte cultures, either in monolayer or alginate beads, with HA oligosaccharides. Interestingly however, in addition to the stimulation of MMP-3, MMP-13 and nitric oxide, there was also a stimulation of genes involved in the biosynthesis of extracellular matrix, such as aggrecan, COMP and collagen type II8, 9, 13–16. HA synthase-2 (HAS-2) mRNA was also upregulated following treatment of chondrocytes with HA oligosaccharides8, 16. Thus, there is an apparent coordination between HA oligosaccharide-mediated stimulation of matrix degradation and matrix biosynthesis. The objective of this study was to determine whether these opposing events represented the activation of a single, cascading pathway or the activation of multiple signaling pathways. One hypothesis would be that the stimulation of matrix biosynthesis represents an “attempted repair” phase by the chondrocytes in response to the stimulation/activation of cartilage chondrolysis. If this were the case, blocking the signaling pathways responsible for MMP stimulation would block downstream stimulation of new matrix biosynthesis. In addition, stimulation of matrix biosynthesis would occur at time points later than those observed for MMPs or nitric oxide. In the current study we demonstrate that the HA oligosaccharide stimulation of at least one anabolic gene, HAS-2, occurs in 6 hours. Additionally, the stimulation of HAS-2 mRNA expression and HAS-2 promoter luciferase activity were not inhibited by chemical inhibitors that block HA oligosaccharide-mediated stimulation of MMPs.
Methods
Cell culture
Chondrocytes were isolated from full thickness slices of the articular surface of the metacarpophalangeal joints of 18–24 month old adult bovine steers17. The cartilage slices were digested in 0.2% pronase (Calbiochem, San Diego, CA) in Dulbecco’s modified Eagle’s medium (DMEM; Mediatech, Herndon, VA) plus 10% fetal bovine serum (FBS; Hyclone) for 1.5 hours at 37°C, followed by an overnight digestion with 0.025% collagenase-P (Calbiochem) in DMEM containing 10 % FBS. Primary chondrocytes were plated as high-density monolayers (4 × 10⁶ cells/35 mm2 dishes) in DMEM supplemented with 50 units/ml penicillin (Mediatech), 50 μg/ml streptomycin (Mediatech) and 10% FBS and incubated at 37°C in an atmosphere containing 5% CO2. The immortalized human chondrocyte cell line (C-28/I2) was kindly provided by Dr. Mary Goldring (Hospital for Special Surgery, New York). C-28/I2 cells were maintained in a 1:1 mixture of DMEM/Ham’s F12 medium containing 10% FBS.
Hyaluronan oligosaccharides
Hyaluronan from human umbilical cord or rooster comb (Sigma) was used to generate HA oligosaccharides by testicular hyaluronidase (type I-S; Sigma) cleavage at a ratio of 320 units/mg hyaluronan in 0.1M sodium acetate buffer with 0.15M NaCl, pH 5.018. Digestion conditions of 16 hours at 37°C yielded preparations with a predominant peak of HA hexasaccharides by chromatographic analysis8. At the end of the reaction, the hyaluronidase was heat-inactivated and then precipitated with 10% trichloroacetic acid. The oligosaccharide-containing supernatant was dialyzed in 1000 MWCO dialysis tubing (Spectrum Medical Industries, Houston, TX) with four changes of H2O over 48 hours, lyophilized to dryness and then redissolved in sterile phosphate buffer saline (PBS). As a control, HA disaccharides (HA2) were generated from the HA oligosaccharides by treatment with 10 units/ml chondroitinase ABC8.
Real time reverse transcriptase-polymerase chain reaction (RT-PCR)
Total RNA was isolated from the bovine chondrocytes or C-28/I2 cultures using TRI® Reagent (Sigma) according to the manufacturer’s instructions. Samples were reverse transcribed and PCR amplified using OneStep RT qPCR Master Mix for SYBR® Green I (Eurogentec, San Diego, CA). The primer-specific annealing temperature (AT) and detection temperature (DT) cycles were run at the following temperatures: glyceraldehyde-3-phosphate dehydrogenase (GAPDH), AT 57°C, DT 74 °C; HAS-2 and MMP-3, AT 55°C, DT 72°C. The DTs were set below the individual melting peak of each PCR product. The PCR primer sets were; GAPDH (forward: 5′-GTCAACGGATTTGGTCGTATTGGG-3′, reverse: 5′-TGCCATGGGTGGAATCATATTGG-3′); MMP-3 (forward: 5′-CTCACAGACCTGACTCGGTT-3′, reverse: 5′-CACGCCTGAAGGAAGAGATG3′) and; HAS-2 (forward: 5′-GAGGACGACTTTATGACCAAGAGC-3′, reverse: 5′-TAAGCAGCTGTGATTCCAAGGAGG-3′). Thermal cycling and fluorescence detection was performed using the Smart Cycler system (Cepheid, Sunnyvale, CA). Efficiency (E) of the real time PCR was calculated according to the equation by Rasmussen et al.19 as E=10(−1/slope) for GAPDH, HAS-2 and MMP-3. The slope was determined from a graph of x = ng cDNA input and y = cycle number at the crossing point (CP). The CP is the PCR cycle number determined by the Smart Cycler software as the peak of 2nd derivative curve of the increase in SYBR Green fluorescence as amplification proceeds. A value for fold increase was calculated as a relative ratio of a target gene (e.g., HAS-2) to GAPDH, following the mathematical model and equation introduced by Pfaffl20. Using this equation, the fold increase in mRNA copy numbers of target mRNAs HAS-2 or MMP-3, between treated and untreated control conditions, can be determined. Fold increase = (Etarget)CP target (MEAN control−MEAN treated)/(EGAPDH)CP GAPDH (MEAN control−MEAN treated)
Generation of a HAS-2 promoter construct
PCR primers were designed to amplify a DNA region within the HAS-2 gene extending from −1774 to +160 base pairs with respect to the transcriptional start site described by Monslow et al 21. The primers were engineered to include restriction enzyme sites for Mlu I and Bgl II on the 5′ ends of the forward and reverse primers, respectively: forward 5′-GAGACGCGTATTTAGAGCTGGAAGGTTAAGT-3′ and reverse 5′-GAGCTCAGATCTATGGTTCAATGGGCTC-3′. Purified human genomic DNA (Promega) was PCR amplified using Pfx taq polymerase (Invitrogen, Carlsbad, CA) with AT of 55°C and extension temperature of 68°C for 30 cycles. The PCR products were purified and cloned into a pCR2.1 TOPO vector plasmid (Invitrogen). The TOPO plasmid DNA insert was then subcloned into the pGL3 Basic plasmid (Promega) using the restriction enzymes Mlu I and Bgl II and given the designation pHAS2 (1932)-Luc. All inserts were verified by restriction digest analysis and DNA sequencing at the University of Illinois sequencing laboratory core facility.
Transient transfections
The human immortalized chondrocytes (C-28/I2) were plated 24 hours prior to transfection at a density of 1 × 10⁵ cells/well in 12-well plates and transiently transfected with 1 μg of the pHAS2 (1932)-Luc construct using FuGENE 6 transfection reagent (Roche Applied Science) following the manufacturer's instructions. The firefly luciferase promoterless vector, pGL2-Enhancer (Promega) was used as a control. After 24 hours of incubation, the cells were rinsed in PBS and changed to serum-free condition for 20–24 hours followed by treatment with 250 μg/ml HA6 or 1 ng/ml IL-1α (R&D Systems, Minneapolis, MN). The cells were harvested after 24 hours, and luciferase activity was assayed using a luciferase reporter assay system (Promega). The data were normalized to total protein levels in each well.
Treatment of cells with chemical inhibitors of major signaling pathways
Cells were brought to serum-free conditions by incubation in 1% FBS for 24 h and then to 0% for the start of the experiment. Chondrocytes were incubated with 250 μg/ml HA oligosaccharides for time periods between 0–24 hours. For signaling inhibition assays, bovine chondrocytes were pre-treated with inhibitors of NF-κB (1 μM Helenalin, Calbiochem); p38 MAP kinase (5 μM SB203580, Calbiochem); Src kinase (10 μM PP2, Calbiochem); MAP kinase kinase (MEK1/2, 10 μM PD98059, Calbiochem) or; PI3K/Akt (100 nM Wortmannin, Sigma or; 25 μM LY294002, Calbiochem) for 30 minutes and then, treated with 250 μg/ml HA oligosaccharides for 0–24 hours in the presence or absence of each inhibitor.
Western blotting of Akt-phosphorylation
Following incubation in the absence or presence of HA oligosaccharides or pathway inhibitors, the chondrocyte cell layers were extracted with cell lysis buffer (Cell Signaling Technology, Inc., Danvers, MA) and 1x protease and phosphatase inhibitors cocktail (Sigma). The cell lysates were separated by a 10% SDS-PAGE and electroblotted onto nitrocellulose membranes. The nitrocellulose membranes were blocked with 5% nonfat dry milk in TBS containing 0.1% Tween 20 for 1 hour, followed by an overnight incubation at 4°C with anti-phospho-Akt (ser473 and thr308) rabbit monoclonal antibody (Cell Signaling Technology, Inc). Detection was performed using chemiluminescence (Western Blotting Luminol Reagent, Santa Cruz Biotechnology). After imaging, the blots were stripped for 30 minutes at 50°C and re-probed using rabbit monoclonal antibodies directed against total Akt (Cell Signaling Technology, Inc) or β-actin (AC-15; Sigma).
Casein zymography
Serum-free conditioned medium samples (30 μl) were activated with 2.5 μM aminophenylmercuric acetate (APMA) for 1 hour at 37°C and then separated by 12% SDS-PAGE containing casein (Invitrogen). The gels were washed twice, 30 min each, in zymogram renaturing buffer (Invitrogen) and then incubated overnight at 37°C in zymogram developing buffer (Invitrogen) containing APMA. The gels were then stained with 1% Coomassie R-250 blue in 40% ethanol and 10% acetic acid for 1 minute with microwave heating at full power and then 15 minutes at room temperature. De-staining included 1 minute microwave heating at full power and incubation at room temperature in 10% ethanol and 7.5% acetic acid until clear bands over a dark background were observed. The bands were imaged and quantified using the fluorimaging system (Fluor-S MultiImager, Bio-Rad, Hercules, CA).
Immunofluorescence microscopy and HA ELISA
For these experiments, chondrocytes were treated without or with HA oligosaccharides for 8 hours, rinsed to remove HA oligosaccharides, followed by a 24 hour incubation and subsequent collection of the conditioned media. The media samples were assayed for HA using a HA ELISA (DuoSet, R&D) that probes using biotinylated recombinant aggrecan (N-terminal peptide). Chondrocyte monolayers in 4-well chamber slides (105 per well) were fixed in 2% paraformaldehyde in PBS, pH 7.4 for 1 hour, quenched with 0.2 M glycine in PBS and blocked in 1% bovine serum albumin (BSA, Sigma) in PBS for 1 hour. The cells were then incubated with 2.0 μg/ml of a biotinylated-HABP probe (Seikagaku USA, Ijamsville, MD) for 2 hours at room temperature for HA detection. Following extensive washing, the cells were incubated with 1 μg/ml neutravidin-FITC (1:1000) (Molecular Probes, Inc., Eugene, OR) in PBS containing 1% BSA for 1 hour at 4°C. The cells were then washed, mounted in mounting media containing the nuclear stain, 4′,6-diamidino-2-phenylindole, dihydrochloride (DAPI; Molecular Probes) and visualized using a Nikon Eclipse E600 microscope equipped with Y-Fl Epi-fluorescence (Melville, NY). Images were captured digitally in real time using a Spot-RT camera (Diagnostic Instruments, Sterling Heights, MI) and processed using NIS Elements BR imaging software (Nikon, Lewisville, TX).
Results
Time course for the stimulation of HAS-2 mRNA by HA oligosaccharides
Primer sets for real time PCR amplification and quantification of bovine HAS-2 and GAPDH were designed and validated. As shown in Figure 1A, aliquots of total RNA were reverse transcribed and PCR amplified in triplicate for each primer set. Each primer set generated a consistent, single melt curve for both GAPDH and HAS-2 cDNA, indicative of a single product. The generation of a single product was also confirmed by agarose gel electrophoresis of amplified products, each of the expected product size. Amplification efficiencies for each primer set were also determined allowing the comparison of mRNA copy numbers between treated versus control cultures, normalized to GAPDH. As shown in Figure 1B, no change in the ratio of copy numbers for HAS-2 was observed following 3 hours of incubation with HA oligosaccharides. However, after 6 hours of incubation with the HA oligosaccharides, there was a 2.7-fold increase in HAS-2 mRNA copy number as compared to untreated chondrocytes—an increase still detected at the 24 hour time point. C-28/I2 immortalized human chondrocytes are often used as a model system to study signal transduction. C-28/I2 cells treated with HA oligosaccharides also exhibited an increase in HAS-2 mRNA at 6 and 24 hours (Figure 1B). However, if the same HA oligosaccharides, at the same concentration, were predigested to HA disaccharides (HA2) using chondroitinase ABC, no significant stimulation of C-28/I2 HAS-2 mRNA was observed.
Figure 1. Time course for the stimulation of HAS-2 mRNA by HA oligosaccharides.

Panel A. Total RNA was isolated from bovine articular chondrocytes, reverse transcribed into cDNA for HAS-2 or GAPDH and amplified by polymerase chain reaction. Following amplification, the temperature was gradually increased and the loss of SYBR green fluorescence was monitored. The presence of a single Tm value is indicative of a single PCR product in the reaction mixture. The final cDNA products were also separated by electrophoresis on a 1.5% agarose gel and exhibited the correct predicted size of 142 bp and 121 bp for GAPDH and HAS-2 respectively. As a control, real time RT-PCR reactions were performed under conditions in which the reverse transcriptase was absent from the reaction mixture, lanes 7 and 14. A similar evaluation was determined separately for total RNA derived from C-28/I2 chondrocytes and for the efficiency of MMP-3 primers.
Panel B. Bovine articular or C-28/I2 chondrocytes cultured in monolayer in DMEM/Ham’s F12 were brought to serum-free conditions (0 hrs) and then incubated for 3, 6, and 24 hours with or without 250 μg/ml HA oligosaccharides under serum-free conditions. C-28/I2 cells were also treated for 24 hours with 250 μg/ml HA disaccharides (HA2) derived from HA oligosaccharides by chondroitinase ABC treatment. Total RNA was isolated, reverse transcribed into cDNA and PCR amplified with SYBR green. The fold change in HAS-2 copy number values represent the average ± S.D. of data derived from triplicate cultures, assayed in triplicate. Fold increases from 6 and 24 hour treated chondrocytes and C-28/I2 cells exhibited significant differences from control; * p < 0.05, ** p < 0.01 respectively as measured using an unpaired Student’s t test.
As an approach to link the stimulation of HAS-2 mRNA to enzyme activity, changes in the production of HA itself were documented. As shown in Figure 2A, treatment of bovine chondrocytes with HA oligosaccharides resulted in a 7.6 fold increase in HA secreted into the culture medium. Moreover, treatment with HA oligosaccharides also resulted in a substantial enhancement of cell surface-associated HA (green fluorescence, Figure 2C versus 2B; detected using a HA-specific biotinylated HA binding protein). The enhancement was quantified by morphometric analysis as shown in Table 1. HA oligosaccharide-treated chondrocytes exhibited a 1.5-fold increase in values for maximal green fluorescence pixel intensity above untreated control cells. However, as seen if Figure 2B, while the fluorescence intensity itself is only enhanced 1.5-fold above control cells, there is also a substantial difference in the size of the pericellular matrices. The sum of pixel intensities in the area delineated by the observable FITC-pericellular matrices of HA oligosaccharide-treated chondrocytes was 2.3 times the summed intensities of untreated control cells (Table 1). This was also reflected by an increase in the overall area delineated by the HA oligosaccharide-treated chondrocytes. These HA production data suggest the 2.7 fold increase in HAS-2 mRNA (Figure 1) is matched by an increase in HAS-2 protein activity.
Figure 2. Changes in medium and cell surface hyaluronan after treatment with HA oligosaccharides.
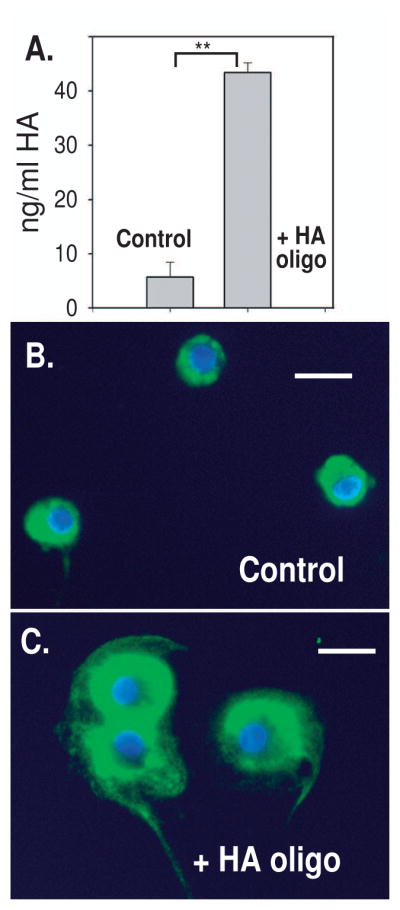
Bovine articular chondrocytes were treated for 8 hours in the presence or absence of 250 μg/ml HA oligosaccharides in serum-free DMEM/Ham’s F12 medium, followed by an additional 24 hours of culture in fresh, serum-free DMEM/Ham’s F12 medium. Panel A. Aliquots of the culture medium were then analyzed by ELISA for HA content following comparison to hyaluronan standard curve. Treatment increased HA significantly above control; ** p < 0.01 as measured using an unpaired Student’s t test.
After washing the cell layer, the chondrocytes were incubated with a biotintylated HABP probe, washed, incubated with neutravidin-FITC and mounting medium containing DAPI. The chondrocytes were visualized by fluorescence microscopy using a Nikon E600 microscope with a 20× objective. Panel B. Control chondrocytes cultured in serum-free DMEM/Ham’s F12 medium without HA oligosaccharides. Panel C. Chondrocytes cultured in the presence of 250 μg/ml HA oligosaccharides in serum-free DMEM/Ham’s F12 medium. The images shown depict representative two-color digital overlays of green and blue fluorescence images captured separately (of 6 fields of view from two separate experiments). Bar = 20 μm.
Table 1.
Morphometric analysis of changes in cell-associated HA in bovine articular chondrocytes
| Parameter | Control chondrocytes | HAoligo treated | fold change | Significance |
|---|---|---|---|---|
| Maximal pixel intensity1 | 133 ± 44 (n=34) | 194 ± 40 (n=35) | 1.5x | p<0.0001† |
| Sum of pixel intensities2 | 244 ± 174 (n=35) | 557 ± 336 (n=35) | 2.3x | p<0.0001 |
| Cell-associated area3 | 32 ± 25 (n=33) | 89 ± 41 (n=35) | 2.7x | p<0.0001 |
Values for maximal pixel intensity or,
sum of pixel intensities (×103) ± S.D. for each cell condition were obtained by analysis of regions of the cell-associated area (cell + pericellular matrix) for each cell using Nikon NIS Elements BR 2.30 Image Analysis software (255 = maximal value per channel). Software provides a value for maximum or sum of pixel intensities within a defined region.
Values for the area of cell-associated matrices ± S.D were determined by trace of the total cell + pericellular matrix perimeter for each cell using BioRad Quantity One 4.6.1 image analysis software. Values denote mm2 of cell-associated area/cell as imaged on a Raw 1-D image of a 20x field of view of chondrocytes.
Denotes p-value for statistical significance between values for control and HA oligosaccharide (HAoligo) treated cell cultures as measured using an unpaired Student’s t test.
Effect of chemical inhibitors of signaling pathways on the stimulation of HAS-2 mRNA by HA oligosaccharides
Chemical inhibitors of NF-κB (Helenalin) and the p38 MAP kinase (SB203580) pathway that blocked HA oligosaccharide-induced increases in MMP-1315 were used to determine their effects on HAS-2 mRNA stimulation. In control chondrocyte cultures, without added inhibitor, there was a >3-fold increase in HAS-2 mRNA following 24 hours of exposure to HA oligosaccharides (Figure 3A). Upon pretreatment with the NF-κB pathway inhibitor Helenalin or the p38 MAP kinase inhibitor SB203580 (at the same concentrations that inhibited stimulation of MMP-13 mRNA15), an increase in HA oligosaccharide-induced HAS-2 expression was still observed. Similar results were obtained using another NF-κB pathway inhibitor, SN50 (data not shown). Previous studies by others using the general Src kinase inhibitor, PP2 had suggested the participation of Src kinase in mediating metabolic changes induced by HA oligosaccharides22, 23. However, as shown in Figure 3A, pretreatment with PP2 also did not block the stimulation of HAS-2. Other investigators demonstrated that HA oligosaccharides induce apoptosis in anchorage-independent tumor cell lines via the phosphatidylinositol-3-kinase (PI3K)/Akt pathway3. Two reagents, Wortmannin and LY294002 are commonly used to block the phosphorylation of Akt. As shown in Figure 3A, LY294002 affected a small decrease in HAS-2 mRNA in control cells. However, both Wortmannin and LY294002 pretreatments effectively blocked the HA oligosaccharide-induced stimulation of HAS-2 mRNA.
Figure 3. Effect of chemical inhibitors of signaling pathways on HA oligosaccharide-mediated stimulation of HAS-2 and MMP3 in bovine articular chondrocytes.

Panel A. Bovine articular chondrocytes cultured in monolayer in DMEM/Ham’s F12 were brought to serum-free conditions and then preincubated with or without chemical inhibitors: PP2, Helenalin, SB203580, Wortmannin (Wort) or LY294002, 30 minutes prior to, and during the addition or absence of 250 μg/ml HA oligosaccharides (HAoligo) under serum-free conditions. Total RNA was isolated, reverse transcribed into cDNA and PCR amplified using SYBR green. The fold change in HAS-2 mRNA copy number values represent the average ± S.D. of data derived from triplicate cultures. Fold increases following HA oligosaccharide treatment, in control (no inhibitor), PP2, Helenalin and SB203580 conditions represented significant increases above control; p= 0.0037, 0.0486, 0.0116 and 0.0022, respectively as measured using an unpaired Student’s t test.
Panel B. Another set of bovine articular chondrocyte cultures were preincubated with or without the chemical inhibitors Wortmannin or LY294002, 30 minutes prior to, and during the addition of 250 μg/ml HA oligosaccharides under serum-free conditions. The fold change in MMP-3 mRNA copy number between control and treated cultures was determined as described in panel A. Fold increases following HA oligosaccharide treatment, in control (no inhibitor), Wortmannin (Wort) or LY294002 conditions represented significant increases above control; p= 0.00007, 0.0003, and 0.0004, respectively as measured using an unpaired Student’s t test. Panel C. Conditioned medium from chondrocytes treated with or without 250 μg/ml HA oligosaccharides (- + HAoligo) under serum-free conditions, with or without Helenalin or LY294002 were processed for casein zymography. The gel image shown was digitally inverted to generate dark bands on a light background.
These data suggested that the stimulation of MMPs and HAS-2 by HA oligosaccharides were mediated by separate signaling pathways. To further validate this hypothesis, we determined the effect of PI3K/Akt pathway inhibitors on MMP-3 expression. As shown in Figure 3B, HA oligosaccharides affected an approximately 5-fold increase in MMP-3 mRNA expression as determined by real time RT-PCR. While both Wortmannin and LY294002 affected a small increase in MMP-3 mRNA in control cells, neither reagent significantly blocked the stimulation of MMP-3 expression following treatment with HA oligosaccharides. Using an alternative approach, MMP activity was visualized by caseinolytic zymography. As shown in Figure 3C, whereas Helenalin completely blocked HA oligosaccharide mediated stimulation of caseinolytic activity bands, LY294002 exhibited only a slight inhibition of this activity. In this experiment, the size of the predominant, activated caseinolytic band was ~45 kD, indicative (although not definitive) of MMP-3.
Effect of Wortmannin and LY294002 on Akt phosphorylation
To further substantiate the participation of the PI3K pathway in response to HA oligosaccharide treatment of chondrocytes, the effects on Akt phosphorylation were explored. Figure 4A depicts a western blot analysis of lysates derived from bovine articular chondrocytes probed with an antibody to Akt phosphorylated at the thr308 residue. Following treatment with HA oligosaccharides for 3 hours, a substantial activation of Akt was observed (Figure 4A, lane 4) as compared to control cells (lane 1). This level of activation was similar in intensity to the positive control, chondrocytes treated with bFGF (Figure 4A, lane 5). However, chondrocytes treated with HA oligosaccharides in the presence of Wortmannin exhibited a substantially diminished activation of Akt (Figure 4A, lane 3).
Figure 4. Effect of chemical inhibitors of the PI3-kinase pathway and HA oligosaccharides on Akt phosphorylation.

Panel A. Bovine articular chondrocytes cultured in monolayer in DMEM/Ham’s F12 were brought to serum-free conditions and then preincubated with the chemical inhibitor, Wortmannin, 30 minutes prior to, and during the addition of 250 μg/ml HA oligosaccharides for 3 hours. Chondrocytes were washed, solubilized with cell lysis buffer and processed for western blot analysis on 10% SDS-PAGE gels. The western blot was probed using antibodies specific for Akt phosphorylated at thr308. Lane 1 is lysate derived from untreated control cells (Ctr); lane 2, chondrocytes treated with Wortmannin (Wort); lane 3, cells treated with Wortmannin and 250 μg/ml HA oligosaccharides (Wort + HAoligo); lane 4, cells treated with HA oligosaccharides alone (Ctr + HAoligo), and; lane 5, chondrocytes treated with bFGF. Following visualization the western blot was stripped and re-probed for total Akt. Panel B. C-28/I2 cells cultured in monolayer in DMEM/Ham’s F12 were brought to serum-free conditions and then incubated with 250 μg/ml HA oligosaccharides for 0, 15, 30, 60, 180 or 360 minutes. Cell lysates were probed using antibodies specific for Akt phosphorylated at ser473. Following visualization the western blots were stripped and re-probed for total Akt and β-actin. Panel C. C-28/I2 cells cultured in monolayer in DMEM/Ham’s F12 were brought to serum-free conditions and then preincubated with the chemical inhibitors, Wortmannin (Wort) or LY294002 (LY), 30 minutes prior to, and during the addition of 250 μg/ml HA oligosaccharides for 30 minutes. In this experiment western blots of these cell lysates were probed using antibodies specific for Akt phosphorylated at thr308 or ser473 as labeled. Following visualization the western blots were stripped and re-probed for total Akt or β-actin.
Human C-28/I2 chondrocytes also displayed a time-dependent increase in Akt activation following exposure to HA oligosaccharides (Figure 4B). With these cells, the strongest response was observed using antibodies directed toward phosphorylation of Akt ser473. In another experiment, C-28/I2 cells treated with HA oligosaccharides for 30 minutes exhibited activation of Akt, observed by thr308 and ser473 phosphorylation, with ser473 phosphorylation displaying the strongest response (Figure 4C, lane 2). Pre-treatment with Wortmannin (lane 4) or LY294002 (lane 6) again blocked the HA oligosaccharide-stimulated activation of Akt. Thus, C-28/I2 cells exhibit HA oligosaccharide-induced induction of HAS-2 mRNA (Figure 1B) and activation of PI3K/Akt pathway.
Effect of chemical inhibitors of signaling pathways on the stimulation by HA oligosaccharides of HAS-2 promoter activity
A region approximately 2000 bp upstream from the transcriptional start site21 of the human HAS-2 was identified as a potential promoter region using the web based program “zPicture” (a dynamic blastz alignment visualization program) located at http://zpicture.dcode.org/. The localization of potential cis element transcription factor sites within this region homologous to mouse and human were identified using the web based program; “Regulatory Vista” (rVista) at http://rvista.dcode.org/and, “MatInspector” at http://www.genomatix.de/products/MatInspector/index.html. Based on these data, a 1932 bp region upstream of the transcriptional start site was subcloned into a pGL3 luciferase plasmid as depicted in Figure 5A. The HAS-2 promoter construct, given the designation pHAS2(1932)-Luc, was transfected into C-28/I2 immortalized human chondrocytes and assayed for luciferase activity. In untreated control cells, the basal luciferase activity of the pHAS2(1932)-Luc was approximately 7-fold higher that the pGL3-basic plasmid with no insert (data not shown). As shown in Figure 5B, treatment with HA oligosaccharides for 24 hours resulted in ~2-fold increase in luciferase activity, as compared to transfected untreated cells. These results demonstrate that the pHAS2(1932)-Luc construct contains a region of the human HAS-2 promoter/enhancer sequence that is responsive to signaling events initiated by HA oligosaccharides. No changes in responsiveness of the pHAS2(1932)-Luc to HA oligosaccharides was observed when the cells were cultured in the presence of chemical inhibitors of the MEK kinase (PD98059), p38 MAP kinase (SB203580) or NF-κB pathways (Helenalin, Figure 5B). For as yet unknown reasons, the presence of Helenalin enhanced the effect of HA oligosaccharides on pHAS2(1932)-Luc activity. On the other hand, both Wortmannin and LY294002 blocked the HAS-2 promoter-driven luciferase activity. This evidence further supports the previous experiments that inhibitors to PI3K pathway block the HA oligosaccharide-mediated stimulation of HAS-2. In data not shown, no changes in C-28/I2 cell viability were observed in cells treated with PD98059, SB203580, Wortmannin and LY294002 with or without co-incubation with HA oligosaccharides.
Figure 5. Effect of chemical inhibitors of signaling pathways on HA oligosaccharide-mediated stimulation of pHAS2(1932)-Luc activity in transfected C-28/I2 cells.

Panel A. Diagrammatic representation of HAS-2 promoter construct, pHAS2(1932)-Luc. The transcriptional site is located near the end of the 5-untranslated region (5′ UTR). The translational start site (AUG) is located at the start of exon 2. The coordinates for the promoter represent bp position relative to the transcriptional start site. Panel B. C-28/I2 cells were first transiently transfected with pHAS2(1932)-Luc, reduced to serum-free conditions and then preincubated with or without the chemical inhibitors, PD98059, SB203580, Helenalin, Wortmannin (Wort) or LY294002, 30 minutes prior to, and during the addition of 250 μg/ml HA oligosaccharides (+) under serum-free conditions. The cells were rinsed, solubilized with passive lysis buffer and analyzed for luciferase activity using a luminometer. Values represent the average relative luciferase units (RLU) ± S.D. of data derived from triplicate cultures normalized to total protein. Fold increases following HA oligosaccharide treatment, in control (no inhibitor), PD98059, SB203580 and Helenalin conditions represented significant increases above control; p= 0.0248, 0.0002, 0.0013 and 0.0008, respectively as measured using an unpaired Student’s t test.
DISCUSSION
Functional disarrangement of the pericellular cartilage matrix occurs during osteoarthritis including changes in aggrecan and collagens24. Previous studies by others have demonstrated the coordinate biosynthesis of hyaluronan and aggrecan by chondrocytes25. In this study, HA oligosaccharides were used as a tool to disrupt HA - CD44 interactions in order to elucidate the roles of these interactions in the maintenance of cartilage homeostasis. Thus, studying the chondrocyte responses to HA loss may shed light on our understanding of cellular events that are associated with the disease.
HA oligosaccharides are thought to disrupt the spatial clustering of CD44—a clustering that is organized through multivalent binding of high molecular mass HA to CD44 receptors26. Given that CD44 exhibits no intrinsic kinase or phosphatase activity 27 signal initiation is likely indirect, dependent on changes in CD44-associated cytoskeletal elements or other components in the cell cortex. For example, the time necessary to displace a cell-associated matrix from chondrocytes in culture with HA oligosaccharides is between 1–2 hours4. Previous studies in our laboratory have shown that the addition of HA oligosaccharides to intact cartilage slices initiates a cascade of events that result in the loss of safranin O stainable proteoglycan, an increase in NITEGE neoepitope within the tissue and, an increase in MMPs and nitric oxide released into the medium8,13–15. However, while the degradation of extracellular matrix was evident, enhanced incorporation of 35S-sulfate was observed. Similar HA oligosaccharide-initiated cascades were also observed in cultures of isolated human or bovine articular chondrocytes including a stimulation in MMP-3, MMP-13 and inducible-nitric oxide synthase mRNA, increases in ~45–50 kD caseinolytic activity and increased nitric oxide release13–15. Parallel with this stimulated expression of catabolic genes, the HA oligosaccharides also induced a stimulation in aggrecan, COMP, collagen type II and HAS-2 mRNA8, 9.
The question addressed in this study was whether the potential anabolic, “repair” response of HAS-2 stimulation in response to HA oligosaccharide treatment occurred subsequent to the HA oligosaccharide stimulation of catabolic gene products (e.g., MMPs and aggrecanases) or, whether HAS-2 stimulation was the result of the activation of a separate distinct pathway. Thus, given our previous data that HA oligosaccharide stimulation of both MMP-3 and MMP-13 mRNA in chondrocytes requires at least 12 hours of incubation15–16, while stimulation of HAS-2 occurs after 6 hours, it suggests that HAS-2 stimulation does not represent a downstream consequence of chondrolysis mediated by newly-synthesized MMPs. If the stimulation of HAS-2 were a downstream event that followed the stimulation of catabolic genes, blocking the pathways leading to the stimulation of MMP-3 and MMP-13 would have resulted in blocking the stimulation of HAS-2. The data outlined in this study suggest that this does not occur. The stimulation of HAS-2 involves the activation of the PI3K/Akt signaling pathway, separate and distinct from the pathways responsible for the stimulation of MMP-3 or MMP-1315. It remains to be determined if the PI3K/Akt pathway is involved in the activation of other matrix genes by HA oligosaccharides. Aggrecan upregulation by IGF-I is part of the PI3K/Akt pathway28. Additional details of the intracellular secondary messengers involved in HA oligosaccharide-initiated signaling remain to be more fully defined. Nonetheless, it is clear that some of the anabolic and catabolic responses by chondrocytes to HA oligosaccharides represent the activation of different signaling cascades. Such information offers hope that interventions could be designed that block the deleterious effects of damage/repair cycles while maintaining or even enhancing aspects of cartilage matrix repair.
Acknowledgments
This work was submitted as partial fulfillment of a Ph.D. degree for Ian J. Schmitz from the Department of Biochemistry, Graduate College of Rush University, Chicago, IL. The authors also thank Nadege Etienne, Hee-Jeong Im, Ph.D. and Richard, F. Loeser, Jr., M.D. for their technical assistance. The authors thank Dr. Mary Goldring of the Hospital for Special Surgery, New York for the C-28/I2 cells. Supported in part by NIH grants: RO1-AR43384 (WK), R01-AR39507 (CBK), P50-AR39239 and T32-AR0759 (Rush University Medical Center).
Footnotes
Publisher's Disclaimer: This is a PDF file of an unedited manuscript that has been accepted for publication. As a service to our customers we are providing this early version of the manuscript. The manuscript will undergo copyediting, typesetting, and review of the resulting proof before it is published in its final citable form. Please note that during the production process errors may be discovered which could affect the content, and all legal disclaimers that apply to the journal pertain.
References
- 1.Knudson W, Aguiar DJ, Hua Q, Knudson CB. CD44-anchored hyaluronan-rich pericellular matrices: An ultrastructural and biochemical analysis. Exp Cell Res. 1996;228:216–28. doi: 10.1006/excr.1996.0320. [DOI] [PubMed] [Google Scholar]
- 2.Evanko SP, Angello JC, Wight TN. Formation of hyaluronan- and versican-rich pericellular matrix is required for proliferation and migration of vascular smooth muscle cells. Arterioscler Thromb Vasc Biol. 1999;19:1004–13. doi: 10.1161/01.atv.19.4.1004. [DOI] [PubMed] [Google Scholar]
- 3.Ghatak S, Misra S, Toole BP. Hyaluronan oligosaccharides inhibit anchorage-independent growth of tumor cells by suppressing the phosphoinositide 3-kinase/Akt cell survival pathway. J Biol Chem. 2002;277:38013–20. doi: 10.1074/jbc.M202404200. [DOI] [PubMed] [Google Scholar]
- 4.Knudson CB. Hyaluronan receptor-directed assembly of chondrocyte pericellular matrix. J Cell Biol. 1993;120:825–34. doi: 10.1083/jcb.120.3.825. [DOI] [PMC free article] [PubMed] [Google Scholar]
- 5.Knudson W, Bartnik E, Knudson CB. Assembly of pericellular matrices by COS-7 cells transfected with CD44 homing receptor genes. Proc Natl Acad Sci USA. 1993;90:4003–7. doi: 10.1073/pnas.90.9.4003. [DOI] [PMC free article] [PubMed] [Google Scholar]
- 6.Zoltan-Jones A, Huang L, Ghatak S, Toole BP. Elevated hyaluronan production induces mesenchymal and transformed properties in epithelial cells. J Biol Chem. 2003;278:45801–10. doi: 10.1074/jbc.M308168200. [DOI] [PubMed] [Google Scholar]
- 7.Ward JA, Huang L, Guo H, Ghatak S, Toole BP. Perturbation of hyaluronan interactions inhibits malignant properties of glioma cells. Am J Pathol. 2003;162:1403–9. doi: 10.1016/S0002-9440(10)64273-3. [DOI] [PMC free article] [PubMed] [Google Scholar]
- 8.Knudson W, Casey B, Nishida Y, Eger W, Kuettner KE, Knudson CB. Hyaluronan oligosaccharides perturb cartilage matrix homeostasis and induce chondrogenic chondrolysis. Arthritis Rheum. 2000;43:1165–74. doi: 10.1002/1529-0131(200005)43:5<1165::AID-ANR27>3.0.CO;2-H. [DOI] [PubMed] [Google Scholar]
- 9.Ohno S, Im HJ, Knudson CB, Knudson W. Hyaluronan oligosaccharide-induced activation of transcription factors in bovine articular chondrocytes. Arthritis Rheum. 2005;52:800–9. doi: 10.1002/art.20937. [DOI] [PMC free article] [PubMed] [Google Scholar]
- 10.Knudson CB, Knudson W. Hyaluronan and CD44: modulators of chondrocyte metabolism. Clin Orthop. 2004;427:152–62. [PubMed] [Google Scholar]
- 11.Bastow E, Byers S, Golub S, Clarkin C, Pitsillides A, Fosang A. Hyaluronan synthesis and degradation in cartilage and bone. Cellular Mole Life Sci. 2008;65:395–413. doi: 10.1007/s00018-007-7360-z. [DOI] [PMC free article] [PubMed] [Google Scholar]
- 12.Fosang AJ, Rogerson FM, East CJ, Stanton H. ADAMTS-5: the story so far. Eur Cell Mater. 2008;15:11–26. doi: 10.22203/ecm.v015a02. [DOI] [PubMed] [Google Scholar]
- 13.Iacob S, Knudson CB. Hyaluronan fragments activate nitric oxide synthase and the production of nitric oxide by articular chondrocytes. Int J Biochem Cell Biol. 2006;38:123–33. doi: 10.1016/j.biocel.2005.08.011. [DOI] [PMC free article] [PubMed] [Google Scholar]
- 14.Ohno S, Ohno-Nakahara M, Knudson CB, Knudson W. Induction of MMP-3 by hyaluronan oligosaccharides in temporomandibular joint chondrocytes. J Dental Res. 2005;84:1005–9. doi: 10.1177/154405910508401107. [DOI] [PubMed] [Google Scholar]
- 15.Ohno S, Im HJ, Knudson CB, Knudson W. Hyaluronan oligosaccharides induce matrix metalloproteinase 13 via transcriptional activation of NFkappaB and p38 MAP kinase in articular chondrocytes. J Biol Chem. 2006;281:17952–60. doi: 10.1074/jbc.M602750200. [DOI] [PMC free article] [PubMed] [Google Scholar]
- 16.Nishida N, Knudson CB, Knudson W. Extracellular matrix recovery by human articular chondrocytes after treatment with hyaluronan hexasaccharides or Streptomyces hyaluronidase. Modern Rheumatology. 2003;13:62–8. doi: 10.3109/s101650300009. [DOI] [PubMed] [Google Scholar]
- 17.Nishida Y, Knudson CB, Kuettner KE, Knudson W. Osteogenic protein-1 promotes the synthesis and retention of extracellular matrix within bovine articular cartilage and chondrocyte cultures. Osteoarthritis Cartilage. 2000;8:127–36. doi: 10.1053/joca.1999.0281. [DOI] [PubMed] [Google Scholar]
- 18.Knudson W, Gundlach MW, Schmid TM, Conrad HE. Selective hydrolysis of chondroitin sulfates by hyaluronidase. Biochem. 1984;23:368–75. doi: 10.1021/bi00297a028. [DOI] [PubMed] [Google Scholar]
- 19.Rasmussen TB, Uttenthal A, de Stricker K, Belak S, Storgaard T. Development of a novel quantitative real-time RT-PCR assay for the simultaneous detection of all serotypes of foot-and-mouth disease virus. Arch Virol. 2003;148:2005–21. doi: 10.1007/s00705-003-0145-2. [DOI] [PubMed] [Google Scholar]
- 20.Pfaffl MW. A new mathematical model for relative quantification in real-time RT-PCR. Nucleic Acids Res. 2001;29:e45. doi: 10.1093/nar/29.9.e45. [DOI] [PMC free article] [PubMed] [Google Scholar]
- 21.Monslow J, Williams J, Guy C, et al. Identification and analysis of the promoter region of the human hyaluronan synthase 2 gene. J Biol Chem. 2004;279:20576–81. doi: 10.1074/jbc.M312666200. [DOI] [PubMed] [Google Scholar]
- 22.Turley EA, Noble PW, Bourguignon LY. Signaling properties of hyaluronan receptors. J Biol Chem. 2002;277:4589–92. doi: 10.1074/jbc.R100038200. [DOI] [PubMed] [Google Scholar]
- 23.Li R, Wong N, Jabali MD, Johnson P. CD44-initiated cell spreading induces Pyk2 phosphorylation, is mediated by Src family kinases, and is negatively regulated by CD45. J Biol Chem. 2001;276:28767–73. doi: 10.1074/jbc.M100158200. [DOI] [PubMed] [Google Scholar]
- 24.Aigner T, Soder S, Gebhard PM, McAlinden A, Haag J. Mechanisms of Disease: role of chondrocytes in the pathogenesis of osteoarthritis--structure, chaos and senescence. Nature Clinical Practice Rheumatology. 2007;3:391–9. doi: 10.1038/ncprheum0534. [DOI] [PubMed] [Google Scholar]
- 25.Morales TI, Hascall VC. Correlated metabolism of proteoglycans and hyaluronic acid in bovine cartilage organ cultures. J Biol Chem. 1988;263:3632–8. [PubMed] [Google Scholar]
- 26.Underhill CB, Chi-Rosso G, Toole BP. Effect of detergent solubilization on the hyaluronanate-binding protein from membranes of Simian virus 40-transformed 3T3 cells. J Biol Chem. 1983;258:8086–91. [PubMed] [Google Scholar]
- 27.Ponta H, Sherman L, Herrlich P. CD44: From adhesion molecules to signaling regulators. Nature Rev Mol Cell Biol. 2003;4:33–45. doi: 10.1038/nrm1004. [DOI] [PubMed] [Google Scholar]
- 28.Starkman BG, Cravero JD, Delcarlo M, Loeser RF. IGF-I stimulation of proteoglycan synthesis by chondrocytes requires activation of the PI 3-kinase pathway but not ERK MAPK. Biochem J. 2005;389:723–9. doi: 10.1042/BJ20041636. [DOI] [PMC free article] [PubMed] [Google Scholar]