

Abstract
A potential relationship between structural compartments in neural tissue and NMR parameters may increase the specificity of MRI in diagnosing diseases. Nevertheless, our understanding of MR of nerves and white matter is limited, particularly the influence of various water compartments on the MR signal is not known. In this study, components of the 1H transverse relaxation decay curve in frog peripheral nerve were correlated with the diffusion characteristics of the water in the nerve. Three T2 values were identified with nerve. Water mobility was found to be unrestricted on the timescale of 100 msec in the component of the signal with the intermediate T2 time, suggesting some contribution from the interstitial space to this T2 component. Restricted diffusion was observed in the component with the longest T2 time, supporting the assignment of at least part of the spins contributing to this component to an intracellular compartment. The observed nonexponential behavior of the diffusion attenuation curves was investigated and shown to be potentially caused by the wide range of axon sizes in the nerve.
Keywords: neural tissue, edema, white matter, anisotropic diffusion, water exchange
The compartmental structure of biological tissues can be related to certain physical NMR parameters. Where the exchange of water between structural compartments within an imaging voxel is slow on the NMR timescale, NMR parameters will show a superposition of values. For example, the existence of multiexponential transverse relaxation decay curves in some biological tissues is often assumed to be an indicator of compartmentation. Water diffusion is an innately more suitable NMR-detectable entity than transverse relaxation for delineating compartments because of its sensitivity to spatial boundaries. In this paper we describe measurements of the cross-sectional water mobility of spin populations that are characterized by different transverse relaxation decay times (T2) in bullfrog peripheral nerve. Because diffusion of water directly relates to the characteristic length scales that exist in tissue, the shapes and time dependencies of the diffusion attenuation curves are used to associate T2 components with structural compartments.
T2 AND COMPARTMENTATION IN NEURAL TISSUE
We base our work here on the existence of a multiexponential T2 decay curve measured from frog sciatic nerve. The T2 decay curve from frog sciatic nerve in vitro was first decomposed into multiple exponentials by Vasilescu et al. (1). The following values for T2 of the nerves were found: 17 ± 6 msec, 70 ± 14 msec, and 310 ± 21 msec with relative proportional representation of 29%, 50%, and 21%. These results were compared with those for the time-dependent D2O fraction found in the nerve during H2O–D2O diffusion-mediated exchange described in a previous paper by some of the same authors (2). The close correspondence between the population percentages in both experiments suggested the following structural assignments of the T2 components: the short T2 component was attributed to nonexchanging water closely associated with proteins and phospholipids, the intermediate T2 component to axoplasmic water, and the long T2 component to extracellular water. Does and Snyder later found similar values for the relaxation times in frog sciatic nerves in vivo (3). Recently Does et al. studied the association of T1 relaxation and MT characteristics to T2 components of frog sciatic nerve (4). They found three T2 components, each exhibiting unique T1 and MT characteristics. The assignment of the short, intermediate, and long-lived T2 components to myelinic, axonal, and interaxonal water, respectively, was assumed. T1 increased with T2. The two shorter lived T2 components exhibited a significantly greater magnetization transfer ratio than the long-lived component. This finding was used to support the assumed compartmental assignment, because the inter-axonal water is expected to have a lower macromolecule to water concentration.
Jolesz et al. found a lengthening of T2 in rat sciatic nerves after Wallerian degeneration (5), and were able to distinguish between the NMR relaxation in myelinated and nonmyelinated nerves from a garfish (6). The results suggested that the component with the shortest relaxation time may be water associated with the myelin membranes and that myelin limits the rate of exchange between the intra- and extra-axonal compartments. Others have shown that the disappearance of three well-resolved T2 components in toad sciatic nerves correlated with the loss of myelin after injury (7). The assignment of the short T2 to myelin-associated water has been used for imaging myelin (8,9).
In the crayfish abdominal nerve cord, which is myelinated, three populations of spins contributing to triexponential T2 decay curves have been identified. After comparison with compartmental water volumes, as estimated from optical and electron microscopic cross-sections (10), the T2 components were associated with structural compartments. A T2-weighted magnetic resonance (MR) microscopy image of the nerve cord revealed hypointensity of regions corresponding to the location of the giant axons in the nerve trunk (diameter ~200 μm) compared to the regions including much smaller axons, connective tissue and extracellular space. Thus, if the interpretation of the microscopy image was correct, this finding supports the assignment of the longest T2 component to a compartment other than the axonal cytoplasm in giant axons.
In summary, evidence exists to relate the different T2 times in nervous tissue to different structural compartments. Extracellular water is assumed to contain a lower concentration of macromolecules and thus has a longer characteristic transverse relaxation time than intracellular water. We note, however, that transverse relaxation may reflect only the influence of a very small number of binding sites, giving limited information about the rotational mobility of most of the water molecules in any compartment (11).
Another method for compartmental discrimination has recently been developed by Shinar et al. using 2H double-quantum filtering (12). Whereas here we observe long spatial scales, these authors investigate variations in T2 locally by long-time preferential order.
DIFFUSION AND COMPARTMENTATION
Although the spatial resolution of MR imaging is too gross, and the actual values of T2 in tissue represent information from too small a length scale, the length scales of diffusion in tissue are appropriate for determining the spin dynamics on a cellular level. The use of restricted diffusion measurements to elucidate the structural dimensions of compartments too small to image has been described by Cory and Garroway (13) and by Callaghan (14). Restricted diffusion due to barriers in tissue would manifest in the dependence of the apparent diffusion coefficient on the diffusing time, and possibly on the gradient strength. In most neural tissue, water diffusion is anisotropic, leading to the conclusion that the mobility of the water is restricted in directions perpendicular to the axonal axis of symmetry. Myelination is not the only reason for diffusion anisotropy in nervous tissue, as shown in studies of nonmyelinated garfish olfactory nerves (15) and in brains of neonates before the histological appearance of myelin (16,17), but myelin is widely assumed to be the major barrier to diffusion in myelinated fiber tracts, mainly because of the high diffusion anisotropy in mature white matter (see, e.g., Peled et al. (18)). Additional justification for regarding the myelin sheath as a relatively impermeable barrier comes from work by Kirschner et al., who found that the time constant for deuterium-hydrogen exchange in rabbit sciatic nerve myelin was 12 min, as measured by neutron diffraction (19).
Studies by Anderson et al. showed that the apparent diffusion coefficient (ADC) in rat optic nerve increases when the extracellular volume increases and vice versa (20). Various models exist for water diffusion in tissues from which membrane permeability surface-to-volume ratios have been estimated (21–23). The models do not take into account the distribution of cell sizes in biological tissue or the added information about compartmentation provided by T2 measurements.
T2 AND DIFFUSION
This report describes our attempts to define the relation between local and spatial mobility in biological samples by correlating diffusion and T2; preliminary results using the method described here were presented in Ref. 24. Recently, a number of other investigators have followed a similar path (25–29).
Knauss et al. found that the local mobility of particles did not necessarily correspond to their spatial mobility in two water fractions in hydrated collagen II (25). Diffusion was measured by using a pulsed-gradient stimulated echo sequence preceded by a Hahn spin echo. The spin echo time was varied to produce diffusion attenuation curves with different T2 weightings. The contribution of the rapidly diffusing water to the signal decreased with increasing T2. It was concluded that the rotationally “free” water was confined to channels formed by the holes between collagen molecules and was thus spatially restricted. In excised lung tissue, Laicher et al., using a 13-interval stimulated echo sequence followed by a Carr-Purrell-Meiboom-Gill (CPMG) experiment, qualitatively matched the appearance of more rapid decay in the CPMG with the application of stronger diffusion gradients (26). Van Duss-choten et al. proposed a pulse sequence consisting of a CPMG imaging sequence incorporating pulsed field gradients around the first refocussing pulse (27). The T2 information from the CPMG experiment was used to define two populations of spins in order to fit to each one a diffusion constant. Cerebrospinal fluid was discriminated from brain tissue in a cat by using the differences in both T2 and D. Stanisz and Henkelman investigated bovine optic nerve with a hybrid diffusion-CPMG sequence and found two T2 components with different diffusional characteristics (28). The long T2 component exhibited diffusion anisotropy and ADCs inversely dependent on diffusion time, while the short T2 component exhibited less of both these phenomena. Another approach to correlating T2 and diffusion was used by Beaulieu et al., who measured the ADC of garfish myelinated and nonmyelinated nerves after preparation with a CPMG sequence (29). The diffusion coefficients corresponding to different echo train times were found, implying a rough T2 dependency of the ADCs. The minimum echo time was 70 msec, and the diffusing time was in all cases 30 msec. The authors measure five points on the diffusion curve to which a linear fit yielded a value for ADC. The ADCs were found to be independent of echo time using these timing parameters.
MATERIALS AND METHODS
Hardware
The NMR equipment consisted of a vertical-bore 2.35-T magnet with the RF and gradient coils controlled by a Bruker console. The maximum gradient strength was approximately 460 G/cm over a sample size of 2.2 mm. The duration of the π pulse was set to 3 μsec. The gradients were calibrated on a water sample in which the diffusion constant was assumed to be 2.3 μm2/msec at room temperature. Gradient mismatch was tested for by using the maximum gradients on a sample of cross-linked cis-polybutadiene. Because the protons do not diffuse in this sample, no signal attenuation was expected or found after application of a pulsed-gradient diffusion sequence.
Sample Preparation
The bullfrog sciatic nerve trunk is about 1 mm in diameter and contains both myelinated and nonmyelinated fibers ranging in radius between 0.5–10 μm (30). The relatively large number of nonmyelinated fibers contribute very little to the total volume because of their smaller size. The extracellular space (endoneurium) contains endoneural collagen I. The myelin sheath consists of the membranes and cytoplasm of Schwann cells that spiral around the axons up to 100 times. The total width of the myelin sheath is typically up to one-half of the radius of the axon it encloses.
One large bullfrog that had been kept at 4°C was decapitated and pithed, and both sciatic nerves dissected from the spinal cord to the knee. The nerves were cleaned of blood and fat under a dissecting microscope but not desheathed. Each nerve was cut into two 4-cm-long sections, giving four samples. The ends were tied with silk thread, placed in frog Ringer’s solution (31), and while awaiting measurement, stored at 4°C. For the NMR measurement, the samples were pulled into a 2.2 inner diameter NMR tube with Ringer’s and the ends of the tube were sealed with clay. The orientation of the nerve in the magnet was perpendicular to the field.
The experiments commenced 12 hours after dissection and lasted four hours for each nerve sample. The first sample measured was measured again at the end of the sequence of experiments to see if time from dissection had any effect on the results. The sequence of acquisition for this sample was reversed as well to check dependence on time in the tube. Neither condition qualitatively affected the result. Bullfrog sciatic nerves with intact sheaths remain capable of impulse conduction for two to three weeks after dissection if kept refrigerated (see (32)), which implies that the structure did not change significantly during the time it took to perform all the measurements.
Pulse Sequence
Transverse relaxation decay curves were recorded with a pulse sequence based on the CPMG method, preceded by diffusion weighting. The echo spacing was 0.5 msec with one data point being acquired at the center of every even echo, resulting in 8192 data points measured over 8.2 sec. The pulse sequence correlates the diffusion behavior with T2 via a pulsed gradient–stimulated echo (PGSTE) immediately detected by a CPMG sequence as shown in Fig. 1. This type of sequence was also recently suggested in Ref. 26 and tested in rat lung. Here we look only at cross-sectional diffusion, because of technical constraints and the lack of compartmentalization in the longitudinal direction.
FIG. 1.

Pulse Sequence: PGSTE-CPMG. Dashed lines indicate continuation of the sequence for a total of 8192 π pulses. g, pulsed gradients; c, “crusher” gradient.
The PGSTE-CPMG data were acquired for four different diffusing times, Δ, to evaluate restriction, specifically Δ = 6.1, 10.8, 30.55, and 100.4 msec. A crusher gradient ensured complete dephasing of transverse signal during the diffusing delay, Δ. The pulsed gradient duration, δ, in the PGSTE-CPMG sequence was chosen so as to give approximately the same maximum b factor of ~20 msec/μm2 for each of the values of Δ, and was in all cases less than 2 msec. (The b factor is defined by b = (γgδ)2(Δ − δ/3), where γ is the gyromagnetic ratio and g is the pulsed gradient strength). Data were collected for 30 b factors for each diffusing time, Δ, by stepping the gradient strength. Both sequences include phase cycling with two averages.
For one sample, longitudinal and transverse relaxation were correlated using a saturation recovery sequence followed by a CPMG. Data from 42 time delays, logarithmically spaced between 2 msec and 20.5 sec, were collected. English et al. have used a similar principle with inversion recovery, subtracting from a baseline CPMG to fulfill the requirement for non-negativity (see next section) (33). We used saturation recovery here to prevent any negative contributions to the decay curve and to save time.
Data Analysis
The multiexponential CPMG curves obtained in the experiment were fit using the Nonnegative least squares (NNLS) method as first implemented in the context of NMR relaxation by Whittall (34) from an algorithm by Lawson and Hanson (35). Two hundred and eighty six logarithmically spaced time points between 1 msec and 4 sec were chosen to discretely cover all the possible T2 times in the sample. All the transverse relaxation decay curves were fit in a least-squares sense to these exponents, with smoothing of the resulting “relaxogram” incorporated into the fitting algorithm. The method has been widely tested and is now commonly used for analyzing multiexponential relaxation, but, as is well known, T2 values that are closely spaced cannot be well separated. The average NNLS-fitted T2 values for a sample were chosen from the peaks created by adding all the relaxograms of the sample, thus reducing the sensitivity to individual aberrations. This analysis method relies on the fact that the apparent relaxation rates do not depend on the initial conditions and thus should be independent of any spin manipulation before the CPMG pulse train. The decay curves from each specimen were then force-fit to multiexponential functions in which the average T2 values found for that specimen were fixed. Information about the diffusion and T1 of the population of spins whose T2 was given by each of the averaged T2 values was provided by the amplitudes of the forced fit.
RESULTS
The signal-to-noise ratio of the transverse relaxation decay curves obtained was approximately 20,000. Figure 2a shows all the relaxograms for one of the samples. The sum of relaxograms in Fig. 2a is shown in Fig. 2b. Roman numerals II to IV designate the values of T2 around which most of the measurable spin populations in the nerve appear to concentrate. The existence or location of peak I cannot be accurately determined because the sampling rate in the CPMG was not high enough. Peak V corresponds to the buffer solution. Peak V′ does not appear in all the samples and, according to its corresponding T1 time (see below), also originates in the buffer solution. Table 1 summarizes the T2 values and population fractions and the similar values found for T2 in frog sciatic nerve by other groups. All further discussion of the results alludes to the population fractions found from the forced fit of the decay curves to the characteristic T2 values as described in the previous section.
FIG. 2.

NNLS decomposition of transverse relaxation decay curves for a nerve specimen. a: All the NNLS decompositions for one nerve sample. b: Sum of curves in a.
Table 1.
Average Frog Sciatic Nerve T2 Values at 2.35 T and Relative Populations After Forced Fit for All Samples and Comparison With Literature Values at 3 T (4) and 1 T (1)
From the saturation recovery T1 measurement, we found that 94% of the tissue water signal had a T1 time greater than 1.3 sec, with 6% of the signal exhibiting T1 of 420 msec. This means that the effect of varying Δ in the stimulated echo sequence was minimally dependent on T1. The fitted value of T1 of the component labeled V′ in Fig. 2 was similar to that of the component labeled V (~3 sec), so both components V′ and V were assumed to originate in the bathing solution.
Diffusion According to T2 Components
Once the original CPMG curves had been fitted to the characteristic T2 values of the sample, new decay curves were obtained from the amplitudes corresponding to each one of the T2 values. Figure 3 show the diffusion attenuation curves for one of the samples for each T2 component. The data from the different diffusing times, Δ, are represented by different symbols. The curves corresponding to the shortest mixing time (Δ ~5 msec) for all the T2 components show an unphysical tail that may result from slight movement of the nerve because of an instability in the system when very short, high-power gradient pulses are used. Each T2 component has a strikingly individual diffusion signature. The results are qualitatively the same for all four nerve samples.
FIG. 3.

Normalized diffusion attenuation from T2 components of the NMR signal from a nerve sample. a: Component II, T2 = 19 msec. b: Component III, T2 = 78 msec and biexponential fit to data corresponding to Δ = 100.4 msec (see text). c: Component IV, T2 = 300 msec. d: Component V, T2 = 1,500 msec. ●, Δ = 100.4 msec; ×, Δ = 30.55 msec; ○, Δ = 10.8 msec; +, Δ = 6.1 msec.
The longest relaxation component (V with T2 ≃ 1500 msec shown in Fig. 3d) indeed appears to correspond to the buffer, because the fitted diffusion constants are high. However, the measured diffusion from this component does decrease with increasing Δ from 2.6 to 1.8 μm2/msec, possibly indicating restriction. The data from the intermediate T2 component of the CPMG (III with T2 ≃ 78 msec shown in Fig. 3b) exhibit no significant restriction over the time scales measured. The data corresponding to Δ ≃ 100 msec can be fitted very well by the biexponential function: E = 0.8e−0.95b + 0.2e−0.1b (fitted curve shown in Fig. 3b). A biexponential analysis implies that 40% (0.8 × 50% See Table 1) of the NMR-visible water in the nerve is diffusing in an unrestricted manner on the time scale of 100 msec at a rate of approximately 0.95 μm2/msec. When the data were fit to a biexponential in which one of the decay rates was constrained to be 0.8 μm2/msec, the value of χ2 increased by a factor of 5. The one-dimensional mean displacement in 100 msec with D = 0.95 μm2/msec is approximately 14 μm, which is a larger distance than the diameter of the majority of axons. This implies that either the signal from this T2 component is not from the intra-axonal space, or if it is, that there is no effective compartmentation in the nerve.
The long T2 component (IV with T2 ≃ 300 msec shown in Fig. 3c) shows dependence of the diffusion attenuation curves on the diffusing time, Δ, a clear indication that diffusion is restricted. None of the curves describing the diffusion attenuation corresponding to T2 times in nerves shows monoexponential behavior. This could be the result of multiple water fractions possessing similar values of T2 or, for situations in which the diffusion shows effects of restriction, the geometry of the underlying structure may prescribe the shape of the diffusion attenuation curve. The next section explores this point.
DISCUSSION
Model of Restricted Diffusion
If the restricted diffusion behavior observed in Fig. 3 is tied to compartmentation, then the distribution of fiber diameters must be included in any analysis of the shape of the diffusion attenuation curves. The histogram in Fig. 4 shows the volume percent of intra-axonal space represented by each cross-sectional size of fiber in a bullfrog sciatic nerve, plotted from data presented in (30). The exact distribution of fiber diameters in the frog nerve, which depends on the location of the cross section along the nerve, is less important than the range of dimensions. In the white matter of the brain the axons are in general smaller and more tightly packed but, as shown for example in the case of the corpus callosum, they can also exhibit a wide range of sizes (36).
FIG. 4.
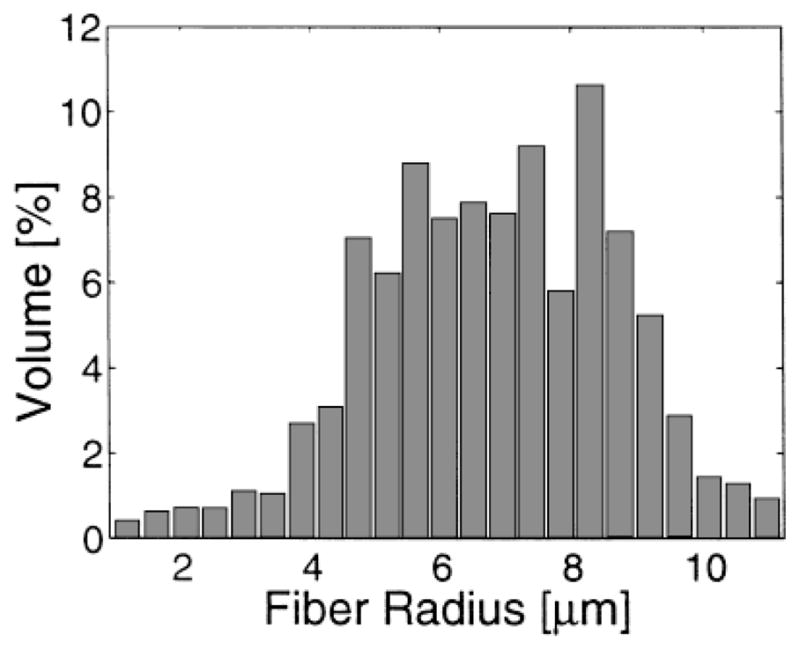
Volume percent of intracellular space versus axonal radius in bullfrog sciatic nerve, replotted from data giving axon number versus axon diameter in Ref. 30 and assuming cylindrical axons.
If we can model the intra-axonal space as a collection of parallel solid cylinders, the solution for diffusion attenuation in cylindrical pores has been calculated by Callaghan (37):
| [1] |
for reflecting boundaries, where a is the cylinder radius, J′n represents the derivative of the nth order Bessel function, and βnk are the zero crossings of these functions.
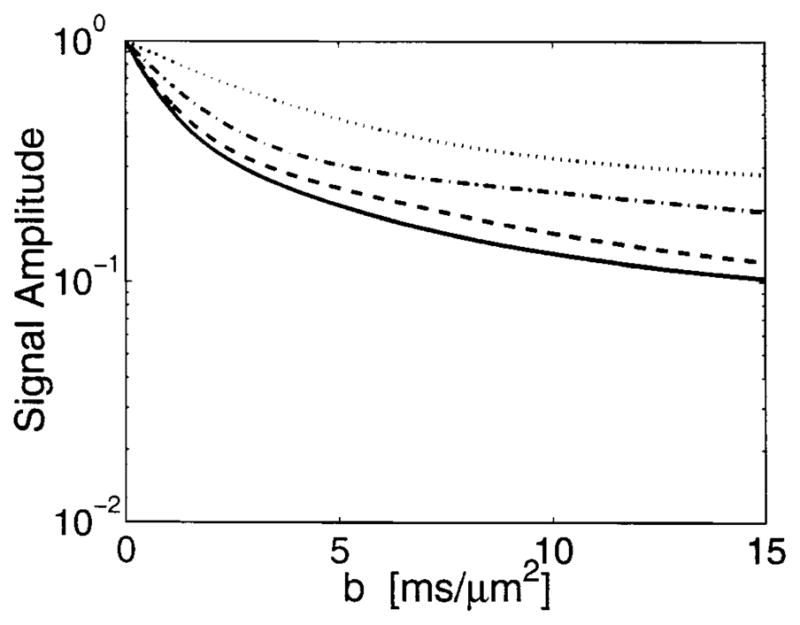
The only free parameters in Eq. [1] are a, the cylinder radius, and the diffusion constant, D. Figure 5 shows the diffusion attenuation curves based on Eq. [1] for the diffusion times, Δ, as shown in Fig. 3. In Fig. 5a, the cylinder radius is chosen to be 5 μm and the diffusion constant used in these simulations is 2.3 μm2/msec. Once we constrain the solution by summing over the axonal radii and relative populations from the histogram in Fig. 4, the curves look “biexponential” as shown in Fig. 5b. The curves in Fig. 5b qualitatively resemble the data from the long T2 component of the signal from nerves, shown in Fig. 3c.
FIG. 5.

Theoretical diffusion attenuation in cylindrical pores using D = 2.3 μm2/msec. Key: diffusing times Δ = 6.1 (—), 10.8 (– – –), 30.55 (· – · – ·) and 100.4 msec (· · · · ·). a: Cylindrical pores of radius 5 μm. b: Distribution of cylinder pore radii according to Fig. 4.
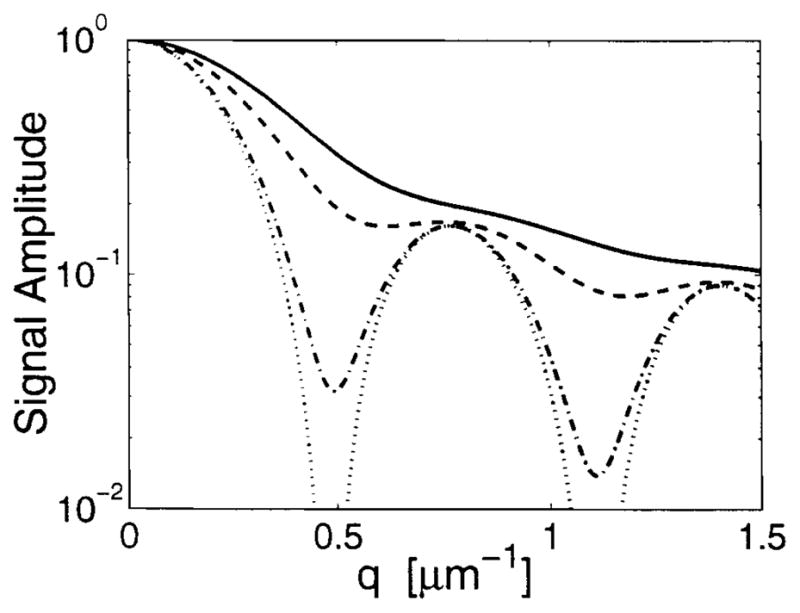
Similarly, a model of the myelin membranes as a series of impermeable (on the timescale of milliseconds) concentric cylinders could account for the restriction observed in the short T2 component in Fig. 3a. A calculation of the diffusion attenuation in annular cylindrical geometry expected from a PGSTE experiment is given in the Appendix. The previous results pertaining to the effect of a range of cylinder sizes on the shape of the diffusion attenuation curve also, not surprisingly, obtain for diffusion in annular geometry. Figure 6 shows a simple sum over the response given in the Appendix. The data from the short T2 component of the nerve show significantly less flattening than the model predicts at large values of b, which could be accounted for in the model by including a permeability between myelin layers.
FIG. 6.
Theoretical diffusion attenuation from a distribution of annular rings with radii according to Fig. 4 and assuming a myelin sheath width of one-third the axon radius. D = 2.3 μm2/msec. Key: diffusing times Δ = 6.1 (—), 10.8 (– – –), 30.55 (· – · – ·) and 100.4 msec (· · · · ·).
Compartmentalization
Compartmental assignment through NMR is the first step toward tissue characterization and diagnostic discrimination between different cellular mechanisms of disease. The possible clinical applications in nervous tissue include characterization of various types of edema (vasogenic, cytotoxic, etc.). The clear existence of multiple T2 times with individual diffusive characteristics in an amphibian peripheral nerve strongly supports some type of structural compartmentation. Observation of three distinct components implies the existence of three physically separable populations with each population representing one or more true pools of spins. The shortest tissue T2 component shows some restriction. The component with the intermediate T2 shows relatively high and unrestricted diffusion on a timescale of 100 msec, which is compatible with an extracellular space since otherwise compartmentation would not be maintained. The length scale of the measurement depends on the diffusion constant, which in this case clearly is not single-valued. The neural component with the longest T2 has qualitatively similar transverse ADC characteristics to the long T2 component (assumed to be intra-axonal) of bovine optic nerve described by Stanisz and Henkelman (28) in that the ADC is low and decreases for longer diffusing times. In the case of frog sciatic nerve, this component exhibits the most restricted diffusion and is thus consistent with water in an intracellular space, most likely axonal. A cause of faster relaxation in the endoneurium compared to the intra-axonal space may be the abundance of collagen I. Collagen is a relaxing factor in tendons, and studies have shown that tumors that are relatively acellular and have more collagen exhibit a shorter T2 than tumors with an otherwise similar histological composition (38).
The extent of exchange between the compartments has not been quantified. The measured T2 values could be shifted from their true values by exchange processes, but the values do not themselves play a role in the compartmental analysis. We have modeled a recently proposed two-dimensional method for determining exchange between populations characterized by different T2 times (ART-DECO, Ref. 39), and attempted to extract the exchange times from experiments (40). We saw clear cross-peaks but could not calculate meaningful bounds on exchange times from the data.
CONCLUSION
We found unique signatures of the diffusion for each T2 component of the transverse relaxation decay curve in frog sciatic nerve. This not only supports the existence of distinct populations with slow exchange between them on the time scale of the T2 times, but also provides information about whether the spin populations are spatially confined on these time scales. Any consistent picture of heterogeneous spin dynamics in neural tissue will have to include findings such as these correlating local and spatial mobility. We found that the population with the T2 time of 300 msec exhibits marked restriction while the population with the T2 time of 78 msec shows no restriction. This suggests that spins that are extracellular and unbounded have a longer T2 than those located in intracellular compartments in this tissue. We have shown how a simple model of bounded diffusion with one free parameter (D) can approximate the shape of a time-dependent, nonmonoexponential diffusion attenuation curve by taking into account pore size variability.
Acknowledgments
We thank Robert Mulkern for insightful comments, Yuan Cheng for the use of his RF and gradient coils, and Yuan and Xiaowu Tang for their technical help.
APPENDIX: PGSTE DIFFUSION ATTENUATION IN ANNULAR CYLINDRICAL GEOMETRY
The spatial (angular) displacement probability in an annulus of radius r is given by the Gaussian function, assuming a pseudo–one-dimensional geometry:
| [2] |
where σ2 = 2Dt is the average squared displacement in time t with diffusion rate D. With the spin density normalized to 1/2πr, the diffusion attenuation in a ring of radius a after diffusion time Δ is given by
| [3] |
Making the substitution ψ = θ′ − θ (the probability of angular displacement is not conditional on starting position) and adding limits to the integration:
| [4] |
with q = γδgx (assuming that the gradient is in the x direction). By using the following expansion in terms of Bessel functions:
| [5] |
Eq. [4] reduces to:
| [6] |
The diffusion attenuation from Eq. [6] is plotted in Fig. 7. Note that the x axis in this case is q, the spatial frequency, and not b as in Fig. 3a and b.
FIG. 7.
Theoretical diffusion attenuation in annular cylindrical pores of radius a = 5 μm using D = 2.3 μm2/msec. Diffusing times Δ = 6.1 (—), 10.8 (– – –), 30.55 (· – · – ·) and 100.4 msec (· · · · ·).
References
- 1.Vasilescu V, Katona E, Simplăceanu V, Demco D. Water compartments in the myelinated nerve. III. Pulsed NMR results. Experientia. 1977;34:1443–1444. doi: 10.1007/BF01932339. [DOI] [PubMed] [Google Scholar]
- 2.Vasilescu V, Mărgineanu DG, Katona E. Heavy water intake in tissues. II. H2O–D2O exchange in the myelinated nerve of the frog. Experientia. 1977;33:192–194. doi: 10.1007/BF02124060. [DOI] [PubMed] [Google Scholar]
- 3.Does MD, Snyder RE. T2 relaxation of peripheral nerve measured in vivo. Magn Reson Imag. 1995;13:575–580. doi: 10.1016/0730-725x(94)00138-s. [DOI] [PubMed] [Google Scholar]
- 4.Does MD, Beaulieu C, Allen PS, Snyder RE. Multi-component T1 relaxation and magnetization transfer in peripheral nerve. Magn Reson Imag. 1998;16(9):1033–1041. doi: 10.1016/s0730-725x(98)00139-8. [DOI] [PubMed] [Google Scholar]
- 5.Jolesz FA, Polak JF, Ruenzel PW, Adams DF. Wallerian degeneration demonstrated by magnetic resonance: spectroscopic measurements on peripheral nerve. Radiology. 1984;152:85–87. doi: 10.1148/radiology.152.1.6729140. [DOI] [PubMed] [Google Scholar]
- 6.Jolesz FA, Polak JF, Adams DF, Ruenzel PW. Myelinated and nonmyelinated nerves: comparison of proton MR properties. Radiology. 1987;164:89–91. doi: 10.1148/radiology.164.1.3035608. [DOI] [PubMed] [Google Scholar]
- 7.Does MD, Snyder RE. Multiexponential T2 relaxation in degenerating peripheral nerve. Magn Reson Med. 1996;35:207–213. doi: 10.1002/mrm.1910350212. [DOI] [PubMed] [Google Scholar]
- 8.MacKay AL, Whittall KP, Adler J, Li DKP, Paty DW, Graeb DA. In-vivo visualization of myelin water in brain by magnetic resonance. Magn Reson Med. 1994;31:673–677. doi: 10.1002/mrm.1910310614. [DOI] [PubMed] [Google Scholar]
- 9.Whittall KP, MacKay AL, Graeb DA, Nugent RA, Li DKB, Paty DW. In vivo measurement of T2 distributions and water contents in normal human brain. Magn Reson Med. 1997;37:34–43. doi: 10.1002/mrm.1910370107. [DOI] [PubMed] [Google Scholar]
- 10.Menon RS, Rusinko MS, Allen PS. Proton relaxation studies of water compartmentalization in a model neurological system. Magn Reson Med. 1992;28:264–274. doi: 10.1002/mrm.1910280208. [DOI] [PubMed] [Google Scholar]
- 11.Foster KR, Resing HA, Garroway AN. Bounds on “bound water”: transverse nuclear magnetic resonance relaxation in barnacle muscle. Science. 1976;194:324–326. doi: 10.1126/science.968484. [DOI] [PubMed] [Google Scholar]
- 12.Shinar H, Seo Y, Navon G. Discrimination between different compartments in sciatic nerve by 2H double-quantum filtered NMR. J Magn Reson. 1997;129:98–104. doi: 10.1006/jmre.1997.1250. [DOI] [PubMed] [Google Scholar]
- 13.Cory DG, Garroway AN. Measurement of translational displacement probabilities of NMR: an indicator of compartmentation. Magn Reson Med. 1990;14:435–444. doi: 10.1002/mrm.1910140303. [DOI] [PubMed] [Google Scholar]
- 14.Callaghan PT. Pulsed field nuclear magnetic resonance as a probe of liquid state molecular organization. Aust J Phys. 1984;37:359–87. [Google Scholar]
- 15.Beaulieu C, Allen PS. Determinants of anisotropic water diffusion in nerves. Magn Reson Med. 1994;31:394–400. doi: 10.1002/mrm.1910310408. [DOI] [PubMed] [Google Scholar]
- 16.Wimberger DM, Roberts TP, Barkovich AJ, Prayer LM, Moseley ME, Kucharczyk J. Identification of “premyelination” by diffusion-weighted MRI. J Comput Assist Tomogr. 1995;19(1):28–33. doi: 10.1097/00004728-199501000-00005. [DOI] [PubMed] [Google Scholar]
- 17.Hüppi PS, Peled S, Zientara GP, Maier SE, Gudbjartsson H, Jolesz FA. Microstructural development of the human newborn brain assessed in vivo by diffusion tensor MRI. Proceedings of the ISMRM 5th Annual Meeting; Vancouver. 1997. p. 77. [Google Scholar]
- 18.Peled S, Gudbjartsson H, Westin C-F, Kikinis R, Jolesz FA. Magnetic resonance imaging shows orientation and asymmetry of white matter fiber tracts. Brain Res. 1998;780:27–33. doi: 10.1016/s0006-8993(97)00635-5. [DOI] [PubMed] [Google Scholar]
- 19.Kirschner DA, Caspar DLD, Schoenborn BP, Nunes AC. Neutron diffraction studies of nerve myelin. Brookhaven Symp Biol. 1975;27:III–68. [PubMed] [Google Scholar]
- 20.Anderson AW, Zhong J, Petroff OAC, Szafer A, Ransom BR, Prichard JW, Gore JC. Effects of osmotically driven cell volume changes on diffusion-weighted imaging of the rat optic nerve. Magn Reson Med. 1996;35:162–167. doi: 10.1002/mrm.1910350206. [DOI] [PubMed] [Google Scholar]
- 21.Szafer A, Zhong J, Gore JC. Theoretical model for water diffusion in tissues. Magn Reson Med. 1995;33:697–712. doi: 10.1002/mrm.1910330516. [DOI] [PubMed] [Google Scholar]
- 22.Stanisz GJ, Szafer A, Wright GA, Henkelman RM. An analytical model of restricted diffusion in bovine optic nerve. Magn Reson Med. 1997;37:103–111. doi: 10.1002/mrm.1910370115. [DOI] [PubMed] [Google Scholar]
- 23.Latour LL, Svoboda K, Mitra PP, Sotak CH. Time-dependent diffusion of water in a biological model system. Proc Natl Acad Sci. 1994;91:1229–1233. doi: 10.1073/pnas.91.4.1229. [DOI] [PMC free article] [PubMed] [Google Scholar]
- 24.Peled S, Chen Y, Cory DG, Jolesz FA. Water diffusion and membrane permeability in myelin. Proceedings of Experimental NMR Conference 37th Annual Meeting; Pacific Grove, CA. 1996. p. 298. [Google Scholar]
- 25.Knauss R, Fleischer G, Gründer W, Jörg Körger, Werner A. Pulsed field gradient NMR and nuclear magnetic relaxation studies of water mobility in hydrated collagen II. Magn Reson Med. 1996;36:241–248. doi: 10.1002/mrm.1910360211. [DOI] [PubMed] [Google Scholar]
- 26.Laicher G, Ailion DC, Cutillo AG. Water self-diffusion measurements in excised rat lungs. J Magn Reson B. 1996;111:243–253. doi: 10.1006/jmrb.1996.0090. [DOI] [PubMed] [Google Scholar]
- 27.van Dusschoten D, Moonen CTW, de Jager PA, van As H. Unraveling diffusion constants in biological tissue by combining Carr-Purcell-Meiboom-Gill imaging and pulsed field gradient NMR. Magn Reson Med. 1996;36:907–913. doi: 10.1002/mrm.1910360613. [DOI] [PubMed] [Google Scholar]
- 28.Stanisz GJ, Henkelman RM. Diffusional anisotropy of T2 components in bovine optic nerve. Magn Reson Med. 1998;40:405–410. doi: 10.1002/mrm.1910400310. [DOI] [PubMed] [Google Scholar]
- 29.Beaulieu C, Fenrich FR, Allen PS. Multicomponent water proton transverse relaxation and T2-discriminated water diffusion in myelinated and nonmyelinated nerve. Magn Reson Imag. 1998;16(10):1201–1210. doi: 10.1016/s0730-725x(98)00151-9. [DOI] [PubMed] [Google Scholar]
- 30.Wijesinghe RS, Gielen FLH, Wikswo JP., Jr A model for compound action potentials and currents in a nerve bundle. I: the forward calculation. Ann Biomed Eng. 1991;19:43–72. doi: 10.1007/BF02368460. [DOI] [PubMed] [Google Scholar]
- 31.Inouye H, Kirschner DA. Membrane interactions in nerve myelin. I: determination of surface charge from effects of pH and ionic strength on period. Biophys J. 1988;53:235–246. doi: 10.1016/S0006-3495(88)83085-6. [DOI] [PMC free article] [PubMed] [Google Scholar]
- 32.Wang GK. The long-term excitability of myelinated nerve fibres in the transected frog sciatic nerve. J Physiol. 1985;368:309–321. doi: 10.1113/jphysiol.1985.sp015859. [DOI] [PMC free article] [PubMed] [Google Scholar]
- 33.English AE, Whittall KP, Joy MLG, Henkelman RM. Quantitative two-dimensional time correlation relaxometry. Magn Reson Med. 1991;22:425–434. doi: 10.1002/mrm.1910220250. [DOI] [PubMed] [Google Scholar]
- 34.Whittall KP. Quantitative interpretation of NMR relaxation data. J Magn Reson. 1989;84:134–152. [Google Scholar]
- 35.Lawson CL, Hanson RJ. Solving least squares problems. Englewood Cliffs, NJ: Prentice-Hall; 1974. [Google Scholar]
- 36.Aboitiz F, Scheibel AB, Fisher RS, Zaidel E. Fiber composition of the human corpus callosum. Brain Res. 1992;598:143–153. doi: 10.1016/0006-8993(92)90178-c. [DOI] [PubMed] [Google Scholar]
- 37.Callaghan PT. Pulsed-gradient spin-echo NMR for planar, cylindrical, and spherical pores under conditions of wall relaxation. J Magn Reson A. 1995;113:53–59. [Google Scholar]
- 38.Sundaram M, McGuire MH, Schajowicz F. Soft-tissue masses: histological basis for decreased signal (short T2) on T2-weighted MR images. AJR Am J Roentgenol. 1987;148:1247–50. doi: 10.2214/ajr.148.6.1247. [DOI] [PubMed] [Google Scholar]
- 39.Lee J-H, Labadie C, Springer CS, Jr, Harbison GS. Two-dimensional inverse laplace transform NMR: altered relaxation times allow detection of exchange correlation. J Am Chem Soc. 1993;115:7761–7764. [Google Scholar]
- 40.Peled S. PhD thesis. Massachusetts Institute of Technology; 1997. p. 1. [Google Scholar]