

Volume scanning with a 320–detector row scanner was found to reduce radiation doses at coronary CT angiography by up to 91% in comparison with those at standard helical scanning, with effective doses of 5.8 mSv at 120 kVp and 4.4 mSv at 100 kVp.
Abstract
Purpose:
To determine radiation doses from coronary computed tomographic (CT) angiography performed by using a 320–detector row volume scanner and evaluate how the effective dose depends on scan mode and the calculation method used.
Materials and Methods:
Radiation doses from coronary CT angiography performed by using a volume scanner were determined by using metal-oxide–semiconductor field-effect transistor detectors positioned in an anthropomorphic phantom physically and radiographically simulating a male or female human. Organ and effective doses were determined for six scan modes, including both 64-row helical and 280-row volume scans. Effective doses were compared with estimates based on the method most commonly used in clinical literature: multiplying dose-length product (DLP) by a general conversion coefficient (0.017 or 0.014 mSv·mGy−1·cm−1), determined from Monte Carlo simulations of chest CT by using single-section scanners and previous tissue-weighting factors.
Results:
Effective dose was reduced by up to 91% with volume scanning relative to helical scanning, with similar image noise. Effective dose, determined by using International Commission on Radiological Protection publication 103 tissue-weighting factors, was 8.2 mSv, using volume scanning with exposure permitting a wide reconstruction window, 5.8 mSv with optimized exposure and 4.4 mSv for optimized 100-kVp scanning. Estimating effective dose with a chest conversion coefficient resulted in a dose as low as 1.8 mSv, substantially underestimating effective dose for both volume and helical coronary CT angiography.
Conclusion:
Volume scanning markedly decreases coronary CT angiography radiation doses compared with those at helical scanning. When conversion coefficients are used to estimate effective dose from DLP, they should be appropriate for the scanner and scan mode used and reflect current tissue-weighting factors.
© RSNA, 2010
Introduction
Coronary computed tomographic (CT) angiography has generated great enthusiasm in recent years, owing to its high diagnostic accuracy efficacy in the assessment of patients known to have or suspected of having coronary artery disease (1). It has been estimated that 2.3 million coronary CT angiography examinations are performed annually in the United States (2). Nevertheless, the enthusiasm about this test has been tempered by concern about the potentially high radiation dose received by patients undergoing coronary CT angiography and its attendant cancer risks (3). In the largest U.S. registry of coronary CT angiography dose information, median effective dose from coronary CT angiography was 21 mSv, equivalent to over 1000 posteroanterior chest radiographs or 7 years of background radiation, prior to an intervention aimed at lowering dose (4). In the past 2 years, a number of methods have been introduced to decrease radiation dose from coronary CT angiography, including sequential or “step-and-shoot” imaging (5,6) and new dual-source protocols (7).
An appealing approach to coronary CT angiography in general, and to dose reduction in particular, is the use of a volume CT scanner. Traditional multidetector CT scanners acquire data over an interval of time, during which the patient table translates so that the scanner’s detectors obtain data from the most cranial to the most caudal portion of the heart. In contrast, the detector array of a volume scanner contains sufficient craniocaudal coverage such that the entire length of the heart can be imaged simultaneously, with the patient stationary. By imaging the entire heart in one piece, volume scanning eliminates stair-step artifacts due to seams or gaps between image sections caused by interheartbeat variations in the locations of coronary arteries, as well as artifacts due to temporal changes in coronary opacification by iodinated contrast material. Moreover, because of the brief duration during which the x-ray tube needs to be left on (as little as 0.35 second; ie, a full gantry rotation), volume scanning offers the theoretic possibility of markedly decreasing radiation dose in comparison with traditional helical scanning. However, concerns have been raised about the ability of the first generation of volume scanners to optimally achieve this potential dose reduction. The wider x-ray beam raises the possibility of higher dose due to overbeaming or increased scattered radiation, as does the requirement that the beam remain on for a full gantry rotation during coronary CT angiography rather than the one-half gantry rotation typical of traditional multidetector CT scanners. It thus remains uncertain how the technological advances of volume scanning affect radiation dose.
The primary goal of the present study is to accurately characterize radiation dose to patients from coronary CT angiography performed by using the first-generation volume CT scanner, a 320–detector row scanner. We consider six different scan modes incorporated into the scanner, and for each mode we use standard clinical protocols used in practice that are in accordance with manufacturer’s recommendations. Our approach is to measure organ doses in a custom-adapted phantom by using solid-state metal-oxide–semiconductor field-effect transistor (MOSFET) dosimeters and determine effective dose by using the methods specified in the current (2007) recommendations of the International Commission on Radiological Protection (ICRP) (8). These results are compared with effective dose determination based on the methods specified in previous ICRP guidelines (9) as well as with estimates based on conversion factors found in the European Guidelines on Quality Criteria for Computed Tomography (10,11).
Materials and Methods
Relation to Industry
No industry support was received for this study; costs were covered by intramural (A.E.A.) and extramural (A.J.E.) National Institutes of Health funding. One author (R.M.), who is an employee of Toshiba America Medical Systems, did not have control of inclusion of any data or information that might present a conflict of interest.
Phantoms
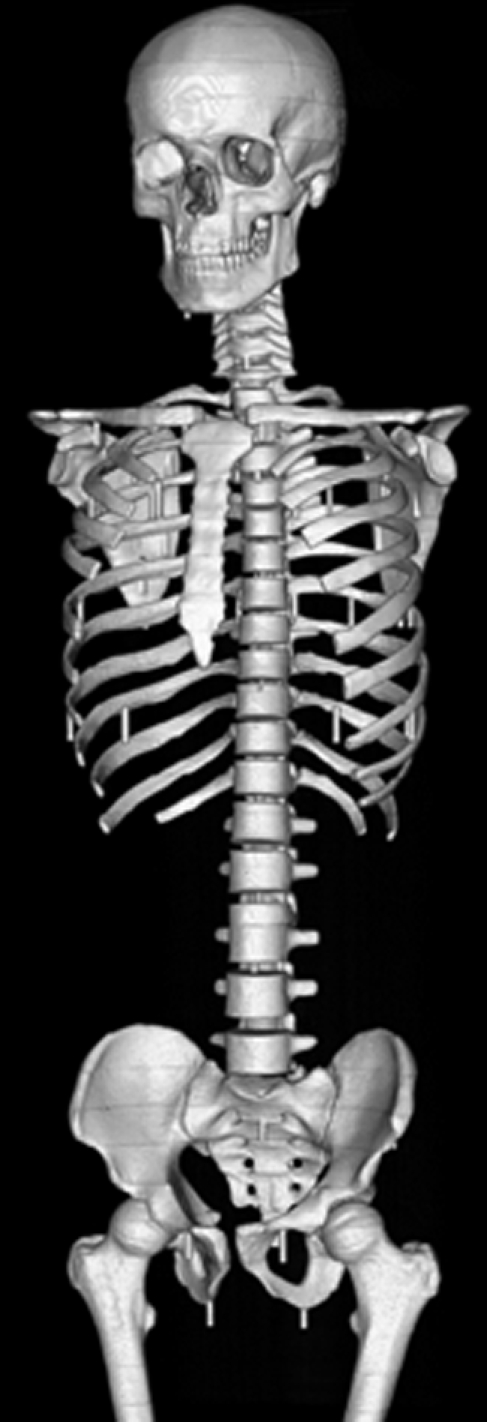
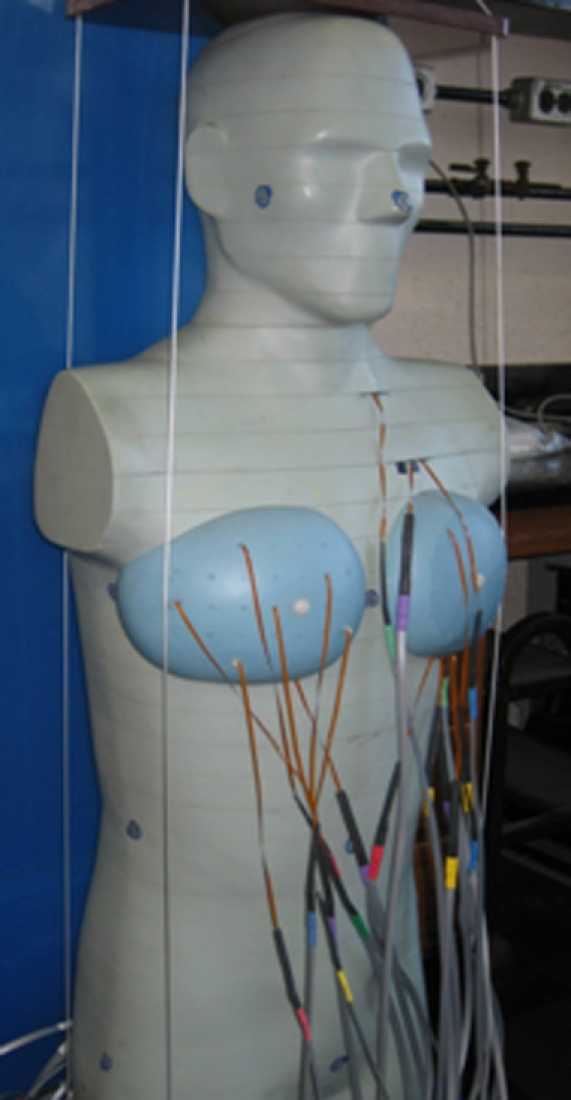
A whole-body dosimetry verification phantom, made of tissue-equivalent polymers and resins that simulate soft tissue, spinal cord, spinal disks, lung, brain, and bone, was used (Fig 1). The same phantom was used for all scans. Photon attenuation values for all substitutes are within 3% of the value for actual tissue. The phantom is sectional, consisting of a series of 25-mm-thick contiguous sections. In each section, 5-mm-diameter holes, drilled in the craniocaudal direction. are located at positions optimized for dosimetry in more than 20 internal organs. Tissue-equivalent holders are used for MOSFET detector placement within these holes. With the use of human anatomic data, this phantom has been modified from a commercially available anthropomorphic phantom (ATOM 701; CIRS, Norfolk, Va). Additional holes were drilled so that absorbed dose could be determined for each organ with a significant tissue-weighting factor in the ICRP 2007 guidelines. Medium-sized tissue-equivalent breast phantoms, constructed based on CT data from an actual patient imaged in the supine position, were attached to the phantom for scans of female phantoms. This phantom is not only physically similar to a human (weight, 73 kg; height, 173 cm; thorax, 23 × 32 cm without breasts) but is also radiographically similar to a human (Fig 2), thereby enabling realistic simulation of a person undergoing a CT examination.
Figure 1a:
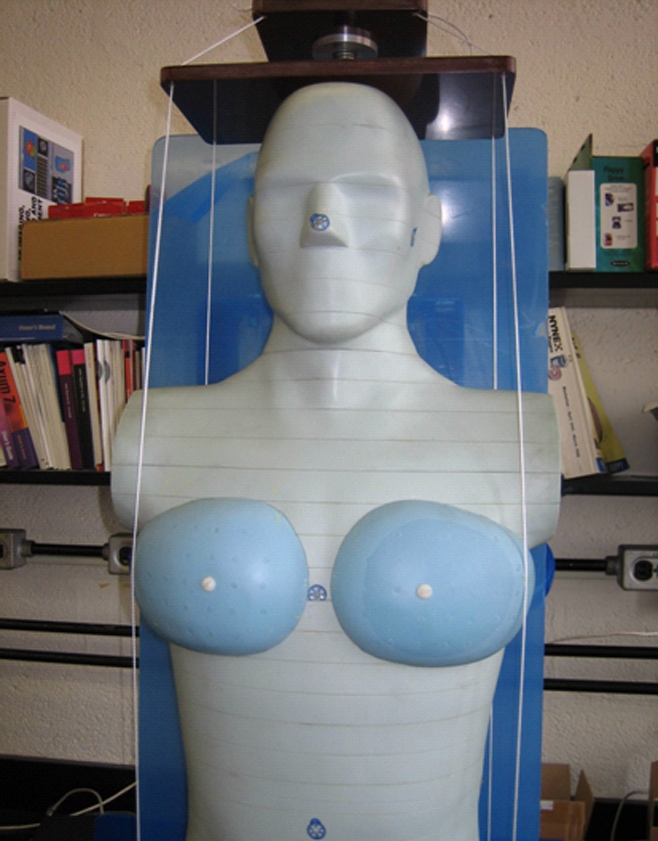
Modified physical anthropomorphic phantom (ATOM 701; CIRS). Views of (a) torso and (b) cross section through chest.
Figure 1b:
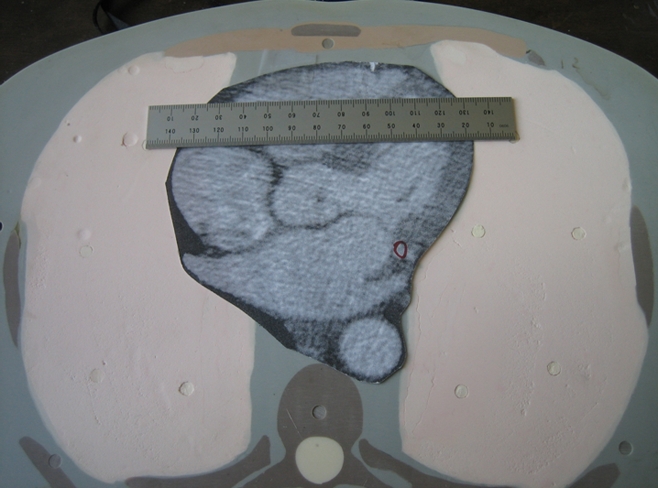
Modified physical anthropomorphic phantom (ATOM 701; CIRS). Views of (a) torso and (b) cross section through chest.
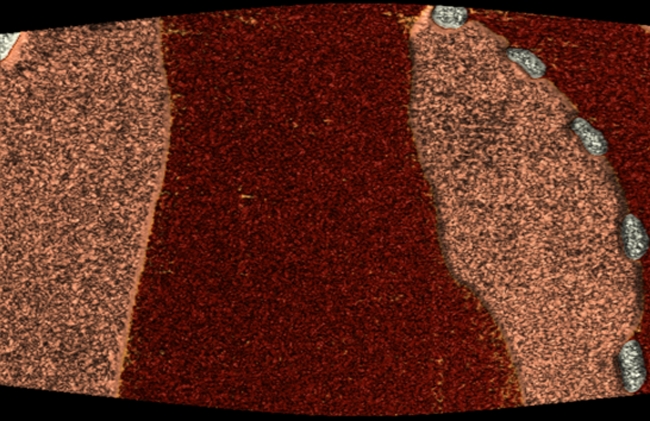
Figure 2a:
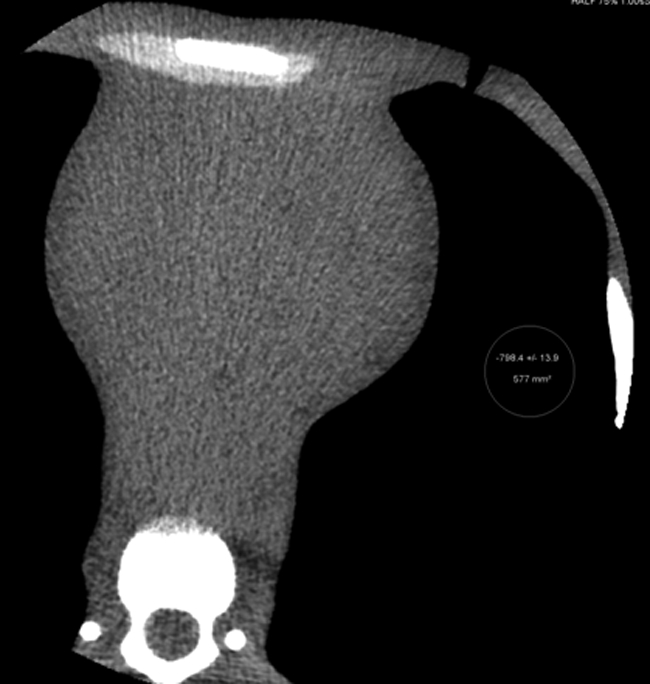
CT scans of modified anthropomorphic phantom. (a) Multiplanar reformation of axial image obtained at coronary CT angiography. (b) Volume-rendered image with cut plane, illustrating the 14 cm scanned simultaneously. (c) Volume-rendered image with bone windows of the modified phantom.
Figure 2b:
CT scans of modified anthropomorphic phantom. (a) Multiplanar reformation of axial image obtained at coronary CT angiography. (b) Volume-rendered image with cut plane, illustrating the 14 cm scanned simultaneously. (c) Volume-rendered image with bone windows of the modified phantom.
Figure 2c:
CT scans of modified anthropomorphic phantom. (a) Multiplanar reformation of axial image obtained at coronary CT angiography. (b) Volume-rendered image with cut plane, illustrating the 14 cm scanned simultaneously. (c) Volume-rendered image with bone windows of the modified phantom.
MOSFET Dosimeters
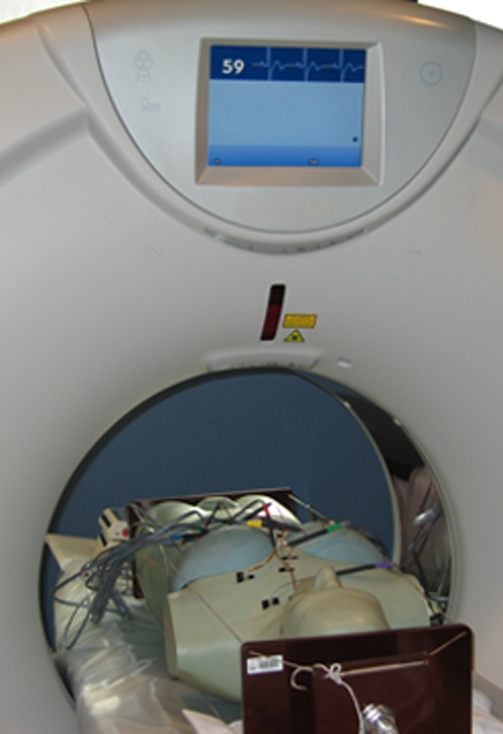
A mobile MOSFET dose verification system (TN-RD-70W; Best Medical, Ottawa, Canada) reader was coupled with high-sensitivity MOSFETs (TN-1002RD; Best Medical). MOSFETs were calibrated to relate voltage readout to absorbed dose of radiation by using an electrometer and ionization chamber combination (model 1015; Radcal, Monrovia, Calif). MOSFETs were positioned in locations corresponding to the heart, lungs, breast, esophagus, thyroid, thymus, colon, small intestine, stomach, ovary, testes, bladder, liver, uterus, prostate, brain, spleen, pancreas, salivary glands, adrenal glands, extrathoracic airways, gall bladder, kidneys, oral mucosa, and bone/bone marrow of the phantom (Fig 3). Up to 20 MOSFETs were placed in the phantom for any individual scan. Each scan protocol was repeated separately with MOSFETs placed in one of three regions—the thorax, cranial to the thorax, and caudal to the thorax—thus enabling MOSFETs in a total of 46 locations to be used to characterize the dosimetry of each scan mode.
Figure 3a:

(a) Reader with five attached MOSFETs. (b) Modified anthropomorphic phantom with MOSFETs placed for dosimetry measurements in the thorax. (c) Phantom is shown in the CT scanner with MOSFETs placed, ready for acquisition of dose measurements.
Figure 3b:
(a) Reader with five attached MOSFETs. (b) Modified anthropomorphic phantom with MOSFETs placed for dosimetry measurements in the thorax. (c) Phantom is shown in the CT scanner with MOSFETs placed, ready for acquisition of dose measurements.
Figure 3c:
(a) Reader with five attached MOSFETs. (b) Modified anthropomorphic phantom with MOSFETs placed for dosimetry measurements in the thorax. (c) Phantom is shown in the CT scanner with MOSFETs placed, ready for acquisition of dose measurements.
CT Scans
CT examinations were performed with a 320–detector row scanner (Aquilion ONE; Toshiba Medical Systems, Otawara, Japan). A patient heart rate of 60 beats per minute was simulated by using a “chicken heart” electronic device incorporated into the scanner’s cardiac monitor. Scan protocols, typical of those used clinically at the National Heart, Lung, and Blood Institute, were determined prior to scanning (A.J.E., A.E.A., M.Y.C.). Gantry rotation time was 0.35 second in each mode. Tube current was selected with a clinically used table based primarily on patient weight.
Six coronary CT angiography scan modes were considered, as summarized in Table 1. All helical modes are currently implemented by using only the middle 64 rows, while volume modes enable up to 320 rows to be utilized. For electrocardiographically synchronized tube current modulation (ESTCM), tube current remained at its maximal value between 70% and 80% of the cardiac cycle, and dropped to 20% of maximum outside of this temporal window. Prospectively triggered helical scanning is similar to the “step-and-shoot” scan mode incorporated into other manufacturers’ scanners, in leaving the x-ray tube on only during a brief window during diastole, but differs in that the scanner operates in a helical rather than axial mode.
Table 1.
The Six Scan Modes Evaluated
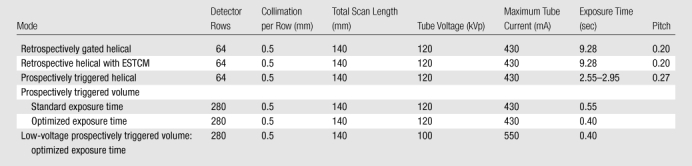
For volume scanning, the middle 280 detector rows were used, attaining 14-cm craniocaudal coverage, which is greater than the median scan length used in practice and usually sufficient for cardiac scanning (12). Two different 120-kVp volume scanning modes were considered. To have enough data to reconstruct a given cardiac phase, it is necessary to obtain some data before and after the desired phase. In the first volume mode, referred to as volume imaging with standard exposure time, a phase window from 65% of the cardiac cycle to the subsequent R wave was prespecified, which in practice results in a reported exposure time of 0.55 second and enables reconstruction from 61% to 82% of the cardiac cycle at a heart rate of 60 beats per minute. Works-in-progress enhancements to cardiac reconstruction algorithms reduce the necessary amount of data surrounding the desired phases, therefore enabling shorter exposure times. In the second volume scanning mode, referred to as volume imaging with optimized exposure time, a 75%–75% phase window was prespecified, which in practice results in a reported exposure time of 0.40 second. This exposure time currently enables reconstructions for a single phase at 75% of the cardiac cycle, but with the enhanced cardiac reconstruction algorithm enables reconstructions from approximately 69%–81% of the cardiac cycle, at a heart rate of 60 beats per minute. Optimized exposure time volume scanning was also performed by using a 100-kVp protocol; this represents the lowest-dose volume scanning mode which still enables multiple phase reconstructions.
Separate scans were obtained for male and female phantoms. Two to 10 repetitions of the scan protocol were performed for each combination of scan mode, sex, and set of MOSFET placements. The number of repetitions was selected for each combination such that the dose to the MOSFETs was sufficient to ensure reproducibility, so as to minimize this source of error in effective dose estimates. In addition, doses were determined separately for bolus tracking, by using a tube voltage of 120 kVp and a current of 150 mA with the four middle detectors. For bolus tracking, acquisition of at least 50 seconds was performed for each set of MOSFET positions; doses are reported as dose per 10 seconds of acquisition. No scout or aortic localizer scans were obtained; these generally contribute less than 5% of total dose.
Organ Dose Calculations
Organ doses were determined from MOSFET measurements. Cumulative point doses were determined at one to six locations for each organ, divided by the number of scans performed for each combination of scan mode and sex, and averaged to determine the absorbed dose to the organ. For lung, a weighted average was calculated, with the weighting of each MOSFET measurement determined by the percentage of the organ’s volume closest to that MOSFET. The percentage of bone and active marrow in different locations was approximated by using separate weighting factors as specified by Eckerman et al (13).
Effective Dose Calculations
Effective dose was calculated from organ absorbed doses by using radiation and tissue-weighting factors specified in ICRP publication 103 (8), as well as those in the older ICRP publication 60 (9).
Conversion Factor Determination and Effective Dose Estimation
Dose-length product (DLP), defined according to International Electrotechnical Commission standards (14), was recorded for each scan from the scanner console. The “k factor,” or conversion factor relating DLP to effective dose, was determined by dividing effective dose by DLP. The effective dose determined by using MOSFET measurements was also compared with that estimated by using DLP multiplied by European Commission chest conversion factors. These factors, based on Monte Carlo simulations modeling single-section scanners, were 0.017 mSv·mGy−1·cm−1 in the 2000 European Commission guidelines (10) and 0.014 mSv·mGy−1·cm−1 in appendix C of the 2004 guidelines (11).
Image Noise
Axial images from coronary CT angiographic scans of a female phantom performed with each of the six scan protocols were reconstructed with a section thickness of 0.5 mm, standard cardiac kernel (FC04), and adaptive noise reduction algorithms (QDS and Boost3D; Toshiba Medical Systems). Image noise was assessed for each scan, in the same 14 locations within the heart, as the standard deviation of CT number in the region of interest. Difference in noise among the six protocols was assessed by using repeated-measures analysis of variance, with Box epsilon used to correct the degrees of freedom. Statistical calculations were performed by using statistical software (Stata 10.1; Stata, College Station, Tex).
Results
Effective Doses
Effective doses for the six protocols are summarized in Table 2. There was a marked difference in effective dose between protocols. With standard 64-row helical scanning without ESTCM as the benchmark, effective dose was reduced by 91%, from 35.4 to 4.4 mSv, by using 100-kVp optimized volume scanning. Effective doses varied up to twofold between methods used to determine effective dose. Effective doses determined by using organ doses and ICRP publication 103 tissue-weighting factors were the highest, ranging from 33% to 42% higher than effective doses determined by using the older ICRP publication 60 tissue-weighting factors. Estimating effective dose from DLP by using a generic chest conversion factor resulted in its underestimation, even in comparison with that from the older ICRP 60 definition.
Table 2.
Effective Doses of the Six Scan Protocols
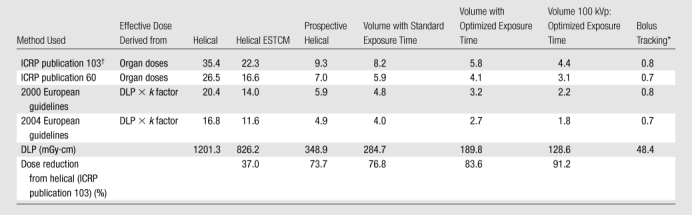
Note.—Except where otherwise indicated, data are the effective dose in millisieverts. Skin dose is not included.
Bolus tracking doses are for 10 seconds of tracking.
For remainder organs, average dose to all organs listed in ICRP 103, except for lymph nodes and muscle, is used.
Conversion Factors
By using effective dose determined with its current definition (based on organ doses measured and tissue-weighting factors specified in ICRP publication 103), conversion factors relating DLP to effective dose from coronary CT angiography ranged from 0.027 to 0.034 mSv·mGy−1·cm−1, depending on the scan mode (Table 3). Even with the older ICRP publication 60 definition of effective dose, these conversion factors would range 0.020–0.022 mSv·mGy−1·cm−1 for 64-row helical scanning and 0.021–0.024 mSv·mGy−1·cm−1 for volume scanning. In contrast, the conversion factors commonly used are uniformly 0.014 (2004 guidelines) or 0.017 mSv·mGy−1·cm−1 (2000 guidelines), independent of the scan mode used.
Table 3.
Conversion Factors k for the Six Scan Modes
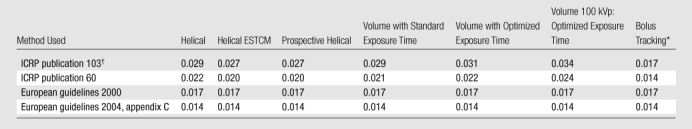
Note.—Data are the ratio of effective dose to DLP, in mSv·mGy−1·cm−1. Skin dose is not included.
Bolus tracking doses are for 10 seconds of tracking.
For remainder organs, average dose to all organs listed in ICRP 103, except for lymph nodes and muscle, is used.
Organ Doses
Organ doses for the six scan modes and bolus tracking are summarized in Table 4. Organs that contributed most to effective dose were the female breasts, lungs, red bone marrow, stomach, and esophagus, for which weighted equivalent doses (15) (portions of effective dose attributable to a specific organ) were 2.0, 1.4, 0.8, 0.5, and 0.3 mSv, respectively, for 120-kVp optimized volume scanning. Organ doses to these critical organs varied markedly between protocols; doses to female breasts and to female and male lungs all decreased by 87% by using 100-kVp optimized volume scanning, in comparison with 64-row helical scanning.
Table 4.
Organ Absorbed Doses, in Milligrays
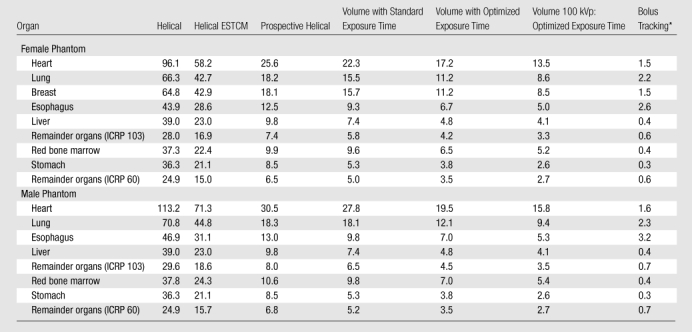
Note.—Only organs contributing at least 3% of effective dose for volume scan are shown.
Bolus tracking doses are for 10 seconds of tracking.
Image Noise
While there was a statistically significant difference in image noise among the six protocols (P = .004), mean and median noise were similar between the six scan protocols (Fig 4), with median values ranging between 25.0 and 30.9 HU. While the highest median noise was that for 100-kVp optimized volume scanning (30.9 HU), in six of the 14 regions of interest this scan had less image noise than or equal image noise to the standard helical scan (median, 29.6 HU). For each scan protocol, there was at least one region with less image noise and one region with more image noise than that with standard helical scanning.
Figure 4:

Graph of image noise for the six scan protocols. Points represent individual noise measurements in the 14 cardiac regions of interest, and the horizontal bars denote median values for each protocol.
Discussion
Sixty-four–section coronary CT angiography using a helical technique has shown outstanding diagnostic performance. Meta-analysis of 45 studies evidenced per-patient pooled sensitivity of 99% and specificity of 89%, with median positive and negative predictive values of 93% and 100%, respectively (16). However, 64-section helical coronary CT angiography has also been associated with some of the highest radiation doses of any diagnostic radiologic procedure (15), and, specifically, higher radiation doses than those from any generation of scanners preceding it. Thus, while the initial 64-section scanners demonstrated improved diagnostic performance over previous generations of scanners, it is widely recognized that improved scanners, affording comparable or improved diagnostic performance at lower cost in terms of radiation exposure, are needed. In this context, volume scanning represents an important potential advance.
Nevertheless, concerns have been raised about the potential for overbeaming and increased scattered radiation in volume scanning, as well as its need for a full gantry rotation for coronary CT angiography, and their implications in terms of increased dose. In fact, the only previous article addressing radiation dose from volume coronary CT angiography reported a mean effective dose of 7.2 mSv (range, 4.9–16.5 mSv) in an initial experience with 34 patients (17); this dose was based on the DLP, using a modified conversion factor (18). While somewhat lower than typical effective doses for helical coronary CT angiography, these doses are considerably higher than those described with sequential protocols on 64-section scanners (5,6). Accounting in part for this discrepancy is lack of protocol optimization in these initial scans performed using volume coronary CT angiography. In 82% of patients scanned prospectively, full tube current was maintained over 40% of the cardiac cycle, enabling reconstruction from 60%–100% of the R-R interval, thus generating a wide range of coronary images for evaluation at the price of increased radiation dose.
The effective dose determined in our study from volume coronary CT angiography with standard exposure time (using the ICRP publication 103 definition) was 8.2 mSv, which is comparable to the mean dose in the aforementioned pilot series. Effective doses, however, were lower by using volume scanning with optimized exposure time: 5.8 mSv at 120 kVp and 4.4 mSv at 100 kVp.
Of note is the difference in effective dose we calculated from the same scan between different calculation methods for effective dose. Effective dose is defined by the ICRP, which updated its definition in 2007 (8). The approximately 40% higher effective doses that were determined by using this new formulation largely reflect the increased tissue-weighting factor assigned to the female breast (from 0.05 to 0.12) and, to a much lesser degree, the increase in the tissue-weighting factor to the “remainder organs” and their redefinition to include the heart. In published literature (5–7,12), the most commonly used method to estimate effective dose from a coronary CT angiography procedure has been to multiply the scanner-reported DLP by a conversion factor (denoted “k factor” or “EDLP”) specified in European guidelines (10,11). Effective doses estimated here by using these k factors, which were as low as 2.7 mSv at 120 kVp and 1.8 mSv at 100 kVp, were considerably lower than those determined by using the ICRP definition, even in its lower-dose ICRP publication 60 formulation.
Estimating effective dose with these conversion factors has numerous limitations. These “broad estimates” (10) were not derived for contemporary coronary CT angiography but rather for chest CT, they are based on Monte Carlo simulations modeling single-section scanners now several generations old (ie, Siemens DRH, GE 9800, and Philips LX [11]), and they were derived by using the older (9) definition of effective dose. The conversion factors determined here can be used to estimate effective dose from volume and helical scanning by using the Aquilion One scanner in the modes studied. Further studies are needed (19) to determine such conversion factors for the various scan modes (20) of other contemporary scanners. While the accuracy of estimates of effective dose in contemporary coronary CT angiography obtained by using European guideline k factors is thus questionable, the fact that these estimates are similar in the current study to those previously reported for sequential scanning (21) suggests that concerns of overbeaming or increased scatter as a major contributor to effective dose in volume scanning do not appear to be well founded. This observation is consistent with findings in 256-section coronary CT angiography with 8-cm craniocaudal coverage—that increasing the scan length decreases the dose of prospectively gated scans (22).
Our study had several potential limitations. The phantom was scanned with a fixed heart rate of 60 beats per minute with no significant heart rate variability. At higher heart rates and with greater heart rate variability, the volume scanner used in our study acquires data over two consecutive heartbeats to ensure image quality, which would result in higher effective dose (17). The relationship between heart rate variability and radiation dose from volume CT requires further study. The validity of using k factors, which we provided here for the volume scanner, has been a subject of debate in the literature, and some experts argue against their use (19). While we found no sizable difference in image noise between scan protocols, this phantom study was not designed to compare the image quality and interpretability of actual clinical scans between protocols. These could differ even at similar levels of noise. The anthropomorphic phantom used reflects a normal-sized individual, close in size to the Reference Person recommended by ICRP for determining effective dose (8). While effective dose is a population-based quantity that does not depend on a particular individual’s habitus, organ-absorbed doses could vary from the values found here depending on patient habitus. For patients with increased thoracic thickness (eg, obsese patients), it would be expected that organ doses would need to be higher to maintain constant image noise (23).
In conclusion, coronary CT angiography can be performed by using volume scanning to decrease radiation dose to patients with no meaningful change in image noise, with effective doses of 4.4 mSv at 100 kVp and 5.8 mSv at 120 kVp noted in this study, by using ICRP publication 103 tissue-weighting factors. For a volume scanner, the scan mode chosen for coronary angiography is critical in determining the radiation doses received by the patient. Given volume scanning’s potential for low radiation dose, further studies evaluating its diagnostic accuracy efficacy and impact on patient-important outcomes are needed. The chest conversion factors commonly used to estimate effective dose from DLP in coronary CT angiography significantly underestimated effective dose, for both volume scanning and 64-section helical imaging, and thus scanner- and scan mode–appropriate conversion factors are needed to accurately estimate effective dose.
Advances in Knowledge.
By using 100-kVp volume scanning, effective dose from coronary CT angiography can be decreased by up to 91% in comparison with standard helical scanning, with no change in image noise.
Effective dose from coronary CT angiography by using volume scanning with an optimized exposure time was 5.8 mSv at 120 kVp and 4.4 mSv at 100 kVp, using International Commission on Radiological Protection (ICRP) publication 103 tissue-weighting factors.
Organ dose to the lungs and female breasts, the critical organs for coronary CT angiography, can be decreased to as low as approximately 9 mGy by using volume scanning.
Effective dose of coronary CT angiography, calculated with the current definition of effective dose, in ICRP publication 103, is 33%–42% higher than that calculated with the previous definition, in ICRP publication 60.
The conversion factors commonly used to estimate effective dose from dose-length product, which are derived from single-section scanners, underestimate effective dose in coronary CT angiography for both volume scanning and 64–detector row helical imaging.
Implications for Patient Care.
Coronary CT angiography can be performed by using volume scanning to decrease radiation dose to patients.
For a volume scanner, the scan mode chosen for coronary angiography is critical in determining the radiation dose received by the patient.
Scanner- and scan mode–appropriate conversion factors that reflect current tissue-weighting factors should be used to accurately estimate effective dose from dose-length product.
Acknowledgments
We thank Gary Johnson, AAS, for help in constructing the phantom and Gregory Henderson, RT, for assistance in CT scanning.
Received May 7, 2009; revision requested June 5; revision received July 31; accepted August 6; final version accepted August 7.
Funding: This research was supported by the National Institutes of Health (grant 5 KL2 RR024157-03). A.E.A. and M.C. areemployees of National Heart, Lung, and Blood Institute.
See Materials and Methods for pertinent disclosures.
Abbreviations:
- DLP
- dose-length product
- ESTCM
- electrocardiographically synchronized tube current modulation
- ICRP
- International Commission on Radiological Protection
- MOSFET
- metal-oxide–semiconductor field-effect transistor
References
- 1.Stein PD, Yaekoub AY, Matta F, Sostman HD. 64-slice CT for diagnosis of coronary artery disease: a systematic review. Am J Med 2008;121:715–725 [DOI] [PubMed] [Google Scholar]
- 2.National Council on Radiation Protection and Measurements Ionizing radiation exposure of the population of the United States. Report no. 160. Bethesda, Md: National Council on Radiation Protection and Measurements, 2009 [Google Scholar]
- 3.Einstein AJ, Henzlova MJ, Rajagopalan S. Estimating risk of cancer associated with radiation exposure from 64-slice computed tomography coronary angiography. JAMA 2007;298:317–323 [DOI] [PubMed] [Google Scholar]
- 4.Raff GL, Chinnaiyan KM, Share DA, et al. Radiation dose from cardiac computed tomography before and after implementation of radiation dose-reduction techniques. JAMA 2009;301:2340–2348 [DOI] [PubMed] [Google Scholar]
- 5.Shuman WP, Branch KR, May JM, et al. Prospective versus retrospective ECG gating for 64-detector CT of the coronary arteries: comparison of image quality and patient radiation dose. Radiology 2008;248:431–437 [DOI] [PubMed] [Google Scholar]
- 6.Earls JP, Berman EL, Urban BA, et al. Prospectively gated transverse coronary CT angiography versus retrospectively gated helical technique: improved image quality and reduced radiation dose. Radiology 2008;246:742–753 [DOI] [PubMed] [Google Scholar]
- 7.Halliburton SS, Sola S, Kuzmiak SA, et al. Effect of dual-source cardiac computed tomography on patient radiation dose in a clinical setting: comparison to single-source imaging. J Cardiovasc Comput Tomogr 2008;2:392–400 [DOI] [PubMed] [Google Scholar]
- 8.The 2007 recommendations of the International Commission on Radiological Protection. ICRP publication 103. Ann ICRP 2007;37:1–332 [DOI] [PubMed] [Google Scholar]
- 9.1990 Recommendations of the International Commission on Radiological Protection. ICRP publication 60. Ann ICRP 1991;21:1–201 [PubMed] [Google Scholar]
- 10.Bongartz G, Golding SJ, Jurik AG, et al. European Guidelines on Quality Criteria for Computed Tomography. EUR 16262. The European Commission’s Study Group on Development of Quality Criteria for Computed Tomography Luxembourg, Luxembourg: European Commission, 2000 [Google Scholar]
- 11.Bongartz G, Golding SJ, Jurik AG, et al. 2004 CT quality criteriaLuxembourg, Luxembourg: European Commission, 2004 [Google Scholar]
- 12.Hausleiter J, Meyer T, Hermann F, et al. Estimated radiation dose associated with cardiac CT angiography. JAMA 2009;301:500–507 [DOI] [PubMed] [Google Scholar]
- 13.Eckerman KF, Bolch WE, Zankl M, Petoussi-Henss N. Response functions for computing absorbed dose to skeletal tissues from photon irradiation. Radiat Prot Dosimetry 2007;127:187–191 [DOI] [PubMed] [Google Scholar]
- 14.International Electrotechnical Commission Medical electrical equipment: part 2-44—particular requirements for the basic safety and essential performance of x-ray equipment for computed tomography. International Standard IEC 60601-2-44 edition 3.0 Geneva, Switzerland: International Electrotechnical Commission, 2009 [Google Scholar]
- 15.Einstein AJ, Moser KW, Thompson RC, Cerqueira MD, Henzlova MJ. Radiation dose to patients from cardiac diagnostic imaging. Circulation 2007;116:1290–1305 [DOI] [PubMed] [Google Scholar]
- 16.Mowatt G, Cook JA, Hillis GS, et al. 64-Slice computed tomography angiography in the diagnosis and assessment of coronary artery disease: systematic review and meta-analysis. Heart 2008;94:1386–1393 [DOI] [PubMed] [Google Scholar]
- 17.Rybicki FJ, Otero HJ, Steigner ML, et al. Initial evaluation of coronary images from 320-detector row computed tomography. Int J Cardiovasc Imaging 2008;24:535–546 [DOI] [PubMed] [Google Scholar]
- 18.Mori S, Nishizawa K, Ohno M, Endo M. Conversion factor for CT dosimetry to assess patient dose using a 256-slice CT scanner. Br J Radiol 2006;79:888–892 [DOI] [PubMed] [Google Scholar]
- 19.Shrimpton PC, Wall BF, Yoshizumi TT, Hurwitz LM, Goodman PC. Effective dose and dose-length product in CT [letter]. Radiology 2009;250:604–605 [DOI] [PubMed] [Google Scholar]
- 20.Huda W, Yoshizumi TT, Hurwitz LM, Goodman PC. Computing effective doses from dose-length product in CT [letter]. Radiology 2008;248:321–322 [DOI] [PubMed] [Google Scholar]
- 21.Earls JP, Schrack EC. Prospectively gated low-dose CCTA: 24 months experience in more than 2,000 clinical cases. Int J Cardiovasc Imaging 2008;25:177–187 [Google Scholar]
- 22.Walker MJ, Olszewski ME, Desai MY, et al. New radiation dose saving technologies for 256-slice cardiac computed tomography angiography. Int J Cardiovasc Imaging 2009;25:189–199 [Google Scholar]
- 23.McCollough CH, Ulzheimer S, Halliburton SS, Shanneik K, White RD, Kalender WA. Coronary artery calcium: a multi-institutional, multimanufacturer international standard for quantification at cardiac CT. Radiology 2007;243:527–538 [DOI] [PubMed] [Google Scholar]