

Evaluation of ultrashort–echo time (UTE) MR imaging signal intensity patterns and identification of UTE signal sources may aid clinical assessment of the osteochondral junction and may provide new opportunities for assessing joint degeneration and repair.
Abstract
Purpose:
To image cartilage-bone interfaces in naturally occurring and experimentally prepared human cartilage-bone specimens at 3 T by using ultrashort echo time (TE) (UTE) and conventional pulse sequences to (a) determine the appearance of the signal intensity patterns and (b) identify the structures contributing to signal intensity on the UTE MR images.
Materials and Methods:
This study was exempted by the institutional review board, and informed consent was not required. Five cadaveric (mean age, 86 years ± 4) patellae were imaged by using proton density–weighted fat-suppressed (repetition time msec/TE msec, 2300/34), T1-weighted (700/10), and UTE (300/0.008, 6.6, with or without dual-inversion preparations at inversion time 1 = 135 msec and inversion time 2 = 95 msec) sequences. The UTE images were compared with proton density–weighted fat-suppressed and T1-weighted images and were evaluated by two radiologists. To identify the sources of signal on the UTE images, samples including specific combinations of tissues (uncalcified cartilage [UCC] only, calcified cartilage [CC] and subchondral bone [bone] [CC/bone], bone only; and UCC, CC, and bone [UCC/CC/bone]) were prepared and imaged by using the UTE sequence.
Results:
On the UTE MR images, all patellar sections exhibited a high-intensity linear signal near the osteochondral junction, which was not visible on protein density–weighted fat-suppressed or T1-weighted images. In some sections, focal regions of thickened or diminished signal intensity were also found. In the prepared samples, UCC only, CC/bone, and UCC/CC/bone samples exhibited high signal intensity on the UTE images, whereas bone-only samples did not.
Conclusion:
These results show that the high signal intensity on UTE images of human articular joints originates from the CC and the deepest layer of the UCC, without a definite contribution from subchondral bone. UTE sequences may provide a way of evaluating abnormalities at or near the osteochondral junction.
© RSNA, 2010
Introduction
Articular cartilage is a connective tissue that covers the osseous surfaces of joints. It has a zonal architecture, with uncalcified regions of superficial or tangential, middle or transitional, and deep or radial layers (1), as well as a calcified layer that anchors it to the underlying subchondral bone. Calcified cartilage (CC) is approximately 100 μm thick (2), is metabolically active (3), and may remodel with both mechanical loading (4) and aging (2). The region of the osteochondral junction, including CC and subchondral bone, is important for solute transport between the vasculature and articular cartilage (5) and has been implicated in the pathogenesis of osteoarthritis. It also is important in chondral repair. The CC layer thickens in osteoarthritis (6) and overloading (7), whereas it thins near focal subchondral microcracks and lesions (8). During microfracture surgery in horses, the removal of the CC layer substantially improved outcome (9). Together, the articular uncalcified cartilage (UCC), CC, and subchondral bone function as an osteochondral unit and have an important role in load-bearing joints (10,11).
Magnetic resonance (MR) imaging has emerged as the imaging modality of choice for evaluating articular cartilage morphology (12–14), structure, and composition (15,16). However, MR imaging has, to date, not been capable of assessing the deep radial and calcified layers of cartilage. These deep radial and calcified layers of cartilage have short T2 characteristics, and conventional pulse sequences are unable to acquire data in this range. With the advent of ultrashort–echo time (TE) (UTE) MR imaging, signal from tissues with predominantly short T2 (and T2*) can be detected (17–20). UTE MR imaging of osteochondral tissues, imaged at 1.5 T with low spatial resolution, has shown a high-intensity linear signal in the region of the osteochondral junction (19). These sequences are now becoming available at 3-T imagers (21,22), together with techniques such as dual inversion-recovery preparation (DIR), which can be used to selectively image short T2 signals and suppress signals from longer T2 components in fat and water. These approaches provide high spatial resolution and contrast, which may allow identification of the anatomic structures contributing to the high-signal-intensity appearance.
The histologic basis of the signal intensity areas identified at the osteochondral junction on UTE MR images spatial remains to be established. The purpose of our study was to image cartilage-bone interfaces in naturally occurring and experimentally prepared human cartilage-bone specimens at 3 T by using UTE and conventional pulse sequences to (a) determine the characteristic appearance of the signal intensity patterns and (b) identify the structures contributing to signal on the UTE MR images.
Materials and Methods
Specimen Preparation
MR imaging appearance of patellar specimens.—This study was exempted by the institutional review board, and informed consent was not required. Patellae were harvested from five fresh-frozen cadaveric human knees (two women, three men; mean age, 86.4 years ± 4.4). The specimens exhibited gross cartilage degeneration but without erosion down to the bone (Fig 1, A). The patellae were notched (every 3 mm in the axial plane) to specify orientation and were secured upside down in a container filled with saline. This container was placed inside a 3-inch (7.62-cm) surface coil, with the cartilage in the plane of the coil and near the isocenter of the imager. The specimen orientation in the imager was comparable to the orientation of the patella in a person in the supine position.
Figure 1:

Samples were prepared and imaged for, A, evaluation of UTE appearance of human patella, by creating axial notches for registration and, B, identification of sources of UTE signal. To identify sources of high UTE signal in human osteochondral tissues, samples were prepared to include specific tissue components. Two 3-mm-thick slices of human patellae were first imaged by using DIR UTE sequences. Slices were cut into three pieces, and superficial-to-middle–layer UCC (sample 1 [1], n = 7) was removed by cutting approximately 0.4 mm above the osteochondral junction. Remaining osteochondral fragments (n = 6 total), comprising the deepest layer of UCC, CC, and bone, were subjected to the following: no treatment (sample 2 [2], n = 2), digestion of UCC with 125 μg/mL papain solution for 24 hours at 60°C to leave CC and subchondral bone intact (sample 3 [3], n = 2), and physical removal of CC and some of the subchondral bone on one-half of the sample by dissection with a scalpel (sample 4 [4], n = 2). Osteochondral fragments were obtained from femoral condyles of a patient with total-knee arthroplasty, with consent. An osteochondral fragment with intact cartilage was surgically prepared (sample 5 [5], n = 1) by removing a UCC fragment (n = 1) and creating a chondral defect while preserving CC as described previously. Another specimen with regions of osteoarthritis containing areas of both eburnation and partially eroded cartilage was obtained (sample 6 [6], n = 1). The removed UCC fragments (n = 7 total) were not treated. PDFS = proton density–weighted fat-suppressed sequence.
Osteochondral fragment samples for identification of sources of UTE signal.—Anatomic structures near the osteochondral junction were isolated by means of tissue preparation or disease process and were studied by using UTE MR imaging (Fig 1, B). Articular cartilage was separated into layers by means of resection (23). To remove the deep-layer cartilage and retain CC and bone, papain enzyme digestion was used (24). CC was removed by using surgical methods (9,25,26). In addition, both UCC and CC are lost in osteoarthritis in regions of eburnation (6).
To identify sources of high UTE signal in human osteochondral tissues, samples were prepared to include specific tissue components. Two 3-mm-thick slices of human patellae were obtained from another cadaveric knee in a 62-year-old woman, essentially as described above. The slices were first imaged by using a DIR UTE sequence, as described below. Slices were cut into three pieces, and the superficial-to-middle–layer UCC (sample 1 [Fig 1, B]) was removed by cutting approximately 0.4 mm above the osteochondral junction. The remaining osteochondral fragments (n = 6 total), comprising the deepest layer of UCC, CC, and bone, were subjected to the following: no treatment (sample 2, n = 2 [Fig 1, B]), digestion of the UCC with 125 μg/mL papain solution for 24 hours at 60°C to leave the CC and subchondral bone intact (6,24) (sample 3, n = 2 [Fig 1, B,]), or physical removal of the CC and some of the subchondral bone on one-half of the sample by means of dissection with a scalpel (sample 4, n = 2 [Fig 1, B]).
Additionally, osteochondral fragments were obtained, with consent, from the femoral condyles of a patient undergoing total knee arthroplasty. A fragment with intact cartilage was surgically prepared (sample 5, n = 1 [Fig 1, B]) by removing a UCC fragment (n = 1) and creating a chondral defect while preserving the CC as described previously (9,25). Another specimen with regions of osteoarthritis containing areas of both eburnation and partially eroded cartilage was obtained (sample 6, n = 1 [Fig 1, B]). The removed UCC fragments (n = 7 total) were not treated. All samples were reimaged by using proton density–weighted fat-suppressed, T1-weighted, and DIR UTE sequences.
UTE MR Imaging
A 3-T MR imager (Signa Twinspeed; GE Healthcare, Milwaukee, Wis) with the maximum peak gradient amplitude of 40 mT/m and slew rate of 150 mT/m/sec was used in conjunction with either a single-channel 3-inch (7.62-cm) receive-only surface coil (for patellar specimens) or a 1-inch (2.54-cm) birdcage transmit-receive coil (for the osteochondral fragments). Hardware modification included an addition of a custom transmit-receive switch to the receiver preamplifiers for rapid switching after the end of a radiofrequency excitation pulse. This modification allowed detection of signal as early as 8 μsec after the end of the radiofrequency pulse, which is much shorter than the values typically achievable with conventional imaging.
UTE pulse sequences.—Two types of UTE pulse sequences were used. Both aimed at imaging the short T2 components of osteochondral samples. The first sequence, which was used to assess UTE appearance of the notched patellar samples, was a two-dimensional projection-reconstruction sequence described previously (19). Briefly, a half-width radiofrequency pulse was used with a section-selection gradient, followed by projection reconstruction with ramp sampling after a prescribed “time to echo” (TE). Although the term TE is used, this acquisition initially helps to detect the free induction decay, not an echo. Each radial projection was sampled twice with opposite section-selection gradient polarities. The raw data were then summed to form a radial projection. This process was repeated through 360° in approximately 500 steps. The radially sampled data were regridded onto a 512 × 512 Cartesian grid and were reconstructed by using two-dimensional Fourier transformation. The following parameters were used for the UTE sequence: repetition time msec/TE msec, 300/0.008, 6.6, for a later gradient-echo acquisition (at a TE of 6.6 msec, fat and water are in phase); axial section selection; field of view, 10 cm; readout, 512; projections, 511; section thickness, 1.7 mm; flip angle, 60°; sampling bandwidth, ± 62.5 kHz; and number of signals acquired, two. To accentuate the short T2* components of the tissue, the images reconstructed from the second TE (6.6 msec) were subtracted from those from the first TE (0.008 msec), because the signal from tissues with short T2* was markedly reduced by the time of the second TE, and this finding was highlighted on the subtraction images.
The second UTE protocol, DIR UTE, was also used to image the osteochondral fragment samples with an enhanced image contrast for short T2 components. This protocol is a variation of UTE that suppresses long T2* components in the water and fat by using sequential adiabatic inversion pulses centered on the water and fat spectral peaks, respectively. The water inversion pulse had a delay time for inversion time 1 of 135 msec, and the fat inversion pulse had a delay time for inversion time 2 of 95 msec. The simultaneous nulling of both the long T2* water and fat signals provided high contrast for unsuppressed short T2* tissues. The following parameters were used with the DIR UTE sequence: 300/0.008; field of view, 6 or 7 cm; section thickness, 0.7 or 1.0 mm; readout, 512; number of projections, 899; bandwidth, ± 50 kHz; and number of signals acquired, two.
Conventional pulse sequences.—To provide comparative data and to determine whether UTE MR images showed signal from structures which gave no signal on conventional MR images, proton density–weighted and T1-weighted spin-echo sequences were also used to image the same specimens. The proton density–weighted fat-suppressed sequence was performed by using a fast spin-echo readout with the following parameters: 2300/34; field of view, 10 cm (for notched patella) or 6 cm (for osteochondral fragments); echo train length, seven; matrix, 512 × 512; section thickness, 1.7 mm; and number of signals acquired, two. The T1-weighted sequence was also performed by using a fast spin-echo readout with the following parameters: 700/10; field of view, 10 cm (for notched patella) or 6 cm (for osteochondral fragments); echo train length, two; matrix, 512 × 512; section thickness, 1.7 mm; and number of signals acquired, two.
MR Image Evaluation
The images of all samples obtained with all pulse sequences were reviewed in consensus by two musculoskeletal radiologists (C.B.C. and J.R.D., with 9 and 13 years of experience, respectively).
To determine the characteristic appearance and its prevalence on UTE images of human patellae (Fig 1, A), approximately six central sections in each patella (30 sections total) were evaluated, with particular attention to the region near and along the osteochondral junction. Specifically, the presence and the appearance of the linear region adjacent to bone were assessed for the intensity and morphology of the linear region, and classification was assigned to one of three groups as follows: (a) distinct high linear signal (Fig 2, C); (b) thickened and diffuse medium-to-high–intensity linear signal (Fig 3, A); and (c) markedly decreased signal with thinning or complete absence (Fig 3, B). Within each group, the length of the linear signal along the osteochondral junction was determined by using a program (Matlab; MathWorks, Natick, Mass) that determined the length of line drawn by a radiologist (C.B.C.) on the UTE images of the intact patellae. Different colors were used to distinguish the signal groups. For each of the three groups, the length was determined as a proportion of the total pixel length of all three groups. In addition, the prevalence of each type of signal in individual sections of patellae was determined.
Figure 2:

MR images of human patella in axial plane obtained by using, A, proton density–weighted fat suppressed, B, T1-weighted, and, C, UTE sequences were compared. Areas of bone (△), UCC (*), bathing saline solution (☐), and subchondral bone plate (thick arrows) were observed. UTE MR images had high-intensity linear signal near the osteochondral junction (thin arrows, C).
Figure 3:

In axial UTE MR images, subset of patellar samples showed different UTE signal patterns near the osteochondral junction characterized by, A, thickening of the linear signal (arrows), and, B, diminution (thin arrows) or absence (thick arrow) of the signal.
To identify the sources of high signal on the UTE images, observations were made by radiologists on the images of the prepared osteochondral specimens (Fig 1, B). We hypothesized that each tissue component (UCC, CC, or bone) could contribute independently to signal on UTE images. By deduction, there would be seven possible permutations of UTE signal from the prepared samples (Table 1). For example, if the UCC was the only tissue exhibiting signal on the UTE images, the UCC only (sample 1, n = 7 [Fig 1, B]) and the UCC/CC/subchondral bone (bone) (uncut region of sample 2, n = 2) samples would exhibit the signal, whereas the samples containing CC/bone (sample 4, n = 2; sample 5, n = 1) or bone alone (sample 3, n = 2; sample 6, n = 1) would not (Table 1, outcome A,). Similarly, if both UCC and CC exhibited signal on the UTE images, UCC only, UCC/CC/bone, and CC/bone samples would all exhibit signal (Table 1, outcome D). The frequency of occurrence of the linear signal on the UTE images of the specimens was also determined.
Table 1.
Outcomes for Presence of High Linear Signal Intensity on UTE MR Images according to Osteochondral Components
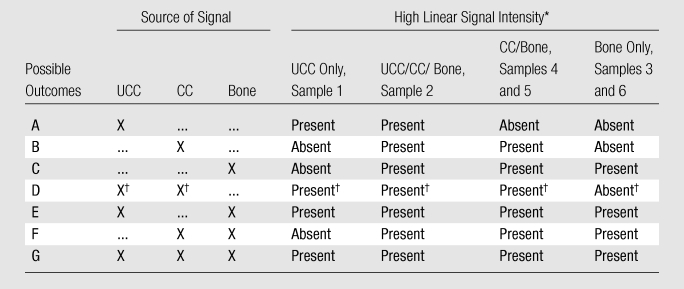
Note.—X indicates that the osteochondral component or components were the sources of the signal.
Sample number as indicated in Figure 1, B.
Data are results of our study.
Histologic Analysis
To validate the sample preparation procedure (Fig 1, B), histologic analysis was performed. The osteochondral fragment samples were fixed in 10% buffered formalin, decalcified in TBD-2 decalcifier (ThermoShandon, Pittsburg, Calif), embedded in paraffin blocks, sliced into 3-μm sections, and stained with safranin O and fast green. The stained slices were examined to assess the appearance of the osteochondral junction.
Results
MR Imaging Appearance of Patellar Samples
Conventional MR images.—In both proton density–weighted fat-suppressed (Fig 2, A) and T1-weighted (Fig 2, B) images of human patella, the bulk of articular cartilage (Fig 2, *) was distinct from subchondral (arrows) and trabecular (Fig 2, △) bone, as well as from the surrounding saline solution (Fig 2, ▪). These images did not exhibit a high-signal linear region near the osteochondral junction.
UTE subtraction images.—With the UTE echo subtraction images (Fig 2, C), the patella exhibited a high-intensity linear signal (Fig 2, C, thin arrows) near the osteochondral junction. This signal was unique to images obtained by using UTE sequences and was not identified on images obtained with the conventional sequences. The bulk of articular cartilage tended to decrease in signal from the deep to the superficial layer and was not distinct from the saline solution (Fig 2, C).
The high-intensity linear signal was the predominant signal found on the UTE images of the patellar samples near the region of the osteochondral junction. This signal was found in all patellar sections and constituted 80% (17341 of 21705 pixels) of the combined length of the osteochondral junction (of all samples). Some of the samples exhibited focal regions of different morphology and/or signal intensity, including thick diffuse linear signal (10% [2179 of 21705] of pixels) of the combined length (Fig 3, A, arrows) and a decreased signal intensity with a thin appearance or absence of signal (10% [2185 of 21705] of pixels) of the combined length (Fig 3, B, thick arrow). Complete absence of the signal was rare and constituted less than 2% of the total combined length of the osteochondral junction.
The individual patellar sections usually had a mix of different signal types; 20% (six of 30 sections) of all sections exhibited only the high-intensity linear signal, whereas no sections exhibited solely the thick diffuse or thin or absent signal, and 20%–40% of sections exhibited a mix of different signals (Fig 4), always including the high-intensity linear signal. Since the patellar samples were aged and moderately degenerate, the focal occurrence of minor signal groups (ie, thick or thin or absent) may have been related to pathologic findings.
Figure 4:

Prevalence of different patterns of linear signal intensity on UTE images found near the osteochondral junction in patellar samples. X indicates the exhibition of the described pattern within the same section.
Identification of Source of UTE Signal
DIR UTE appearance of untreated osteochondral fragments.—DIR UTE images (Fig 5, A) of the patellar slices showed a low signal intensity in nearly all areas of the cartilage and bone except for a linear region near the osteochondral junction, where a distinct, high-signal region (Fig 5, A, arrows) was observed. This pattern was similar to that seen on the UTE subtraction images of the patella (Fig 3, C, thin arrows), but with higher contrast and greater suppression of other tissue and fluid signals.
Figure 5:

MR imaging appearances in axial plane of experimentally prepared samples suggested that both deep layer of UCC and layer of CC contribute to high linear signal on DIR UTE images. A, DIR UTE image shows characteristic pattern of high linear signal intensity (arrows) near the osteochondral junction of an untreated and intact sample. After this sample was divided into fragments (samples 1–4 in drawings above B–D), the characteristic pattern was present in, B, C, and D, untreated UCC-only samples (↑ [sample 1]), B, UCC/CC/bone samples (↓ [sample 2]), and, D, papain-treated CC/bone samples (↓ [sample 4]). The pattern was also present in, E, surgically prepared CC/bone sample (↓ [sample 5]). The pattern was absent in, B, C, and D, superficial-to-middle layers of UCC-only samples (* [sample 1]) and, C, a region where UCC and CC was resected (○ [sample 3]). By deduction, both UCC and CC, but not subchondral bone, contribute to the pattern of signal. F–I, Histologic analysis of samples 2–5 show that our sample preparation successfully isolated intended components of osteochondral tissues: F, UCC/CC/bone sample consisted of all three components of bone (blue), CC (purple [↓]), and UCC (red). G, Resected region (○) consisted of mainly bone (blue) and small pockets of CC (↓). H, Papain-treated CC/bone sample consisted of bone and CC (↓) but not UCC. I, Surgically prepared CC/bone sample also consisted of bone and CC (↓) but not UCC in the defect region. Dotted lines signify magnification from top row of micrographs.
DIR UTE appearance of treated osteochondral fragment samples.—On the basis of the appearance of treated samples, the high signal intensity on the DIR UTE images reflected the presence of the deepest layer of UCC, as well as CC, but not bone or superficial-to-middle–layer UCC. UCC-only samples (sample 1 [Figs 1, B; 5, B–E]), or five of seven samples, exhibited a low-to-intermediate–intensity linear signal that faded from the deep (approximately > 4 mm from the layer of CC) to the superficial layer (Fig 5, B–Fig 5E, thick arrows). In the untreated osteochondral sample (sample 2 [Fig 1, B; 5, B]), which contained the deepest layer of UCC (approximately <0.4 mm from the layer of CC) and CC (Fig 5, F), the UTE signal intensity pattern was present (Fig 5, B, ↓). When the sample was cut diagonally to remove the CC and a thin layer of subchondral bone (sample 3 [Figs 1,B; 5,C]), the UTE signal intensity pattern was preserved in the uncut region (Fig 5, C, ↓) and was absent in the cut region (Fig 5, C). This sample preparation was validated by using histologic analysis (Fig 5, G). In the sample treated with papain (sample 4 [Figs 1, B; 5, D]) to remove UCC while retaining CC (histologic analysis [Fig 5, H]), the UTE signal intensity pattern was preserved (Fig 5, D, ↓). In the sample treated surgically (sample 5 [Fig 1, B; 5, E]) to remove UCC while retaining CC (histologic analysis [Fig 5, I]), the UTE signal intensity pattern was also preserved (Fig 5, E, ↓).
The osteochondral fragments containing eburnated regions caused by osteoarthritis (sample 6, n = 1 [Figs 1, B; 6]) exhibited a site-dependent UTE signal intensity pattern. Within the eburnated region without CC or UCC (Fig 6, D, double triangle), the characteristic normal UTE signal intensity pattern of the osteochondral region was absent (Fig 6, C). In contrast, in the region covered with articular cartilage (Fig 6, A–Fig 6C, *) and intact CC (Fig 6, D, arrows), the UTE signal pattern was preserved (Fig 6, C, arrows).
Figure 6:

MR imaging appearance of an osteoarthritic osteochondral fragment containing regions of both eburnation (double triangle) and intact cartilage (*), suggesting that an eburnated bone does not contribute to the linear signal intensity pattern. A, Proton density–weighted fat-suppressed and, B, T1-weighted images show that the eburnated region lacked articular cartilage layer and exhibited sclerotic bone, whereas the intact region on the right exhibited medium-intensity signal from articular cartilage. C, On the DIR UTE image, the linear signal near osteochondral junction (arrows) was present only in region of intact cartilage (right half of the sample) but not in region of eburnation (left half of the sample) or cancellous bone (triangle). D, Histologic analysis from subregions of sample (dotted-line boxes) confirmed the lack of both UCC and CC in the eburnated region (double triangles, left half of the sample), and the presence of both UCC and CC (arrows) in the intact region (right half of the sample). These results excluded subchondral bone as a source of UTE MR image signal intensity.
These findings were consistent with (Table 1, outcome D) the case of deep-layer UCC and CC contributing to the UTE signal, but not subchondral bone. The UCC-only (sample 1), UCC/CC/bone (sample 2), and CC/bone (samples 4 and 5) samples all exhibited a linear signal pattern on the UTE images (Fig 5, B–Fig 5E, arrows), whereas bone-only samples (cut region of sample 3 and the eburnated region of sample 6) did not (Fig 5, C; 6, C). The frequency of these observations is listed in Table 2.
Table 2.
Expression of High Linear Signal Intensity on UTE Images
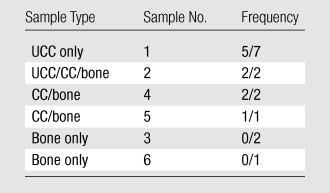
Note.—Sample number as indicated in Figure 1, B. Frequency refers to the number of samples with positive signal/total number of samples.
Discussion
Our results provided a detailed description of the MR imaging appearance of human osteochondral tissue from the knee by using two complementary UTE techniques. The UTE subtraction MR images of the human patella exhibited a pattern of high-intensity linear signal near the junction of cartilage and bone, which was not visible on conventional MR images. DIR UTE MR imaging also confirmed the presence of the signal near the osteochondral junction.
With analysis of the osteochondral fragments, we identified the deepest layer of UCC and CC as the sources of the UTE signal intensity pattern. The pattern was found in UCC only (in the deep layer; sample 1), UCC/CC/bone (sample 2), and CC/bone (samples 4 and 5) samples, whereas the samples containing only bone (samples 3 and 6) did not. Assuming that each tissue component (UCC, CC, and bone) can contribute independently to the UTE signal, these results suggest that UTE MR signal in the osteochondral junction of the human patella and femoral condyle is caused by the presence of the CC, as well as the deepest layer of the UCC, with no definite contribution from the subchondral bone. The signal is likely to be detectable because of the capability of the UTE sequences to capture rapidly decaying signals (and filter out long T2 signals from water and fat), along with short T2 values of the CC and the deepest layer of UCC. In contrast, images obtained with conventional sequences, with the minimum TEs of several milliseconds, do not depict the short T2 signal and appear dark as a result.
Technical challenges related to UTE imaging include distortion of the slice profile, errors in the radial k-space trajectories, and off resonance (27–29). Eddy currents lead to distortion of the section-selection gradient profile, resulting in out-of-section signal contamination (27). These errors can be reduced by measuring the section-selection gradient and precompensating the distortion by modifying the digital waveform input to the gradient amplifier (29). Radial trajectories are sensitive to gradient distortion, which can be improved through calibration of the sampling k-space trajectory (29). Susceptibility effect near the bone cartilage interface, together with field inhomogeneity and chemical shift, may lead to off-resonance artifacts manifesting as blurring in the radial UTE acquisition. Fat suppression helps to reduce this artifact. However, conventional fat saturation pulses may suppress signal from the short T2 components through direct saturation and magnetization transfer. The long adiabatic inversion and signal nulling approach used in DIR UTE is effective in suppressing long T2 fat signal with less short T2 signal attenuation. Off-resonance artifacts can also be corrected through an acquired field map or multifrequency reconstruction (28). The combination of gradient calibration and off-resonance correction, together with efficient long T2 water and fat suppression, may further improve the robustness of this technique and will be investigated in future work.
There were several limitations to our study. The small number of samples did not allow for statistical analysis. On the basis of the observations, however, it would seem likely that the presence or absence of the characteristic UTE signal pattern near the osteochondral junction is affected by the sample preparation. Papain digestion may have affected MR properties of the tissue, and it was observed that the trabecular space of sample 4 was free of yellow marrow. In addition, for UCC/CC/bone samples, it was difficult to distinguish the deepest UCC from the CC by using the DIR UTE sequence, owing to the thickness of the CC, which was only approximately 100–200 μm. A higher spatial resolution, as well as another contrast mechanism, may be needed to resolve CC structure. For example, T1 and T2* values of deep-layer UCC and CC may be sufficiently different, such that it may be possible to distinguish the structures by using appropriate weighting. The thinness of the CC makes it also susceptible to partial volume effects, which may result in a diffuse UTE signal. In addition, although chemical shift artifacts can be seen with UTE sequences (17), the fact that high signal intensity was seen on the DIR UTE images in the absence of signal from fatty marrow makes this artifact an unlikely explanation for the observed high signals.
Evaluation of UTE MR imaging signal intensity patterns and identification of sources of UTE signal has implications for clinical assessment of the osteochondral junction and provides new opportunities for assessing joint degeneration and repair. UTE methods may allow assessment of CC thickness, which is important because there is histologic evidence suggesting changes in the thickness of the CC layer in osteoarthritis (6) and aging (2). In cartilage repair, the removal of CC during the microfracture procedure improves the outcome (9), and UTE imaging may be useful to determine the successful removal of CC, as well as the restoration of CC with healing or repair. Although it remains to be established how the normal UTE signal pattern changes with disease and injury, our study is useful for understanding UTE signal intensity changes in the region of the osteochondral junction and offers opportunities to examine this previously unexplored region of tissue.
Advances in Knowledge.
Ultrashort–echo time (UTE) sequences showed a distinct high-intensity linear signal near and along the osteochondral junction of all specimens; focal abnormalities in the signal included diffuse thickening as well as a low-intensity thin appearance.
The sources of the high-intensity linear signal near the osteochondral junction on the UTE MR images included the deepest layer of uncalcified cartilage and calcified cartilage (CC), with no definite contribution from the subchondral bone.
Implication for Patient Care.
UTE MR imaging provides direct visualization of the deepest layers of the articular cartilage, including CC; these tissues have been implicated in the pathogenesis of osteoarthritis and are important in cartilage repair.
Acknowledgments
We thank Graeme M. Bydder, MB, ChB, University of California, San Diego, for his valuable contribution in the discussion and editing of this manuscript.
Received September 30, 2008; revision requested November 18; final revision received June 24, 2009; accepted July 1; final version accepted September 2.
Supported by Veterans Affairs Medical Center grant 1136264 and GE Healthcare Research Grant.
Authors stated no financial relationship to disclose.
Funding: This research was supported by the National Institute of Arthritis and Musculoskeletal and Skin Diseases and the National Institute of Aging, National Institutes of Health (grants F32 AR054248, R01 AR0044058, R01 AR051565, R01 AR055637, RC2 AR058929, P01 AG007996), the National Institute of Dental and Craniofacial Research (grant R21DEO19008), and the Howard Hughes Medical Institute through the Howard Hughes Medical Institute Professor Program.
Abbreviations:
- CC
- calcified cartilage
- DIR
- dual inversion-recovery preparation
- TE
- echo time
- UCC
- uncalcified cartilage
- UTE
- ultrashort TE
References
- 1.Hunziker EB, Quinn TM, Hauselmann HJ. Quantitative structural organization of normal adult human articular cartilage. Osteoarthritis Cartilage 2002;10(7):564–572 [DOI] [PubMed] [Google Scholar]
- 2.Lane LB, Bullough PG. Age-related changes in the thickness of the calcified zone and the number of tidemarks in adult human articular cartilage. J Bone Joint Surg Br 1980;62(3):372–375 [DOI] [PubMed] [Google Scholar]
- 3.Green WT, Jr, Martin GN, Eanes ED, Sokoloff L. Microradiographic study of the calcified layer of articular cartilage. Arch Pathol 1970;90(2):151–158 [PubMed] [Google Scholar]
- 4.Oettmeier R, Arokoski J, Roth AJ, Helminen HJ, Tammi M, Abendroth K. Quantitative study of articular cartilage and subchondral bone remodeling in the knee joint of dogs after strenuous running training. J Bone Miner Res 1992;7(Suppl 2):S419–S424 [DOI] [PubMed] [Google Scholar]
- 5.Lyons TJ, Stoddart RW, McClure SF, McClure J. The tidemark of the chondro-osseous junction of the normal human knee joint. J Mol Histol 2005;36(3):207–215 [DOI] [PubMed] [Google Scholar]
- 6.Hwang J, Bae WC, Shieu W, Lewis CW, Bugbee WD, Sah RL. Increased hydraulic conductance of human articular cartilage and subchondral bone plate with progression of osteoarthritis. Arthritis Rheum 2008;58(12):3831–3842 [DOI] [PMC free article] [PubMed] [Google Scholar]
- 7.Burr DB. Anatomy and physiology of the mineralized tissues: role in the pathogenesis of osteoarthrosis. Osteoarthritis Cartilage 2004;12(suppl A):S20–S30 [DOI] [PubMed] [Google Scholar]
- 8.Boyde A, Firth EC. High resolution microscopic survey of third metacarpal articular calcified cartilage and subchondral bone in the juvenile horse: possible implications in chondro-osseous disease. Microsc Res Tech 2008;71(6):477–488 [DOI] [PubMed] [Google Scholar]
- 9.Frisbie DD, Morisset S, Ho CP, Rodkey WG, Steadman JR, McIlwraith CW. Effects of calcified cartilage on healing of chondral defects treated with microfracture in horses. Am J Sports Med 2006;34(11):1824–1831 [DOI] [PubMed] [Google Scholar]
- 10.Bachrach NM, Ateshian GA, Mow VC. Effects of subchondral plate fracture on articular cartilage response [abstr]. Summer Bioengineering Conference, American Society of Mechanical Engineers, Bioengineering Division, Breckenridge, Colo, June 25-29, 1993 Vol 24 Breckenridge, Colo: American Society of Mechanical Engineers, Bioengineering Division, 1993; 630–633 [Google Scholar]
- 11.Mow VC, Bachrach NM, Ateshian GA. The effects of a subchondral bone perforation on the load support mechanism within articular cartilage. Wear 1994;175(1–2):167–175 [Google Scholar]
- 12.Bredella MA, Tirman PF, Peterfy CG, et al. Accuracy of T2-weighted fast spin-echo MR imaging with fat saturation in detecting cartilage defects in the knee: comparison with arthroscopy in 130 patients. AJR Am J Roentgenol 1999;172(4):1073–1080 [DOI] [PubMed] [Google Scholar]
- 13.Disler DG, McCauley TR, Wirth CR, Fuchs MD. Detection of knee hyaline cartilage defects using fat-suppressed three-dimensional spoiled gradient-echo MR imaging: comparison with standard MR imaging and correlation with arthroscopy. AJR Am J Roentgenol 1995;165(2):377–382 [DOI] [PubMed] [Google Scholar]
- 14.Recht MP, Piraino DW, Paletta GA, Schils JP, Belhobek GH. Accuracy of fat-suppressed three-dimensional spoiled gradient-echo FLASH MR imaging in the detection of patellofemoral articular cartilage abnormalities. Radiology 1996;198(1):209–212 [DOI] [PubMed] [Google Scholar]
- 15.Burstein D, Velyvis J, Scott KT, et al. Protocol issues for delayed Gd(DTPA)(2-)-enhanced MRI (dGEMRIC) for clinical evaluation of articular cartilage. Magn Reson Med 2001;45(1):36–41 [DOI] [PubMed] [Google Scholar]
- 16.Duvvuri U, Reddy R, Patel SD, Kaufman JH, Kneeland JB, Leigh JS. T1rho-relaxation in articular cartilage: effects of enzymatic degradation. Magn Reson Med 1997;38(6):863–867 [DOI] [PubMed] [Google Scholar]
- 17.Bydder M, Du J, Takahashi AM, et al. Chemical shift artifact in center-out radial sampling: a potential pitfall in clinical diagnosis [abstr]. In: Proceedings of the Fifteenth Meeting of the International Society for Magnetic Resonance in Medicine Berkeley, Calif: International Society for Magnetic Resonance in Medicine, 2007; 1811 [Google Scholar]
- 18.Robson MD, Gatehouse PD, Bydder M, Bydder GM. Magnetic resonance: an introduction to ultrashort TE (UTE) imaging. J Comput Assist Tomogr 2003;27(6):825–846 [DOI] [PubMed] [Google Scholar]
- 19.Gatehouse PD, Thomas RW, Robson MD, Hamilton G, Herlihy AH, Bydder GM. Magnetic resonance imaging of the knee with ultrashort TE pulse sequences. Magn Reson Imaging 2004;22(8):1061–1067 [DOI] [PubMed] [Google Scholar]
- 20.Gatehouse PD, Bydder GM. Magnetic resonance imaging of short T2 components in tissue. Clin Radiol 2003;58(1):1–19 [DOI] [PubMed] [Google Scholar]
- 21.Du J, Sinha S, Takahashi AM, et al. Imaging of the deep radial and calcified layers of the cartilage using ultrashort TE (UTE) sequence at 3T [abstr]. In: Proceedings of the Fifteenth Meeting of the International Society for Magnetic Resonance in Medicine Berkeley, Calif: International Society for Magnetic Resonance in Medicine, 2007; 3813 [Google Scholar]
- 22.Sinha S, Du J, Takahashi AM, Chung CB, Bydder GM. Estimation of T1 and T2 of deep radial and calcified layers in human patella from ultrashort echo time (UTE) imaging on a 3T clinical system [abstr]. In: Proceedings of the Fifteenth Meeting of the International Society for Magnetic Resonance in Medicine Berkeley, Calif: International Society for Magnetic Resonance in Medicine, 2007; 3815 [Google Scholar]
- 23.Aydelotte MB, Kuettner KE. Differences between sub-populations of cultured bovine articular chondrocytes. I. Morphology and cartilage matrix production. Connect Tissue Res 1988;18(3):205–222 [DOI] [PubMed] [Google Scholar]
- 24.Clark JM, Huber JD. The structure of the human subchondral plate. J Bone Joint Surg Br 1990;72(5):866–873 [DOI] [PubMed] [Google Scholar]
- 25.Breinan HA, Minas T, Hsu HP, Nehrer S, Shortkroff S, Spector M. Autologous chondrocyte implantation in a canine model: change in composition of reparative tissue with time. J Orthop Res 2001;19(3):482–492 [DOI] [PubMed] [Google Scholar]
- 26.Mithoefer K, Williams RJ, 3rd, Warren RF, et al. Chondral resurfacing of articular cartilage defects in the knee with the microfracture technique. Surgical technique. J Bone Joint Surg Am 2006;88(suppl 1 pt 2):294–304 [DOI] [PubMed] [Google Scholar]
- 27.Wansapura JP, Daniel BL, Pauly J, Butts K. Temperature mapping of frozen tissue using eddy current compensated half excitation RF pulses. Magn Reson Med 2001;46(5):985–992 [DOI] [PubMed] [Google Scholar]
- 28.Noll DC, Pauly JM, Meyer CH, Nishimura DG, Macovski A. Deblurring for non-2D Fourier transform magnetic resonance imaging. Magn Reson Med 1992;25(2):319–333 [DOI] [PubMed] [Google Scholar]
- 29.Lu A, Daniel BL, Pauly KB. Improved slice excitation for ultrashort TE imaging with B0 and linear eddy current correction [abstr]. In: Proceedings of the Fourteenth Meeting of the International Society for Magnetic Resonance in Medicine Berkeley, Calif: International Society for Magnetic Resonance in Medicine, 2006; 2381 [Google Scholar]