

The combination of 7.0-T field strength, an advanced coil, field shimming, a high-count receive coil array, and heavy T2*-weighted contrast was shown to consistently depict hippocampal subfields down to 100-μm spatial resolution within a clinically acceptable protocol duration.
Abstract
Purpose:
To establish an imaging approach to visualize the 100-μm-thick hippocampal neuron-generating dentate granule cell layer (DGCL) consistently within a clinically feasible magnetic resonance (MR) imaging duration and to assess its sensitivity by quantifying the likelihood that it will be detected in healthy young adults.
Materials and Methods:
The study was HIPAA compliant and institutional review board approved. All subjects provided written informed consent. Ten healthy volunteers (five male subjects, five female subjects; mean age, 26 years ± 6 [standard deviation]) were imaged at 7.0 T by using a 24-element head coil array with three-dimensional T1-weighted MR imaging for anatomic reference, followed by T2*-weighted gradient-echo (echo time, 25 msec; repetition time, 944 msec) imaging at 232-μm in-plane resolution (0.05-mm3 pixels) in coronal and sagittal slabs (17 sections at 1 mm thick) over the hippocampus in 14 minutes. The entire study took 45 minutes.
Results:
The DGCL was consistently visible in all 10 enrolled subjects. All larger subfields were visible in excellent detail and contrast in every subject.
Conclusion:
The spatial resolution and tissue contrast at high field strength (7.0 T) MR imaging can be used to consistently reveal hippocampal morphology down to 100-μm subfields within a clinically acceptable imaging duration. This imaging technique might be used to detect cellular disarray and degenerative changes in this sensitive circuit earlier than at 1.5 T or even 3.0 T.
© RSNA, 2010
Introduction
The hippocampus, the most frequently studied temporal lobe structure, plays a major role in the formation of both spatial and declarative memory (1,2). Although it comprises separate but interconnected cellular zones that differ in their susceptibility to pathologic processes (3), of particular recent interest is its approximately 100-μm-thick dentate granule cell layer (DGCL) that generates neuronal progenitor cells and is implicated in memory formation (4–6). Hippocampal damage has been linked to epilepsy (7,8), Alzheimer disease (9), mood disorders (10–12), and schizophrenia (13–15). Together these diseases affect more than 28 million people in the United States across the entire human life span from childhood to old age (16–19). The chronic nature of these diseases underscores the importance of early diagnosis that requires noninvasive methods with sufficient sensitivity to depict response to treatments of these neurologic and psychiatric disorders.
Imaging the internal architecture of the hippocampus at the clinical 1.5- and 3.0-T field strengths is often limited by spatial resolution, contrast, and imaging duration (20). These limitations result in imaging tests that assess mesial temporal sclerosis on the basis of the presence of atrophy and hyperintense signal on T2-weighted and fluid-attenuated inversion recovery magnetic resonance (MR) images (21–23). Supporting findings, including enlarged temporal horns or atrophy of the fornix and mamillary bodies, are then necessary to bolster diagnosis in some cases. Unfortunately, these latter findings occur in advanced cases, by which time much of the internal cell layers have been destroyed. Indeed, studies in schizophrenia that show a decline in the hippocampal cell viability marker (N-acetylaspartate) levels (24) and hypermetabolism without volumetric changes (25) suggest that sensitivity to preclinical morphology may be key in establishing disease presence, disease progression, and, by implication, treatment response (26).
Early visualization of signal intensity changes that may reflect disruptions to hippocampal morphology requires high spatial resolution and contrast typically afforded only by 7.0–9.4-T field strengths and high-element-count coil arrays (20,27,28). Although together these advanced imaging capabilities facilitate approximately 200-μm spatial resolution in 10–20 minutes, neither of two recent studies (20,28) demonstrated the ability of 7.0-T MR imaging to depict the DGCL. Our goal was to establish an imaging approach to visualize the 100-μm-thick hippocampal neuron-generating DGCL consistently within a clinically feasible MR imaging duration and to assess its sensitivity by quantifying the likelihood that it will be detected in healthy young adults.
Materials and Methods
Subjects
Ten healthy adults (five male subjects, five female subjects; mean age, 26 years ± 6 [standard deviation]) were prospectively enrolled in the study between March and April 2009. They had no history of neurologic disorders and unremarkable MR imaging results, determined by a neuroradiologist (A.K., with 2 years of experience). This prospective study was Health Insurance Portability and Accountability Act compliant and institutional review board approved, and all subjects provided written informed consent.
MR Imaging
All measurements were performed with a 7.0-T imager (Magnetom; Siemens, Erlangen, Germany) by using a volume-transmit 24-element receive coil array (Nova Medical, Boston, Mass). After each subject was placed head first and in the supine position into the magnet and his or her head was braced on both sides with foam cushions to minimize and/or prevent motion, localizer images in three orthogonal orientations were obtained to verify head placement. The magnetic field homogeneity was then optimized over the whole head by using our three-dimensional chemical shift imaging–based automatic procedure that adjusted all eight (up to second order) shim currents (29). Its performance was verified by using the adjustments interface of the manufacturer. This was followed by 5 minutes of sagittal three-dimensional T1-weighted magnetization-prepared rapid acquisition gradient-echo MR imaging (repetition time msec/echo time msec/inversion time msec, 2.6/2600/1100; 9° flip angle; 144 sections at 1 mm thick; 256 × 256 matrix over a 256 × 256-mm field of view; and acceleration factor of two) for global brain morphology and to guide the T2*-weighted imaging planes, as shown in Figure 1, A.
Figure 1:
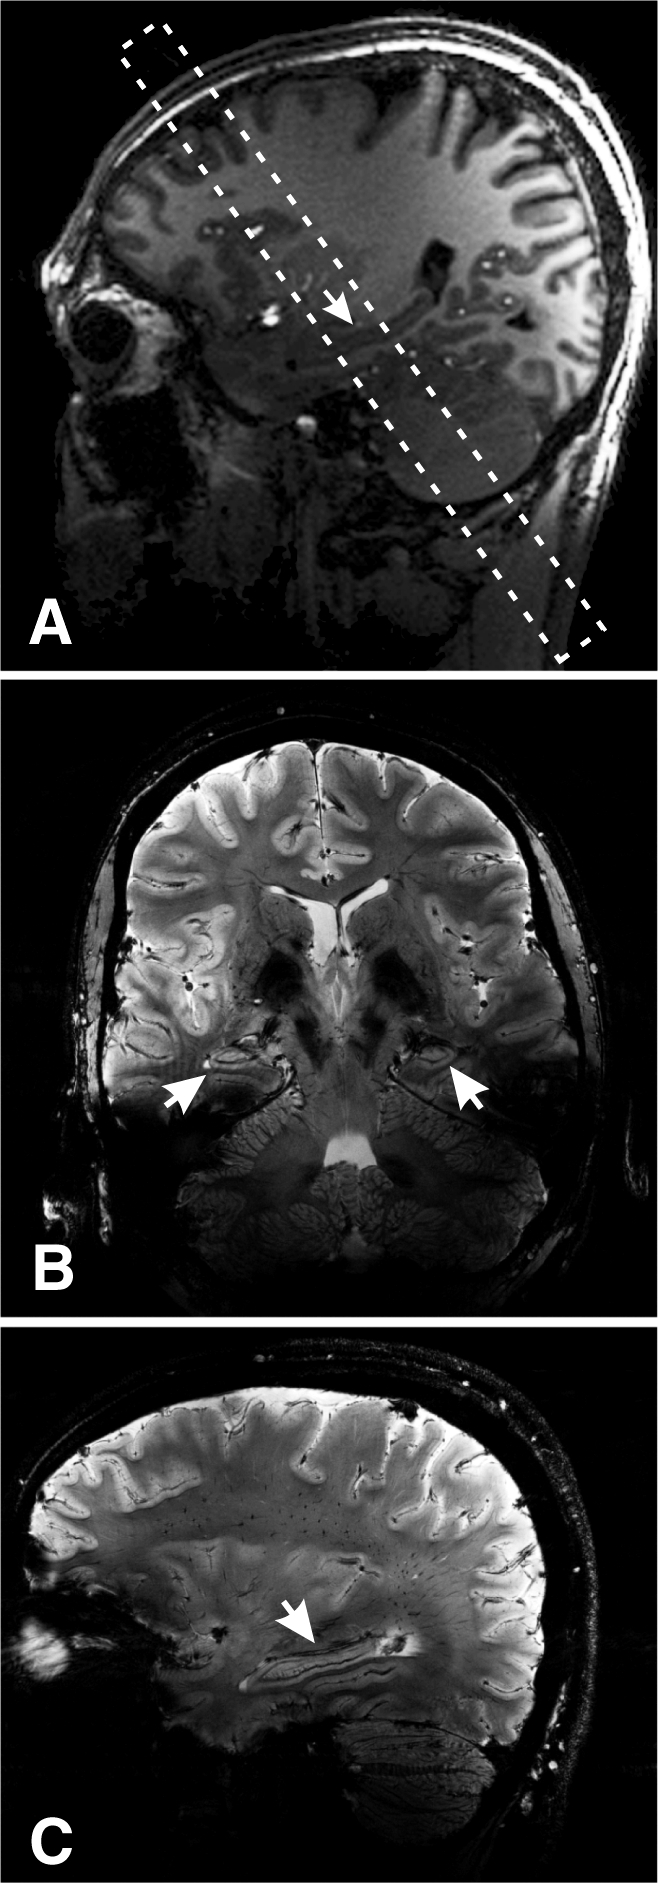
A, Sagittal T1-weighted magnetization-prepared rapid acquisition gradient-echo image superimposed with the oblique volume of interest (dashed frame) shows its position over the hippocampal midbody region (arrow). B, Coronal T2*-weighted MR image from within the volume of interest in A shows bilateral hippocampi (arrows). Note the exquisite tissue contrast and resolution. C, Sagittal T2*-weighted MR image (1-mm-thick section, 232-μm in-plane resolution) through the hippocampus (arrow). Note the contrast and high spatial resolution.
A coronal oblique volume of interest was guided onto the medial hippocampal region (Figure 1, A) and imaged with a T2*-weighted two-dimensional gradient-echo sequence for heavy contrast (944/25; 35° flip angle; 238 × 238-mm field of view; 1024 × 896 matrix; acceleration factor of one; and 17 sections at 1 mm thick [232 × 232 × 1000 μm = 0.054-μL pixels]) in 14 minutes (Fig 1, B). This sequence was chosen based on Li et al’s (30) optimizations of T2* contrast for brain imaging at 7.0 T, a contrast mechanism we chose to emphasize with a longer echo time as described by Boretius et al (31). The pixel size may still suffice to visualize the smaller DGCL due to partial volume (in 1–2 pixels) and T2* field effects. The volume of interest was then rotated into the sagittal plane onto the right hippocampus, and the acquisition was repeated (Fig 1, C). The entire protocol took less than an hour.
Results
The automatic shim procedure yielded a consistent 60-Hz ± 10 whole-head water linewidth. Given the importance of field homogeneity to T2* contrast, it was manually adjusted over the volume of interest after the positioning shown in Figure 1 with the adjustments interface of the imager by an MR spectroscopist (O.G., with 20 years of experience) down to a 40-Hz ± 5 full-width at half-height water linewidth in that volume. A coronal hippocampal region from each subject is expanded for greater detail in Figure 2 and demonstrates that all subfields down to the DGCL can be consistently visualized in every subject. Coronal and sagittal views of the hippocampus are further expanded for even greater anatomic detail in Figure 3 to show the exquisite detail afforded by the 230-μm spatial resolution (0.05 mm3) and T2* contrast that are achieved as a result of the combination of high magnetic field, field shimming, and an advanced coil.
Figure 2:

(A–J) Coronal 7.0-T T2*-weighted MR images of one hippocampus from each of the 10 subjects. On each image, the consistently smallest visible subfield is the DGCL (arrow in each frame). Here the cell layer within the dentate gyrus interlocks with cornu ammonis (CA) regions 3 and 4. Note the variation in overall architectural pattern of the cell layer due to its teethlike structure (dentate) throughout the anterior, midbody, and posterior regions.
Figure 3:

Top: Coronal 7.0-T T2*-weighted MR image of a hippocampus shows the four CA subfields (CA1–CA4), subiculum (SB), parahippocampal gyrus (PG), hippocampal sulcus (HS), dentate gyrus (DG), alveus (AL), and the DGCL (1). Bottom: Sagittal T2*-weighted view shows the vein of superficial hippocampal sulcus (VSHS), hippocampal sulcus (HS), margo denticulatus (MD), and DGCL. Note the high contrast that the hippocampal vasculature produces on these T2*-weighted images.
Both hippocampi were identified by a neuroradiologist (A.K.) in all subjects as lobulated structures along the mesial temporal lobe between the ambient cistern and temporal horn (Figure 2). The parahippocampal gyrus present inferior to the hippocampus is connected to it by a hyperintense layer, the subiculum, that courses laterally then curves superiorly to blend with the CA (see Figs 2, 3). The layer formed by the subiculum and CA forms the outer of two interlocking C’s. The hyperintense band of the CA comprises mainly the stratum pyramidale and the thinner stratum-oriens laterally (which cannot be differentiated). The relative positions of the CAs, however, are all visible: CA1 formed at the first genu where the subiculum courses superiorly; CA2 formed at the genu where the band curves medially; CA3 formed at the genu where the narrowing band curves inferiorly; and CA4 formed where the band terminates medially. As it progresses, the C-shaped CA narrows and becomes more densely packed, reflected by slight progressive hypointensity.
The outer margin of the outer C on Figure 3 (top) is formed by a hypointense band of the alveus, a white matter structure extending superiorly and medially along the outer margin to form the hypointense fimbria. Its inner margin is a readily visible thick hypointense band of the three layers of the CA (from lateral to medial: stratum radiatum, stratum lacunosum, and stratum moleculare) and the vestigial hippocampal sulcus containing the sulcal intrahippocampal vein.
The inner interlocking C is the stratum granulosum of the dentate gyrus seen as a thin hypointense curvilinear layer parallel to the thick hypointense band formed by the vestigial hippocampal sulcus (Fig 3 [top]). The dentate gyrus was seen in every patient in Figure 2, as was the stratum moleculare of the dentate gyrus, which is the hyperintense region between the DGCL and hippocampal sulcus. The polymorphic layer of the dentate gyrus was present immediately above the DGCL but cannot be differentiated from the CA4 (Fig 3 [top]) at this or lower field strengths (9).
A sagittal image through the hippocampus (Fig 3 [bottom]) showed the vestigial hippocampal sulcus running along the hippocampus axis and the hypointense vein of superficial hippocampal sulcus within it. The margo denticulatus was noted as a thin linear structure extending laterally and superiorly. The hyperintense bands inferior to the hippocampal sulcus are the subiculum and the CA and the hyperintense band superior to the hippocampal sulcus is the stratum moleculare of the dentate gyrus (1) (Fig 3 [top]). The thin hypointense line visualized superior to the thicker hypointense hippocampal sulcus is presumed to be the DGCL on the basis of its position, 1–2-pixel (less than 200-μm) width, orientation, and signal intensity characteristics (Fig 3 [bottom]).
Discussion
This pilot study demonstrated 7.0-T neuroimaging procedures that can consistently reveal hippocampal structures such as the DGCL which is about 100 μm thick. By contrast, at the approximate 1-mm3 and 0.25-mm3 spatial resolution (and contrast) currently achievable at 1.5 and 3.0 T, respectively, within a clinically feasible imaging duration, the hippocampus often appears as a bulbous gray matter structure recognized by its anatomic location—medial to the temporal horn and lateral to the ambient cistern and midbrain (5,32). Resolution and contrast-to-noise limitations may limit differentiation of the hippocampal layers at 1.5 T and 3.0 T (the current clinical fields), restricting the utility of T2-weighted and fluid-attenuated inversion recovery MR imaging in the evaluation of mesial temporal sclerosis to only substantial pathologic changes that mark the end point of pathologic processes.
The improved resolution and contrast possible at high field strengths facilitate higher-spatial-resolution imaging of the hippocampus and its subfields than that achieved at lower field strengths (20,28). Indeed, the signal-to-noise ratio for central brain structures is known to be determined primarily by how closely the receive array fits the head, whereas in more lateral regions, higher signal-to-noise ratio is achieved by increasing the number of array elements (33). While close-fitting coils are also available for 3.0 T (34), at 7.0 T there are also intrinsic increases in overall sensitivity (35) and T2* contrast (36). The combination of a close-fitting 24-element array at 7.0 T, therefore, offers the current best resolution and contrast compared with that of clinical-grade equipment. Specifically, almost every layer of the hippocampus, from the various strata of the CA to the approximately 100-μm DGCL (5), can be consistently discerned on the coronal plane, which establishes the resolution threshold and intersubject reproducibility goals of this study.
While the biophysical underpinnings of the DGCL hypointensity are unclear, it probably reflects a combination of increased T1 due to lower cellularity and/or reduced T2* arising from increased iron content (31) and possibly also from the higher vascularity of the strata radiatum moleculare (20). This ability to visualize individual layers may facilitate earlier detection of morphologic changes, as well as a more accurate (that is, subfield-specific) volumetric analysis, as shown recently by Van Leemput et al (37). These have the potential for more reliable diagnosis of seizure foci, perhaps before they lead to mesial temporal sclerosis, as well as to examine whether other psychiatric and neurologic conditions manifest first in specific subfields that are otherwise inaccessible at 1.5-T or even 3.0-T MR imaging—the current clinical high field strength.
The ability to image the DGCL consistently in healthy subjects suggests that the resolution of our setup is sufficient. By inference, therefore, disruptions to this layer could also be detected at this but not lower field strengths (9). This finding is crucial to study pathologic conditions that have a predilection for the DGCL. For example, in Alzheimer disease, granule cell cytoskeletons are shown to contain many inclusions whose aggregation lead to neurofibrillary alteration (38) believed to contribute to the eventual cognitive deficits. Schizophrenia and temporal lobe epilepsy are associated with abnormal function and loss of gene expression of the glycoprotein reelin, proposed to aid in cell migration and detachment, which is partly responsible for the spawning of new cells in the DGCL (39,40). Finally, in depression, DGCL deterioration and reduced neurogenesis are suspected to be symptom precursors (1).
Several studies report MR imaging of the hippocampus at ultrahigh field strengths both ex vivo and in vivo. At postmortem brain imaging, Yushkevich et al (41 and Fatterpekar et al (42) depicted its architecture at exquisite contrast and resolution that emanate from the combination of (a) high field strength, (b) excellent coil filling factor, (c) absence of air-filled sinuses that alter the local susceptibility, and (d) many hours of acquisition on a motionless sample that was later available for independent coregistered histopathologic validation of the MR imaging findings. Unfortunately, none of these attributes is ever likely to be duplicated in human subjects. Consequently, perhaps, of the two reported in vivo 7.0-T studies (20,28), only one study (20) managed to show visualization of the dentate gyrus, but neither study showed visualization of the DGCL. Furthermore, neither study methodically tested the highest resolution findings to establish and quantify their reproducibility.
This current study had some limitations. First, given the resolution and contrast limitations, as well as points a–d listed in the preceding paragraph, identification of the DGCL was based on a combination of imaging presentation and prior knowledge of its anatomy including position, orientation, and thickness without independent histopathologic corroboration. Second, as a consequence, false-positive findings or false-negative findings, had there been any, cannot be identified and excluded a posteriori. Third, this feasibility study included just 10 young subjects of a fairly narrow age distribution. Fourth, the combination of high spatial resolution and long acquisition renders the sequence sensitive to even slight head motion. Although, as the data demonstrate, motion artifacts are inconspicuous in these young healthy volunteers, bracing patients without inducing discomfort may be more challenging. Finally, there are currently fewer than three dozen 7.0-T and two 9.4-T imagers worldwide. Fewer still are also equipped with high-count receive-coil arrays that are crucial to extract the most from these expensive devices (34). Compared with an installed base of many hundreds of 3.0-T and more than 10000 1.5-T imagers, the disparity may seem to lend an anecdotal air to our findings.
This study established the size threshold of the structures that can be discerned within a duration feasible for human studies with the current state-of-the-art hardware and methods. Future plans, therefore, will aim to exploit this potential in patients with diseases that are known to affect the hippocampus early in their pathogenesis, including schizophrenia, epilepsy, and mild cognitive impairment.
In conclusion, the combination of a 7.0-T field strength, an advanced coil, field shimming, a high-count receive coil array, and heavy T2*-weighted contrast was shown to consistently depict hippocampal subfields down to 100-μm spatial resolution within a clinically acceptable protocol duration. The higher resolution and contrast obtainable at this ultrahigh magnetic field compared with that at the current clinical 3.0 T and 1.5 T can, therefore, be applied to earlier detection of disease in this sensitive circuit. Furthermore, by inference, the resolution and contrast could be exploited for diagnosis and to monitor specific or subfield-targeted treatment of diseases that have a predilection for the hippocampus.
Advances in Knowledge.
The 100-μm-thin dentate granule cell layer (DGCL), often a site of early hippocampal damage, can be imaged at 7.0 T in 10–15 minutes, well within a clinically appropriate imaging duration, by using a high-count receive coil array and static magnetic field shimming.
The DGCL can be consistently imaged in healthy young adults and roughly identified in the same position when using locations of other hippocampal anatomic structures as reference points.
DGCL cellular pattern does not appear to vary substantially between male and female subjects.
Implication for Patient Care.
T2*-weighted MR imaging at 7.0 T with a sensitive multicoil receive array can resolve human hippocampal subfields as small as 100 μm, which may facilitate imaging studies of early sclerosis and other microscopic damage that is often consequent to epilepsy, Alzheimer disease, depression, and schizophrenia.
Received June 3, 2009; revision requested July 27; revision received September 26; accepted October 5; final version accepted October 15.
Authors stated no financial relationship to disclose.
Funding: This work was supported by National Institutes of Health grants (nos. NS050520, EB01015, and K24 MH01699).
See also the editorial by Marques et al and the editorial by Bryan in this issue.
Abbreviations:
- CA
- cornu ammonis
- DGCL
- dentate granule cell layer
References
- 1.Anderson P, Morris R, Amaral D, Bliss T, O’Keefe J. eds. The hippocampus book New York, NY: Oxford University Press, 2007 [Google Scholar]
- 2.Squire LR, Stark CE, Clark RE. The medial temporal lobe. Annu Rev Neurosci 2004;27:279–306 [DOI] [PubMed] [Google Scholar]
- 3.Small SA, Nava AS, Perera GM, DeLaPaz R, Mayeux R, Stern Y. Circuit mechanisms underlying memory encoding and retrieval in the long axis of the hippocampal formation. Nat Neurosci 2001;4:442–449 [DOI] [PubMed] [Google Scholar]
- 4.Kitabatake Y, Sailor KA, Ming GL, Song H. Adult neurogenesis and hippocampal memory function: new cells, more plasticity, new memories?. Neurosurg Clin N Am 2007;18:105–113 [DOI] [PMC free article] [PubMed] [Google Scholar]
- 5.Wieshmann UC, Symms MR, Mottershead JP, et al. Hippocampal layers on high resolution magnetic resonance images: real or imaginary?. J Anat 1999;195(pt 1):131–135 [DOI] [PMC free article] [PubMed] [Google Scholar]
- 6.Manganas LN, Zhang X, Li Y, et al. Magnetic resonance spectroscopy identifies neural progenitor cells in the live human brain. Science 2007;318:980–985 [DOI] [PMC free article] [PubMed] [Google Scholar]
- 7.Sawaishi Y, Sasaki M, Yano T, Hirayama A, Akabane J, Takada G. A hippocampal lesion detected by high-field 3 tesla magnetic resonance imaging in a patient with temporal lobe epilepsy. Tohoku J Exp Med 2005;205:287–291 [DOI] [PubMed] [Google Scholar]
- 8.Cendes F. Progressive hippocampal and extrahippocampal atrophy in drug resistant epilepsy. Curr Opin Neurol 2005;18:173–177 [DOI] [PubMed] [Google Scholar]
- 9.Mueller SG, Weiner MW. Selective effect of age, Apo e4, and Alzheimer’s disease on hippocampal subfields. Hippocampus 2009;19:558–564 [DOI] [PMC free article] [PubMed] [Google Scholar]
- 10.McKinnon MC, Yucel K, Nazarov A, MacQueen GM. A meta-analysis examining clinical predictors of hippocampal volume in patients with major depressive disorder. J Psychiatry Neurosci 2009;34:41–54 [PMC free article] [PubMed] [Google Scholar]
- 11.Videbech P, Ravnkilde B. Hippocampal volume and depression: a meta-analysis of MRI studies. Am J Psychiatry 2004;161:1957–1966 [DOI] [PubMed] [Google Scholar]
- 12.Block W, Traber F, von Widdern O, et al. Proton MR spectroscopy of the hippocampus at 3 T in patients with unipolar major depressive disorder: correlates and predictors of treatment response. Int J Neuropsychopharmacol 2009;12:415–422 [DOI] [PubMed] [Google Scholar]
- 13.Kegeles LS, Shungu DC, Anjilvel S, et al. Hippocampal pathology in schizophrenia: magnetic resonance imaging and spectroscopy studies. Psychiatry Res 2000;98:163–175 [DOI] [PubMed] [Google Scholar]
- 14.Narr KL, Thompson PM, Szeszko P, et al. Regional specificity of hippocampal volume reductions in first-episode schizophrenia. Neuroimage 2004;21:1563–1575 [DOI] [PubMed] [Google Scholar]
- 15.Olbrich HM, Valerius G, Rusch N, et al. Frontolimbic glutamate alterations in first episode schizophrenia: evidence from a magnetic resonance spectroscopy study. World J Biol Psychiatry 2008;9:59–63 [DOI] [PubMed] [Google Scholar]
- 16.National Institutes of Health Alzheimer’s disease fact sheet Bethesda, Md: National Institutes of Health, 2008 [Google Scholar]
- 17.National Institutes of Health Mood disorders fact sheet Bethesda, Md: National Institutes of Health, 2007 [Google Scholar]
- 18.National Institutes of Health Schizophrenia fact sheet Bethesda, Md: National Institutes of Health, 2007 [Google Scholar]
- 19.Targeting epilepsy: improving the lives of people with one of the nation’s most common neurological conditions. Centers for Disease Control and Prevention Web site. http://www.cdc.gov/NCCdphp/publications/AAG/epilepsy.htm. Updated January 29, 2009 Accessed May 2009.
- 20.Thomas BP, Welch EB, Niederhauser BD, et al. High-resolution 7T MRI of the human hippocampus in vivo. J Magn Reson Imaging 2008;28:1266–1272 [DOI] [PMC free article] [PubMed] [Google Scholar]
- 21.Neumeister A, Wood S, Bonne O, et al. Reduced hippocampal volume in unmedicated, remitted patients with major depression versus control subjects. Biol Psychiatry 2005;57:935–937 [DOI] [PubMed] [Google Scholar]
- 22.Tae WS, Kim SS, Lee KU, Nam EC, Kim KW. Validation of hippocampal volumes measured using a manual method and two automated methods (FreeSurfer and IBASPM) in chronic major depressive disorder. Neuroradiology 2008;50:569–581 [DOI] [PubMed] [Google Scholar]
- 23.Bremner JD, Narayan M, Anderson ER, Staib LH, Miller HL, Charney DS. Hippocampal volume reduction in major depression. Am J Psychiatry 2000;157:115–118 [DOI] [PubMed] [Google Scholar]
- 24.Deicken RF, Pegues M, Amend D. Reduced hippocampal N-acetylaspartate without volume loss in schizophrenia. Schizophr Res 1999;37:217–223 [DOI] [PubMed] [Google Scholar]
- 25.Schobel SA, Lewandowski NM, Corcoran C, et al. Differential targeting of the CA1 subfield of the hippocampal formation by schizophrenia and related psychotic disorders. Arch Gen Psychiatry 2009;66:938–946 [DOI] [PMC free article] [PubMed] [Google Scholar]
- 26.Fischl B, Stevens AA, Rajendran N, et al. Predicting the location of entorhinal cortex from MRI. Neuroimage 2009;47:8–17 [DOI] [PMC free article] [PubMed] [Google Scholar]
- 27.Vaughan T, Delabarre L, Snyder C, et al. 9.4T human MRI: preliminary results. Magn Reson Med 2006;56:1274–1282 [DOI] [PMC free article] [PubMed] [Google Scholar]
- 28.Theysohn JM, Kraff O, Maderwald S, et al. The human hippocampus at 7 T–in vivo MRI. Hippocampus 2009;19:1–7 [DOI] [PubMed] [Google Scholar]
- 29.Hu J, Javaid T, Arias-Mendoza F, Liu Z, McNamara R, Brown TR. A fast, reliable, automatic shimming procedure using 1H chemical-shift-imaging spectroscopy. J Magn Reson B 1995;108:213–219 [DOI] [PubMed] [Google Scholar]
- 30.Li TQ, van Gelderen P, Merkle H, Talagala L, Koretsky AP, Duyn J. Extensive heterogeneity in white matter intensity in high-resolution T2*-weighted MRI of the human brain at 7.0 T. Neuroimage 2006;32:1032–1040 [DOI] [PubMed] [Google Scholar]
- 31.Boretius S, Kasper L, Tammer R, Michaelis T, Frahm J. MRI of cellular layers in mouse brain in vivo. Neuroimage 2009;47:1252–1260 [DOI] [PubMed] [Google Scholar]
- 32.Koretsky AP. New developments in magnetic resonance imaging of the brain. NeuroRx 2004;1:155–164 [DOI] [PMC free article] [PubMed] [Google Scholar]
- 33.Porter JR, Wright SM, Reykowski A. A 16-element phased-array head coil. Magn Reson Med 1998;40:272–279 [DOI] [PubMed] [Google Scholar]
- 34.Wiggins GC, Triantafyllou C, Potthast A, Reykowski A, Nittka M, Wald LL. 32-channel 3 Tesla receive-only phased-array head coil with soccer-ball element geometry. Magn Reson Med 2006;56:216–223 [DOI] [PubMed] [Google Scholar]
- 35.Vaughan JT, Garwood M, Collins CM, et al. 7T vs. 4T: RF power, homogeneity, and signal-to-noise comparison in head images. Magn Reson Med 2001;46:24–30 [DOI] [PubMed] [Google Scholar]
- 36.Novak V, Abduljalil AM, Novak P, Robitaille PM. High-resolution ultrahigh-field MRI of stroke. Magn Reson Imaging 2005;23:539–548 [DOI] [PMC free article] [PubMed] [Google Scholar]
- 37.Van Leemput K, Bakkour A, Benner T, et al. Automated segmentation of hippocampal subfields from ultra-high resolution in vivo MRI. Hippocampus 2009;19:549–557 [DOI] [PMC free article] [PubMed] [Google Scholar]
- 38.Wakabayashi K, Hansen LA, Vincent I, Mallory M, Masliah E. Neurofibrillary tangles in the dentate granule cells of patients with Alzheimer’s disease, Lewy body disease and progressive supranuclear palsy. Acta Neuropathol 1997;93:7–12 [DOI] [PubMed] [Google Scholar]
- 39.Toro CT, Deakin JF. Adult neurogenesis and schizophrenia: a window on abnormal early brain development?. Schizophr Res 2007;90:1–14 [DOI] [PubMed] [Google Scholar]
- 40.Frotscher M, Haas CA, Forster E. Reelin controls granule cell migration in the dentate gyrus by acting on the radial glial scaffold. Cereb Cortex 2003;13:634–640 [DOI] [PubMed] [Google Scholar]
- 41.Yushkevich PA, Avants BB, Pluta J, et al. A high-resolution computational atlas of the human hippocampus from postmortem magnetic resonance imaging at 9.4 T. Neuroimage 2009;44:385–398 [DOI] [PMC free article] [PubMed] [Google Scholar]
- 42.Fatterpekar GM, Naidich TP, Delman BN, et al. Cytoarchitecture of the human cerebral cortex: MR microscopy of excised specimens at 9.4 Tesla. AJNR Am J Neuroradiol 2002;23:1313–1321 [PMC free article] [PubMed] [Google Scholar]