SUMMARY
Diffuse optical tomography, also known as near infrared tomography, has been under investigation, for non-invasive functional imaging of tissue, specifically for the detection and characterization of breast cancer or other soft tissue lesions. Much work has been carried out for accurate modeling and image reconstruction from clinical data. NIRFAST, a modeling and image reconstruction package has been developed, which is capable of single wavelength and multi-wavelength optical or functional imaging from measured data. The theory behind the modeling techniques as well as the image reconstruction algorithms is presented here, and 2D and 3D examples are presented to demonstrate its capabilities. The results show that 3D modeling can be combined with measured data from multiple wavelengths to reconstruct chromophore concentrations within the tissue. Additionally it is possible to recover scattering spectra, resulting from the dominant Mie-type scatter present in tissue. Overall, this paper gives a comprehensive over view of the modeling techniques used in diffuse optical tomographic imaging, in the context of NIRFAST software package.
Keywords: diffuse optical tomography, near infrared imaging, inverse problems, image reconstruction, finite element methods
1. INTRODUCTION
Near Infrared (NIR) optical imaging is a technique where NIR light (650–900 nm) is injected through optical fibers positioned on the surface of the imaging volume of interest and the emergent light is measured at other locations on the same tissue surface using either other fibers or a detector array, such as a charge coupled device (CCD) [1–8]. The measured data, the so-called boundary data in modeling studies, are then used together with a transport-model-based image reconstruction algorithm, to derive either the intrinsic optical properties of the tissue at the applied wavelengths, or to estimate functional information such as total hemoglobin content and water fraction from measurements at multiple wavelengths [9, 10]. Additionally the use of exogenous contrast agents (fluorescent agents) has shown the ability to improve both the contrast and specificity of the imaging technique [11–16]. In this approach, often referred to as fluorescence optical tomography, a site- or function-specific contrast agent is injected into the volume, which when excited by light at the target wavelength, produces an emission with a different spectral response. The efficiency of this process is a function of the molecular photophysical quantum yield for fluorescence emission and the concentration of the agent itself, and the microenvironment around the fluorophore is well known to alter these parameters for many biologically relevant agents.
NIR optical tomography is also referred to as diffuse optical tomography, because the transport of light in tissue at these wavelengths, over distances greater than a few scattering lengths, becomes nearly isotropic and is well predicted by photon diffusion. Application of diffuse tomography has become an important research tool and the technique is potentially emerging as a non-invasive imaging method for quantifying brain function in children and adults [7, 17–21], as well as for characterizing and detecting breast cancer [2, 4, 6, 22–27].
Since the introduction of NIR tissue measurements [28], a number of light propagation models and image reconstruction algorithms have been developed by various research groups. The majority of the proposed methods and modeling algorithms fall into two categories of being either analytical [29–32] or numerical [32–34] methods. Analytical models have the advantage of being computationally fast but suffer from the disadvantage of being limited to simple geometries with nearly homogeneous interior values. Conversely, numerical models have the potential of being able to model both complex geometries as well as complex heterogeneous media, but have historically required longer computation times. But, perhaps the most promising reason for adoption of numerical approaches is to facilitate the combination of NIR tomography with standard clinical imaging systems, using pre-defined tissue geometries as the input domain [35, 36].
This paper outlines the main components of a software package, Near Infrared Fluorescence and Spectral Tomography (NIRFAST), which simulates light propagation in biological tissue based on the finite element method (FEM). The theory behind the use of FEM for the problem formulation is described as well as some of the image reconstruction algorithms contained in the toolbox. Examples of simulation studies executed within the NIRFAST framework are also provided. The ability to incorporate realistic breast tissue volumes is demonstrated. A freeware distribution of the software is available for interested users. This work is important in describing the algorithms developed at Dartmouth for NIR imaging and their incorporation into the software package. Moreover, this paper also describes the main components of algorithms used in forward and inverse solutions for NIR diffuse optical tomographic imaging. As the NIRFAST frame work for solving the inverse problem is a least-squares (LS)-based approach, this paper limits itself to LS-based approaches for inverse problems.
2. THEORY
2.1. The forward model
2.1.1. Diffusion approximation for optical imaging
It is generally accepted that if the magnitude of the isotropic fluence within tissue is significantly larger than the directional flux magnitude, the light field is ‘diffuse’, which occurs when the scattering interactions dominate over absorption and the region of interest is far from sources and boundaries provided the light fluence is not rapidly changing with time (i.e. such as in the sub-picosecond time frame). This assumption allows a transition from the radiative transport equation, which is used to describe an anisotropic light field, to the diffusion equation approximation, which is used for isotropic fluence fields [32]. The diffusion approximation in the frequency domain is given by
| (1) |
where μa and are absorption and reduced scattering (or transport scattering) coefficients, respectively, q0(r, ω) is an isotropic source term, Φ(r, ω) is the photon fluence rate at position r, and modulation frequency is the diffusion coefficient and cm(r) is the speed of light in the medium at any point, defined by c0/n(r), where n(r) is the index of refraction at the same point and c0 is the speed of light in vacuum.
The air–tissue boundary is represented by an index-mismatched type III condition (also known as Robin or mixed boundary condition), in which the fluence at the edge of the tissue exits but does not return [37, 38]. The flux leaving the external boundary is equal to the fluence rate at the boundary weighted by a factor that accounts for the internal reflection of light back into the tissue. This relationship is described in the following equation:
| (2) |
where ξ is a point on the external boundary, n̂ is the outward pointing normal, and A depends upon the relative refractive index (RI) mismatch between the tissue domain Ω and air. Here, A can be derived from Fresnel’s law:
| (3) |
where ϑc = arcsin(nAIR/n1), the angle at which total internal reflection occurs for photons moving from region Ω with RI n1 to air with RI nAIR, and R0 = (n1/nAIR − 1)2/(n1/nAIR + 1)2. At the external boundaries, RI is generally assumed to be equal to that of free space, so that nAIR = 1.
2.1.2. Finite element implementation
When the RI is homogeneous, the finite element discretization of a volume, Ω, can be obtained by subdividing the domain into D elements joined at V vertex nodes. In finite element formalism, the fluence at a given point, Φ(r), is approximated by the piecewise continuous polynomial function, , where Ωh is a finite dimensional subspace spanned by basis functions {ui (r); i = 1 … V} chosen to have limited support.
The problem of solving for Φh becomes one of sparse matrix inversion: in this work, we use a bi-conjugate gradient stabilized iterative solver. As developed previously [39, 40], the diffusion equation (1) in the FEM framework can be expressed as a system of linear algebraic equations:
| (4) |
where the matrices K(κ), C((μa + iω/cm)) and F have entries given by
| (5) |
| (6) |
| (7) |
and the source vector q0 has terms
| (8) |
The source term is defined as a distributed, Gaussian source, matching the intensity profile at the tip of the optical fiber. The source may therefore be defined over more than one element. Because the source is assumed to be spherically isotropic in the standard diffusion model, the simulation accurately reflects experimental data when the source is centered one transport scattering distance within the outer boundary, δΩ. Several studies have been completed to show that this type of representation can well approximate directed sources, as long as the values of fluence rate nearest the source are not used (i.e. within 3–5 reduced scattering lengths) [41].
2.2. The inverse model
2.2.1. Single wavelength case
The goal of the inverse problem is the recovery of optical properties μ = (μa, κ) at each FEM node within the domain using measurements of light fluence from the tissue surface. This inversion can be achieved using a modified-Tikhonov minimization. If the measured fluence at the tissue surface is represented by ΦM and the calculated data using the forward solver by ΦC, then the standard Tikhonov minimization function is given by
| (9) |
where NM is the total number of measurements obtained from the imaging device, NN is the number of FEM nodes (the unknowns). λ is the Tikhonov regularization parameter, which is defined as the ratio of the variances of the measurement data and optical properties [42]. μ0 is either the initial estimate of the optical properties, generally obtained by data-calibration procedure [43], or it can be an a priori optical property distribution, which may be available. It has been found that if the initial estimate, μ0, is not too far from the actual parameter distribution, this term can be ignored [2, 44].
The minimization with respect to μ in Equation (9), involves setting the first-order derivative equal to zero, ∂χ2/∂μ = 0 and ignoring higher order terms. The first-order condition is given by
| (10) |
The derivative matrix (∂ΦC/∂μ) is known as the Jacobian matrix, J, and is also referred to as the weight or sensitivity matrix. Using this linear approximation of the problem, and solving it as an iterative scheme gives
| (11) |
where δμ is the update for the optical properties and δΦ is the data-model misfit at the current iteration. I is the identity matrix. A slight modification of Equation (11) is often applied during iteration, known as the Levenberg-Marquardt (LM) procedure, where δμ = μi − μ0 is assumed in which case
| (12) |
where λ̄≡2λ. Also note that in LM procedure, the λ̄ is monotonically decreased over the iterations [42]. The Jacobian defines the relationship between changes in boundary data ΦC, resulting from small changes in optical properties μ = (μa, κ). Since both amplitude and phase data types are available from a frequency domain system, and since the problem considers the effects of absorption and diffusion, the structure of the Jacobian becomes
| (13) |
where δln Ii/δκj and δln Ii/δμaj are the sub-matrices that define the change in log of amplitude of the ith measurement arising from a small change in κ and μa at the jth reconstructed node respectively; δθi/δκj and δθi/δμaj are the sub-matrices that give the change in phase of the ith measurement arising from a change in κ and μa at the jth node, respectively. The Jacobian is formed using the adjoint method [45], which takes advantage of reciprocity to construct the matrix entries from forward model fluence calculations, and is highly efficient.
As indicated in Equation (13), the Jacobian involves both diffusion coefficient (κ) and absorption (μa) derivatives, so the Jacobian in the update equation (Equation (12)) is normalized by a diagonal matrix (G) consisting of the initial estimate of the optical properties (μ0), such that
| (14) |
G = diag([κ; μa]); moreover, λ is implemented in a modified LM algorithm [46], where it is initialized as the variances ratio and is systematically reduced at each iteration (factor of 100.25 and scaled by maximum of diagonal of JT J). The iterative procedure is repeated until experimental data matches with modeled data to a tolerance level, which is typically set as 2%.
Once the optical properties are obtained at each wavelength, the chromophore concentrations are calculated using a constrained LS fit to the Beer’s law relation:
| (15) |
where ε is the molar absorption spectra of the tissue’s absorbing chromophores and c is the concentration of these chromophores. Oxy-hemoglobin (HbO2), deoxy-hemoglobin (Hb) and water are assumed to be the main absorbers and their molar absorption spectra have been obtained experimentally [47]. By fitting for the concentrations, total hemoglobin is calculated as HbT = HbO2 + Hb (in µM), and oxygen saturation as StO2 = HbO2/HbT × 100 (in %).
Similarly, the spectrum of tissue has been shown to fit well to an empirical approximation to Mie scattering theory [48, 49] given by
| (16) |
Equation (16) is used to estimate model parameters scatter amplitude (a) and scatter power (b) with wavelength in µm [49]. The coefficient has units of mm−1. Both the scattering power and amplitude depend on the scattering center size and number density and may reflect variations in tissue composition due to different cellular, organelle and structural sizes/densities [50]. Typically, large scatterers have lower b and a values, whereas small scatterers have higher b and a values.
2.2.2. Spectral constraint case
Instead of reconstructing for optical properties at each wavelength and then applying Equations (15) and (16) in a post-processing step, these constraints can be incorporated into the reconstruction directly to estimate oxy-hemoglobin, deoxy-hemoglobin, water, scatter amplitude and scatter power, thus reducing the parameter space from 14 unknown parameter images (μa and ] at seven wavelengths) to five parameter images [9, 47]. In this approach the measurements at all wavelengths (see Section 3.2) are coupled together and the relationships in Equations (15) and (16) are combined to create a new set of equations. The Jacobian in Equation (13), instead of relating the changes in optical properties to measured amplitude and phase, now relates the changes in concentrations and scattering parameters directly to changes in log of amplitude and phase data. The new Jacobian becomes
| (17) |
From Equation (15), ∂μa = ε∂c is used so that substituting for ∂μa/∂c, yields
| (18) |
where ⊗ refers to the Kronecker tensor product. Similarly
| (19) |
Rewriting
results in
and . Substituting these expressions in Equation (19) leads to
| (20) |
Similarly, expressions can be derived relating Jb,λ and Jκ,λ for scatter power b [51]. The overall system of equations is then from these relationships:
| (21) |
The Jacobian in (21) has the dimensional size equal to the number of wavelengths times number of measurements per wavelength by number of nodes times number of wavelength-independent parameters. The same LM regularization scheme can be applied as in the conventional approach; however, since the size of the Jacobian is now dominated by the larger number of unknowns, the Moore–Penrose generalized inverse is used, which is more suitable for under-determined problems [52]. This gives rise to an update equation [42]:
| (22) |
where μ is now the update vector consisting of the chromophore concentration and the scattering parameter. As in the single wavelength case, since the Jacobian involves derivatives of different chromophore as well as scattering parameter, the Jacobian in the update equation (Equation (22)) is normalized by a diagonal matrix (G) consisting of the initial estimates of the unknown parameters.
The starting value for regularization is typically chosen as 10 empirically; values in the range 1000–1 are used to recover reasonable images with either simulated or experimental data. Convergence was considered to occur when the projection error was less than 2% of previous iteration value. A set of reasonable physiological constraints were also added by fixing the water to be less than 100% and the scatter parameters to be non-negative and to have an upper limit of 6.2mm−1. These constraints are applied only at the boundary of their respective ranges; which only occurs in cases of very noisy data. In the majority of reconstructions, the constraints do not come into play, as the updated values at each iteration lie well within the acceptable range. The approach is easily extendable to additional wavelengths and chromophores, as has recently been shown [16, 50].
2.2.3. Reconstruction basis
A number of different strategies for defining the reconstruction basis are possible, including using a second finite element mesh or a cartesian pixel basis [53, 54]. The choice of reconstruction basis allows for computational efficiency, which serves to reduce the number of unknowns in the inversion algorithm. The problem at hand is twofold: (1) The forward problem requires that the volume of interest be subdivided into an adequate number of sub-domains, which allows for sufficient resolution to yield accurate solutions of the computed fields whereas (2) a reduction in the number of reconstructed unknowns decreases the ill-posedness of the problem in the inversion algorithm. Additionally, it is often the case that the number of measurements is substantially smaller than the number of forward model nodes, making the inversion highly ill-conditioned. Thus, reducing the number of unknowns in the inversion is also important for improving the matrix conditioning. These issues are addressed by defining a separate reconstruction basis (different from the meshes used to generate the FEM field solutions), upon which the unknown parameters are updated. Within this framework a pixel basis that defines a set of regularly spaced pixels for the update of the quantities of interest is used.
3. IMAGE RECONSTRUCTION EXAMPLES
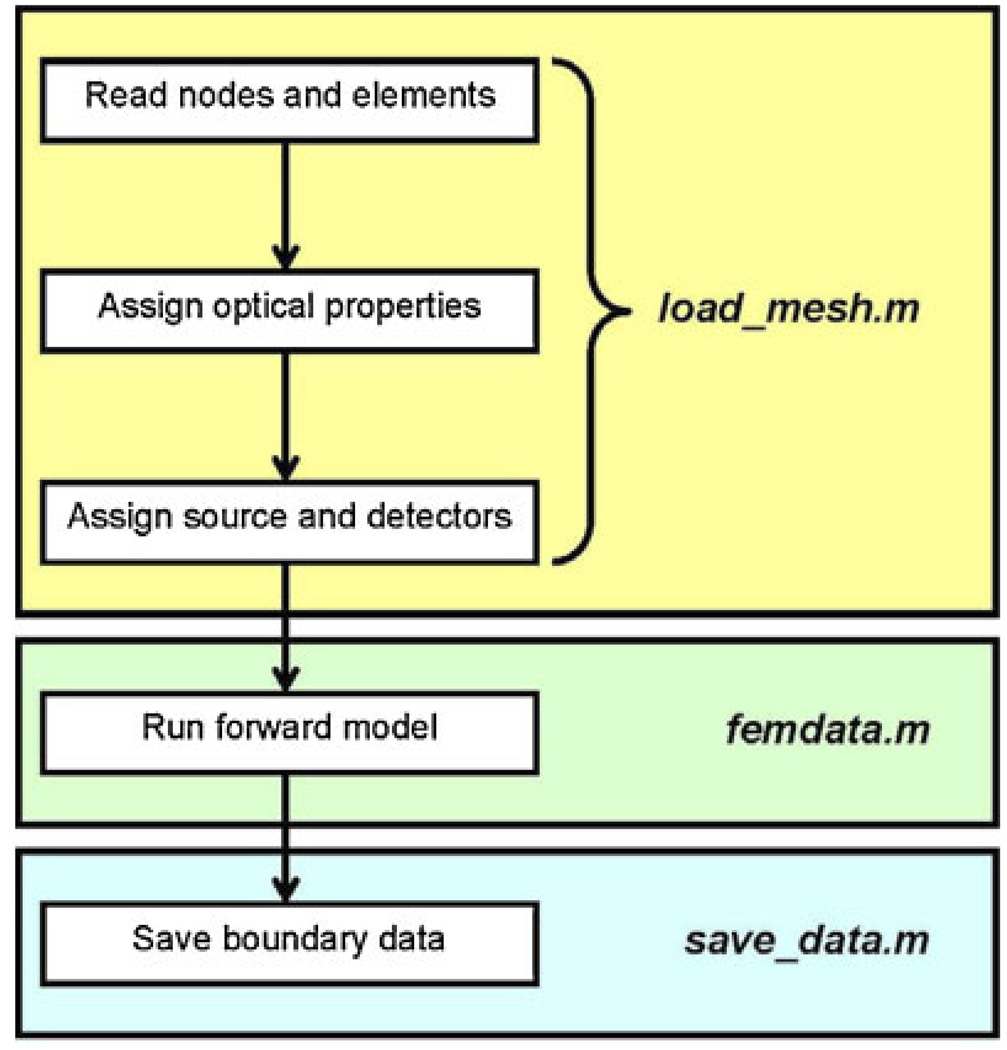
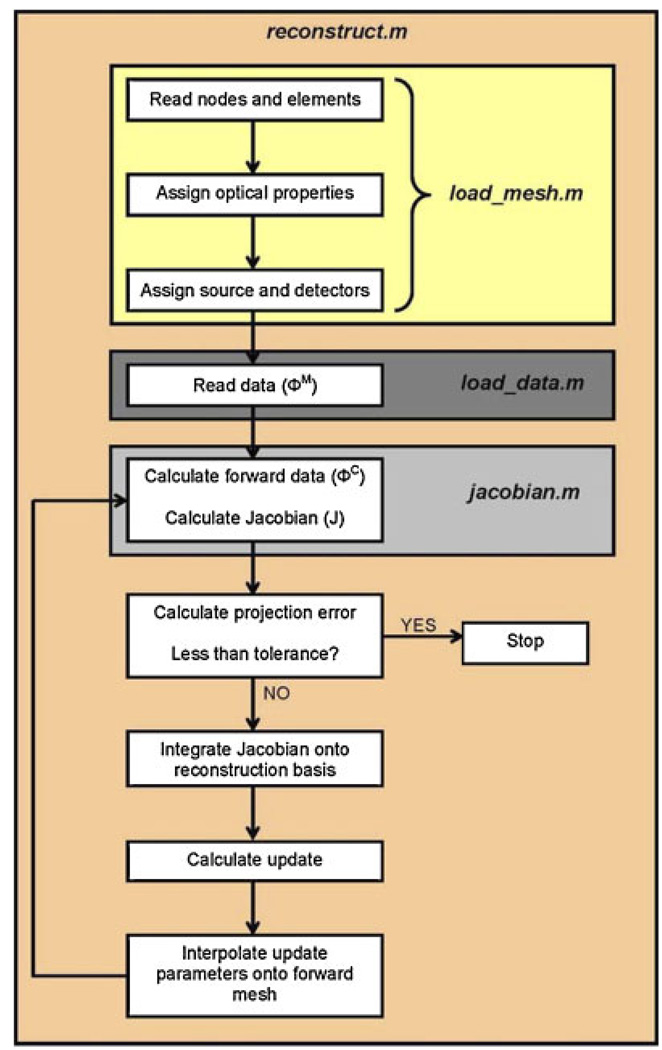
In order to demonstrate the capabilities of NIRFAST, the following section will describe and demonstrate four simulation studies, which include 2D and 3D results for the single wavelength absorption and reduced scatter case as well as the multiple wavelength spectral image reconstruction. In each example, a total of 16 equidistant light source and detector fibers were assumed around the external periphery of the model, whereby for each fiber applying a source, the other 15 fibers were used for data collection, giving rise to a total of 240 boundary data points. The modulation frequency was assumed at 100 MHz, which gives rise to both amplitude and phase changes in the measured boundary data, yielding a total of 480 measurements at each wavelength applied. This configuration was chosen to simulate an experimental system used for clinical studies [23]. Flowcharts indicating the specific commands within the software package NIRFAST, together with the generalized organization of the routines are shown in Chart 1 and Chart 2. In all cases presented, randomly generated noise of 1% in amplitude and one degree in phase was added to the simulated data to represent a realistic case and all quoted computation times are based on a 3.7 GHz work-station running Linux Redhat with 4 GB of RAM. This amount of noise is typical of our clinical systems [35, 55].
Chart 1.
Flowchart outlining the sequence and commands used in NIRFAST for a generalized forward model.
Chart 2.
Flowchart outlining the sequence and commands used in NIRFAST for a generalized image reconstruction problem.
3.1. 2D single wavelength case
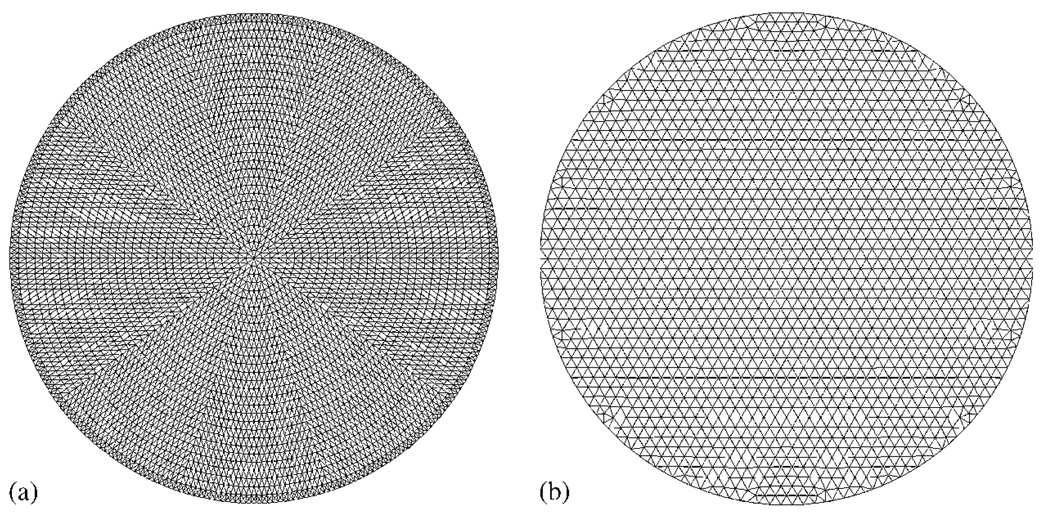
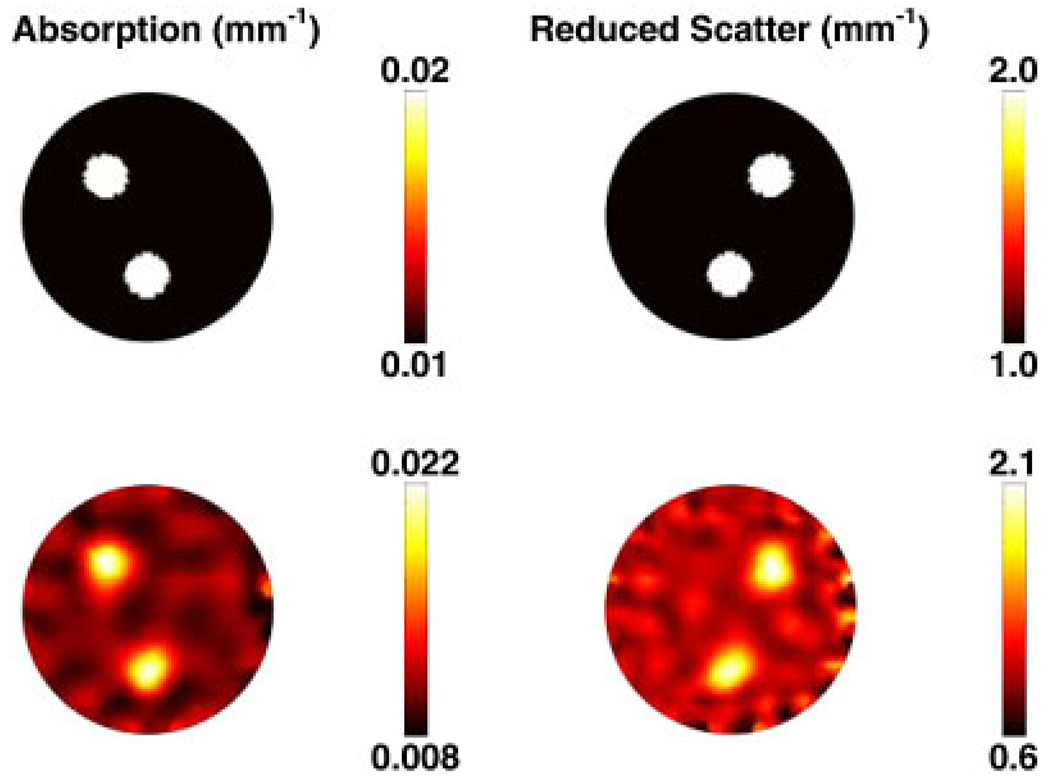
In order to generate simulated data, a 2D circular mesh consisting of 4931 nodes corresponding to 9570 linear triangular elements was used, as shown in Figure 1(a). The radius of the model was 43 mm with background optical properties of μa = 0.01 mm−1 and . Within this mesh, three anomalies were placed, each having a radius of 7.5 mm, located as shown in Figure 2 (top row). Each anomaly was assumed as having either two times the background absorption or reduced scatter or two times the background absorption and reduced scatter. The boundary data were generated with a computational time of 5 s.
Figure 1.
A typical high-resolution 2D: (a) field and (b) inverse finite element mesh are shown.
Figure 2.
Top row: The forward model based on the mesh in Figure 1(a) shows the true distribution of internal optical properties. Bottom row: Reconstructed images of optical properties are shown using single wavelength data. The images were reconstructed from noisy simulated data obtained with the mesh in Figure 1(b).
To avoid inverse crime in image reconstruction [56], a second mesh was generated, with fewer degrees of freedom consisting of a total of 1785 nodes corresponding to 3418 linear triangular elements. The initial bulk homogeneous guess of optical properties was calculated using the calibration methods outlined elsewhere [2, 57], which were found to be μa = 0.011 mm−1 and . Simultaneous images of absorption and scatter were reconstructed using the algorithm outline in Section 2.2.1 with an initial regularization parameter of λ = 10 and a reconstruction pixel basis of 30 × 30 (x and y spatial discretization) uniform cells. Images were formed, iteratively until the difference between the forward data and the reconstructed data did not improve by more than 2% when compared with the previous iteration. The final images, corresponding to 14 iterations, are shown in Figure 2 (bottom row) and were obtained with a computation time of 76 s.
3.2. 2D spectral case
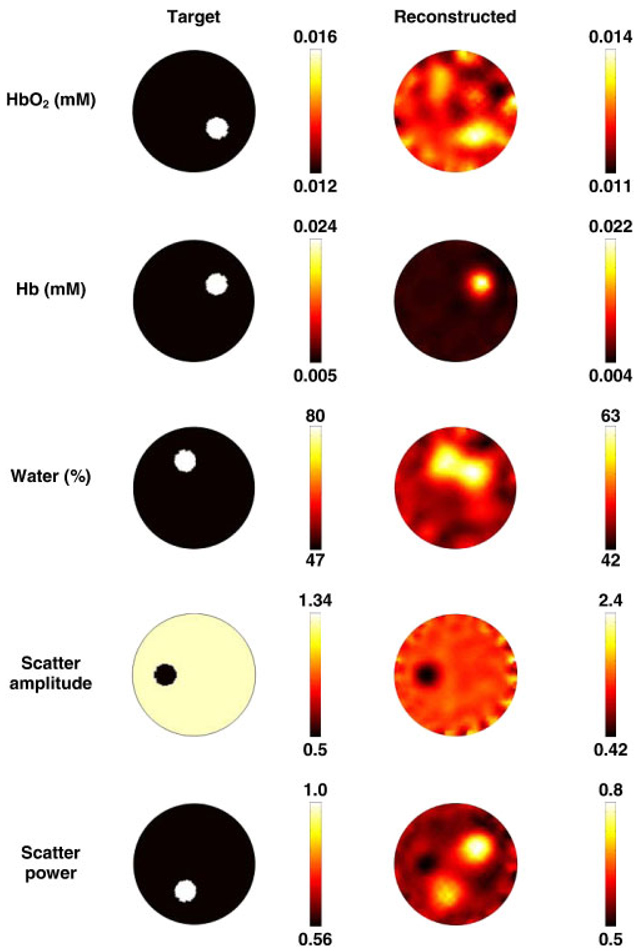
In order to generate the simulated data, the same forward mesh Figure 1(a), was used, but it was assumed to contain spectral chromophore properties. The background properties were assigned to have those typical of breast adipose tissue [58], which consisted of oxygenated hemoglobin (HbO) of 0.012 mM, deoxygenated hemoglobin (Hb) of 0.005 mM, water content (H2O) of 47%, scattering amplitude of 1.34 and scatter power of 0.56. Within this mesh, five anomalies, each having a radius of 7.5 mm, were placed as shown in Figure 3. Each anomaly was assumed to have values typical of tumor [25]. The boundary data were generated for a total of seven wavelengths (661, 735, 761, 785, 808, 826 and 849 nm) with a computational time of 47s.
Figure 3.
The forward model based on the mesh in Figure 1(a) shows the true chromophore distributions (left column) and the reconstructed spectral images (right column) using seven wavelengths of measurement data. The images are reconstructed from noisy simulated data, using the mesh shown in Figure 1(b). The oxy-hemoglobin (HbO2) and deoxy-hemoglobin (Hb) scale is in units of mM, and water is in volume percentage. The scatter amplitude is in units of mm−1.
For image reconstruction, a second mesh having the same dimensions as the forward mesh was used but with the lower resolution. Simultaneous images of all chromophores were reconstructed using the algorithm outline in Section 2.2.2 with an initial regularization parameter of λ = 10 and a reconstruction pixel basis of 30 × 30 uniform cells. Images were reconstructed, iteratively until the difference between the forward data and the reconstructed data did not reduce by more than 2% as compared with the previous iteration. The final images, corresponding to nine iterations, are shown in Figure 3 and were recovered with a computation time of 580 s.
3.3. 3D breast model single wavelength case
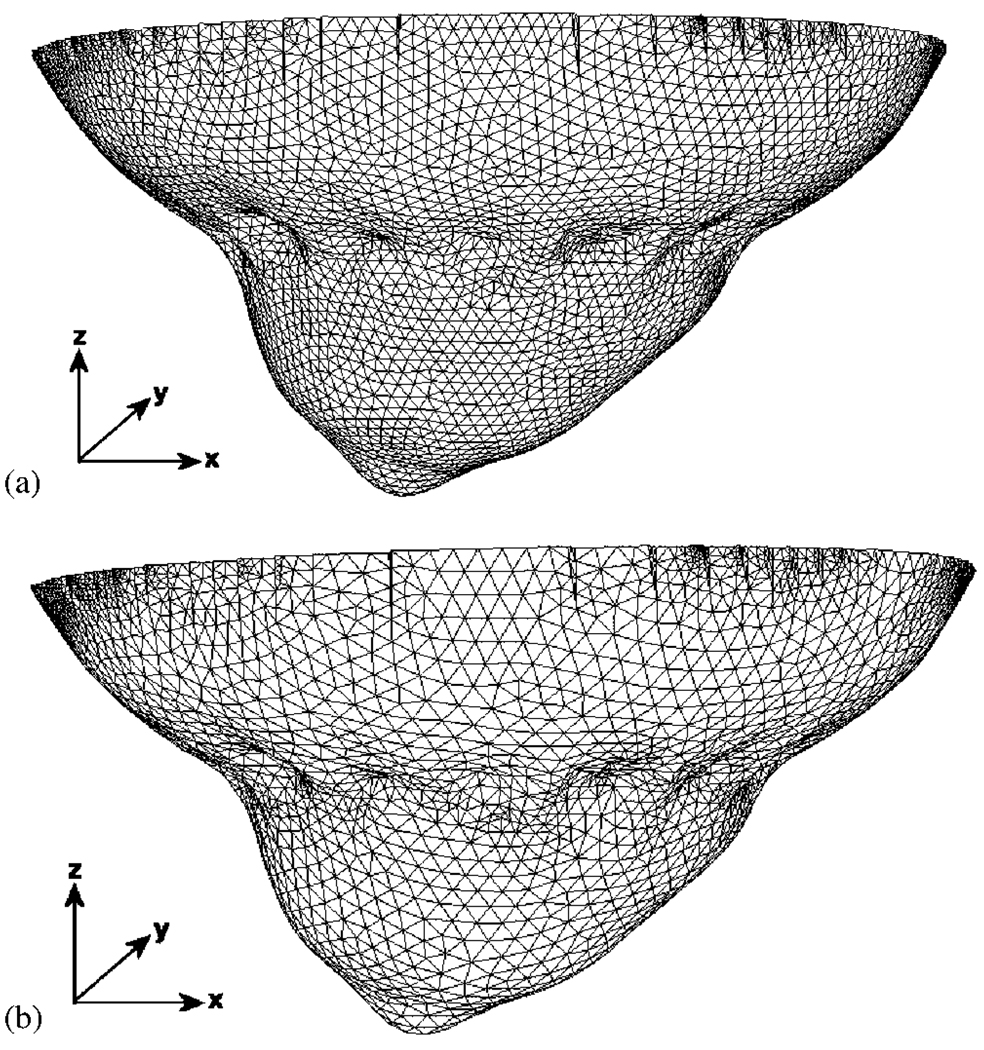
A volume mesh of a female breast of a volunteer was created from surface image data that was acquired using a 3D surface camera [Rainbow 3D Camera, Genex Technologies, Kensington MD]. The 3D camera projects structural illumination patterns onto the object and calculates the 3D surface profile described by over 300 000 data points [59]. A volume mesh was then generated using the Delaunay algorithm, and had dimensions of 130 × 136 × 60mm (x, y and z coordinates). To calculate the deformation due to 16 equally spaced optical fibers being applied at the mid-plane of the breast, i.e. z = −30mm, it is assumed that each optical fiber pushed the breast so that the final breast diameter at z = −30mm is 70mm, and that the diameter of each optical fiber is 6mm. The modeled elastic properties of tissue were assumed as isotropic and homogeneous with Young’s Modulus of 20 kPa [60] and Poisson’s ratio of 0.495 [61]. Further, it was assumed that the topmost part of the mesh, i.e. z = 0mm was not allowed to move since it is connected to the chest. Using this applied displacement as a boundary condition, the deformation at all nodes due to the application of the optical fibers was calculated and applied to the model [62]. Two sets of meshes were created, namely one for the forward problem, Figure 4(a), which consisted of 44 032 nodes corresponding to 215 208 linear tetrahedral elements and one for the inverse problem, Figure 4(b), which consisted of 18 374 nodes corresponding to 75 215 linear tetrahedral elements.
Figure 4.
A 3D finite element mesh of a breast, (a) with indented impressions where the fibers are in contact with the tissue and (b) with lower node resolution for image reconstruction.
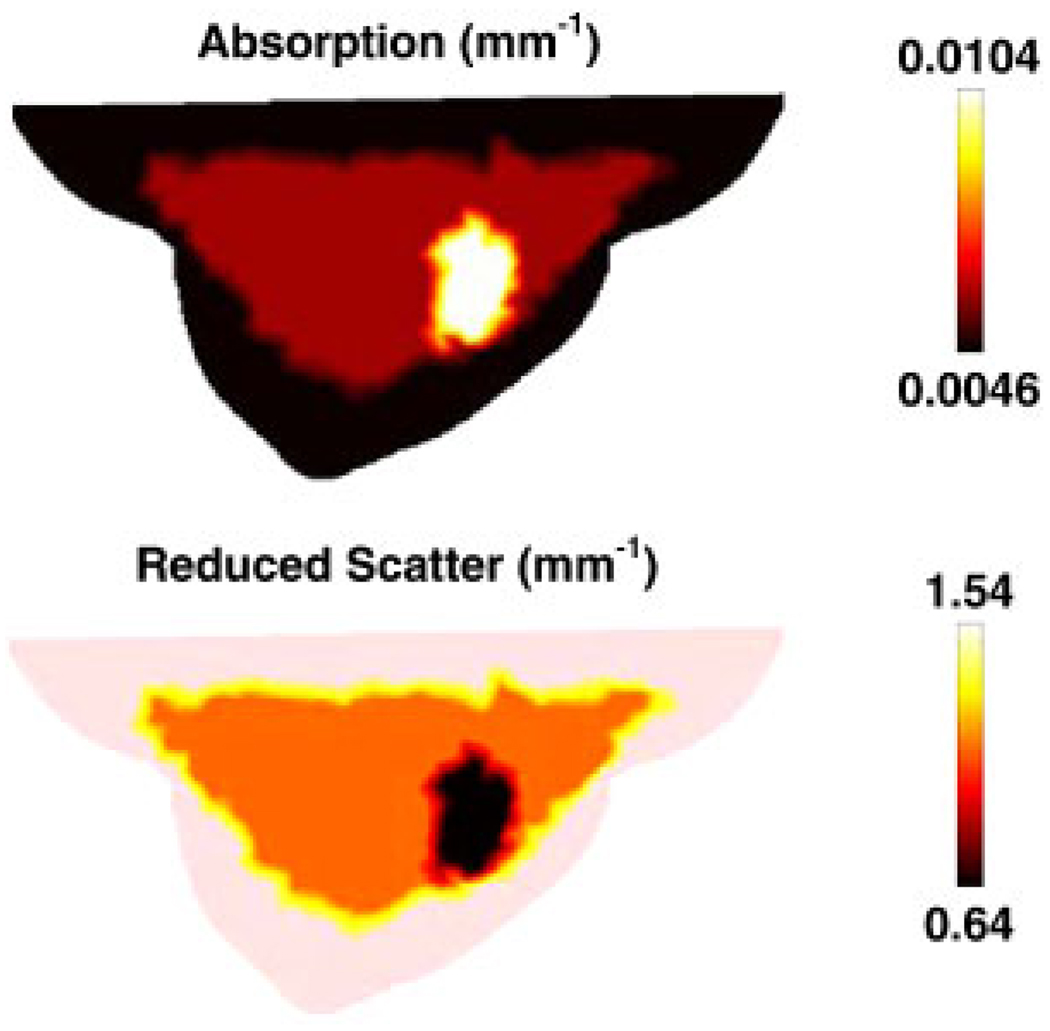
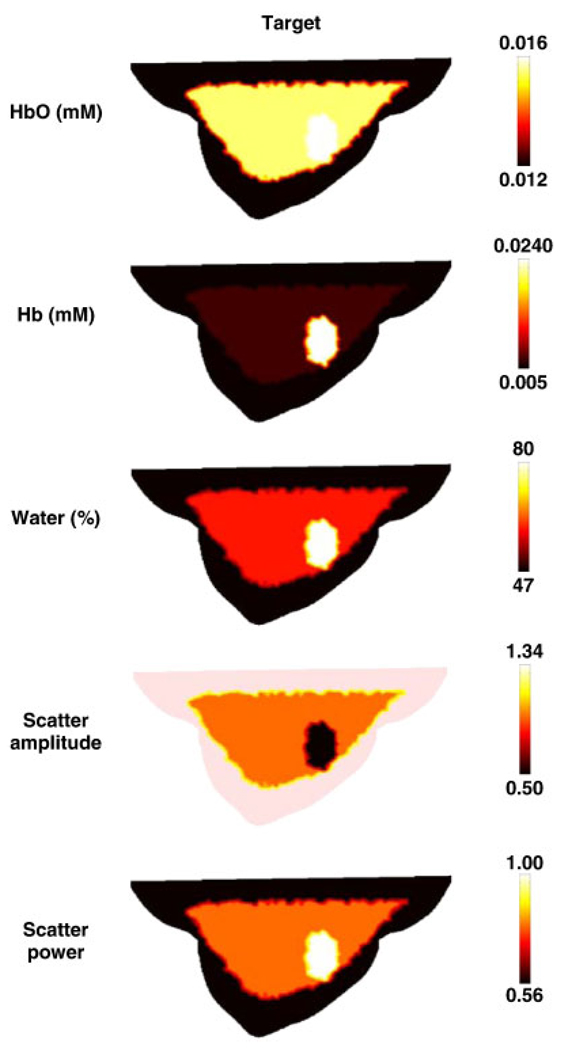
To generate simulated data, at a single wavelength of 785 nm, the forward model was assumed to contain three different regions of adipose, glandular and tumor tissue, Figure 5, whose optical properties are given in Table I. Using extinction coefficients and scattering relationships, Equations (15) and (16), the optical properties at 785 nm were calculated (Table I) and used to generate the boundary data with a computational time of 215.
Figure 5.
A sagittal cross-section of the breast model shown in Figure 4(a) illustrating the assigned optical properties at 785 nm.
Table I.
The chromophore concentration of different regions within the 3D breast model, and the corresponding optical properties at 785 nm are listed.
| Adipose | Glandular | Tumor | |
|---|---|---|---|
| HbO (mM) | 0.012 | 0.015 | 0.016 |
| Hb (mM) | 0.005 | 0.066 | 0.024 |
| Water (%) | 71 | 70 | 40 |
| Scatter amplitude | 1.34 | 0.94 | 0.5 |
| Scatter power | 0.56 | 0.79 | 1 |
| μa at 785 nm (mm−1) | 0.0046 | 0.0059 | 0.0104 |
| at 785 nm (mm−1) | 1.53 | 1.1381 | 0.6369 |
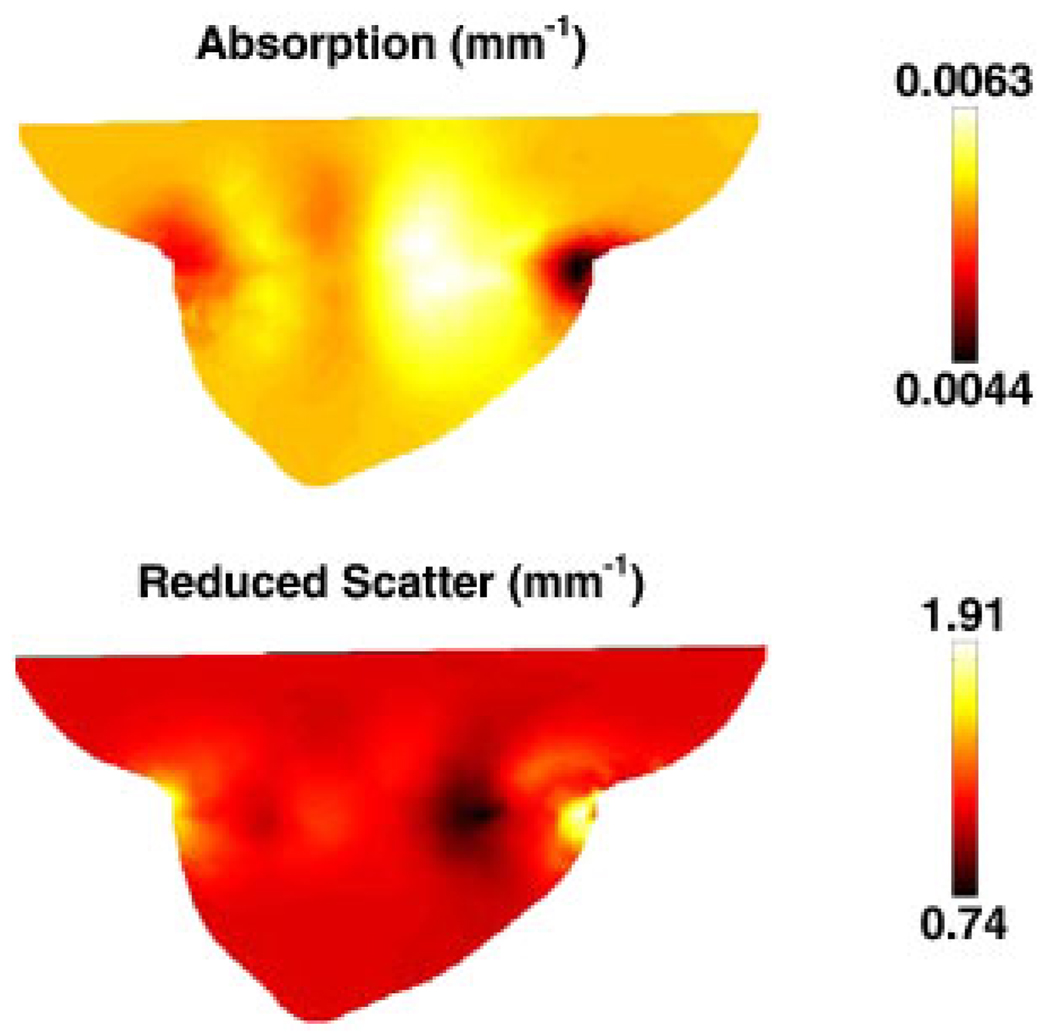
For image reconstruction, a second mesh, Figure 4(b) was used. Simultaneous images of absorption and scatter were reconstructed using the algorithm outline in Section 2.2.1 with an initial regularization parameter of λ = 10 and a reconstruction pixel basis of 25 × 25 × 25 (x, y and z spatial discretization) uniform cells. Images were formed iteratively until the difference between the forward data and the reconstructed data did not improve more than 2% as compared with the previous iteration. The final images, corresponding to 12 iterations are shown in Figure 6, with a computation time of 2600 s.
Figure 6.
Sagittal cross-sections of the reconstructed images of optical properties, using single wavelength data at 785 nm. The images are reconstructed from noisy simulated data using the mesh shown in Figure 4(b).
3.4. 3D breast model spectral case
In order to generate the simulated data, the same forward mesh, Figure 4(a) was used, but it was assumed to contain spectral chromophore properties. The assigned background properties were those defined in Table I [58] and shown in Figure 7. The boundary data were generated for a total of seven wavelengths (661, 735, 761, 785, 808, 826 and 849 nm) with a computational time of 1500 s.
Figure 7.
Sagittal cross-sections of the breast model shown in Figure 4(a), with the test distributions of chromophores and scattering values. Units are as listed in Figure 3.
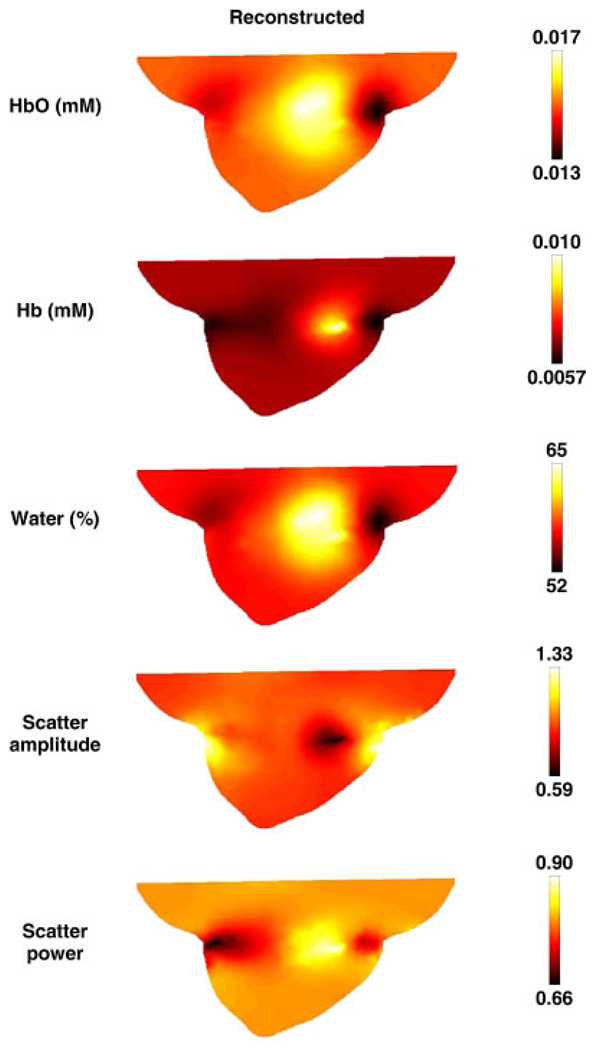
For image reconstruction, a second mesh was used, as shown in Figure 4(b). Simultaneous images of all chromophores were reconstructed using the algorithm outline Section 2.2.2 with an initial regularization parameter of λ = 10 and a reconstruction pixel basis of 25 × 25 × 25 (x, y and z spatial discretization) uniform cells. Images were reconstructed iteratively until the difference between the forward data and the reconstructed data did not improve by more than 2% as compared with the previous iteration. The final images, corresponding to 11 iterations, are shown in Figure 8 and were obtained with a computation time of 18 000 s.
Figure 8.
Sagittal cross-sections of the reconstructed spectral images using multiple wavelength data. The images were reconstructed on noise added data using the mesh shown in Figure 4(b). Units are as listed in Figure 3.
4. DISCUSSION
The 2D images reconstructed using single wavelength data are shown in Figure 2, together with the original target distributions. The results show that good separation between the absorption and reduced scatter is achieved; however, the reconstructed values show an over estimation of the absorption by 10% and the reduced scatter by 5%. The ability to separate both the optical absorption and reduced scatter is important and is known to be non-unique when intensity only boundary data are applied [63]. Specifically, it has been shown that the use of absorption and reduced scatter-based imaging can provide useful pathophysiological information regarding the breast tissue being imaged [25, 50]; therefore, accurate quantitative separation of these two parameters is crucial for adequate clinical application. It should also be noted that given a set of boundary data that comprises of both intensity and phase of the measurement, it is imperative to incorporate the normalization of the Jacobian by the initial estimate of the optical properties, Equation (14).
For the case of using spectral data and reconstruction, Figure 3, the best reconstructed image occurs for deoxy-hemoglobin while cross talk is evident in the reconstructed images of water and scatter power. The concentration of the recovered value for oxy- and deoxy-hemoglobin is within 0.002 mM of the target, and the reconstructed concentration of the water content is accurate to within 17%. It has been previously shown that there exists a set of optimum wavelengths that should in theory yield the best data for the separation of chromophores and scattering properties [10]; however, the choice of wavelengths in this example has been limited to those available within a clinical imaging system developed at Dartmouth [64]. The superior reconstruction of deoxy-hemoglobin is in part due to the large simulated contrast, but these levels are typical of values observed clinically [25]. This method of spectral imaging has been extensively tested in phantom studies and shown to produce superior results compared with those generated from the combination of multiple single wavelength image reconstructions [9].
The 3D images reconstructed from the breast geometry represent a realistic clinical case, in which different layers of adipose and glandular tissue have been considered together with a tumor region, Figure 5. In the first instance where a single 785 nm wavelength has been considered, the region of interest (the tumor) has been successfully recovered, Figure 6, but with lower reconstructed values of both absorption and reduced scatter. It is evident from these images, that although the information about the adipose and glandular layer is relatively poor, the recovered location of the tumor is correct even if its optical properties are not quantitatively accurate. The largest image artifacts appear at the external tissue boundaries, specifically at the locations of optical fiber contact.
The quantitative accuracy of the 3D images, as compared with 2D results has been considered previously [4, 65]. The challenges of quantitative 3D imaging are many folds and include partial volume effects, the increase in the number of unknowns as well as the 3D of photon pathways and associated sensitivity function. Several techniques have been proposed to improve the quantitative accuracy of 3D imaging such as, the use of spatial priors [22, 58, 65].
In the spectral reconstruction case, the tumor region has been successfully located in all cases with excellent recovery of the target values, Figure 8, except for deoxy-hemoglobin, which was recovered with less than 50% of the expected level. Again, although detailed information about the adipose and glandular layers are less evident, the reconstructed concentration of oxy-hemoglobin of the tumor is accurate to within 0.001 mM and the water concentration is accurate to within 15%. The recovered values for scatter amplitude and scatter power are each accurate to within 10%.
It has been previously demonstrated that small errors within the absorption and scatter images at each specific wavelength, which are then combined to create chromophore and scatter distributions, lead to large errors in recovered chromophore values [47]. Therefore, although single wavelength images may provide a good qualitative indication, the application of spectral imaging provides the quantitative accuracy required for clinical applications.
It is also worth noting that the modeled tumor does not lie exactly within the imaging plane, which is the plane where the optical fibers were applied. This situation is realistic, because it is likely that breast tissue undergoes internal deformation due to its varying mechanical properties of soft tissue, upon the application of external pressures via the optical fibers.
5. CONCLUSIONS
Near Infrared (NIR) optical tomography has been under investigation for over 20 years with several applications having reached the advanced development stages for in vivo imaging. The research team at Dartmouth has over the years developed and validated both instrumentation techniques and computational models and algorithms to allow clinically useful breast imaging, specifically for the detection, monitoring and characterization of cancer.
In this work, the software package, NIRFAST, is presented and the development of modeling techniques and reconstruction algorithms that have been developed by the group are outlined. The capability of NIRFAST has been demonstrated through 2D and 3D examples that allow single wavelength, as well as multi-wavelength spectral modeling and image reconstruction. Further work is under investigation to explore a general framework for the application of spatial information, which may be readily available from other imaging modalities, for example MRI or CT, that will allow more accurate and perhaps more computationally efficient image reconstruction algorithms.
NIRFAST is a MATLAB®-based toolbox, which also includes capabilities for multi-modal NIR imaging [42], fluorescence [16], and bioluminescence [66] imaging. NIRFAST is currently available for academic research for free, via the URL link: http://newton.ex.ac.uk/research/biomedical/hd/NIRFAST.html
ACKNOWLEDGEMENTS
This work has been sponsored by the National Cancer Institute through grants RO1CA78734, PO1CA80139, as well as the Engineering and Physical Sciences Research Council, U.K. The authors would like to acknowledge and thank the help and contributions from Ben Brooksby, Ph.D. and Heng Xu, Ph.D. to the development of the package.
Contract/grant sponsor: National Cancer Institute; contract/grant numbers: RO1CA78734, PO1CA80139
Contract/grant sponsor: Engineering and Physical Sciences Research Council, U.K.
REFERENCES
- 1.Gibson AP, Hebden JC, Arridge SR. Recent advances in diffuse optical imaging. Physics in Medicine and Biology. 2005;50:R1–R43. doi: 10.1088/0031-9155/50/4/r01. [DOI] [PubMed] [Google Scholar]
- 2.Dehghani H, Pogue BW, Poplack SP, Paulsen KD. Multiwavelength three-dimensional near-infrared tomography of the breast: initial simulation, phantom, and clinical results. Applied Optics. 2003;42(1):135–145. doi: 10.1364/ao.42.000135. [DOI] [PubMed] [Google Scholar]
- 3.McBride TO, Pogue BW, Gerety E, Poplack S, Osterberg UL, Paulsen KD. Spectroscopic diffuse optical tomography for quantitatively assessing hemoglobin concentration and oxygenation in tissue. Applied Optics. 1999;38(25):5480–5490. doi: 10.1364/ao.38.005480. [DOI] [PubMed] [Google Scholar]
- 4.Hebden JC, Veenstra HH, Dehghani H, Hillman EMC, Schweiger M, Arridge SR, Delpy DT. Three dimensional time-resolved optical tomography of a conical breast phantom. Applied Optics. 2001;40:3278–3287. doi: 10.1364/ao.40.003278. [DOI] [PubMed] [Google Scholar]
- 5.Hebden JC, Gibson A, Yusof RMd, Everdell N, Hillman EC, Delpy DT, Arridge SA, Austin T, Meek JH, Wyatt JS. Three-dimensional optical tomography of the premature infant brain. Physics in Medicine and Biology. 2002;47(23):4155. doi: 10.1088/0031-9155/47/23/303. [DOI] [PubMed] [Google Scholar]
- 6.Choe R, Corlu A, Lee K, Durduran T, Konecky SD, Grosicka-Koptyra M, Arridge SR, Czerniecki BJ, Fraker DL, DeMichele A, Chance B, Rosen MA, Yodh AG. Diffuse optical tomography of breast cancer during neoadjuvant chemotherapy: a case study with comparison to MRI. Medical Physics. 2005;32:1128–1139. doi: 10.1118/1.1869612. [DOI] [PubMed] [Google Scholar]
- 7.Boas DA, Chen K, Grebert D, Franceschini MA. Improving the diffuse optical imaging spatial resolution of the cerebral hemodynamic response to brain activation in humans. Optics Letters. 2004;29(13):1506–1508. doi: 10.1364/ol.29.001506. [DOI] [PubMed] [Google Scholar]
- 8.Hillman EMC, Hebden JC, Schweiger M, Dehghani H, Schmidt FEW, Delpy DT, Arridge SR. Time resolved optical tomography of the human forearm. Physics in Medicine and Biology. 2001;46:1117–1130. doi: 10.1088/0031-9155/46/4/315. [DOI] [PubMed] [Google Scholar]
- 9.Srinivasan S, Pogue BW, Jiang S, Dehghani H, Paulsen KD. Spectrally constrained chromophore and scattering NIR tomography provides quantitative and robust reconstruction. Applied Optics. 2005;44(10):1858–1869. doi: 10.1364/ao.44.001858. [DOI] [PubMed] [Google Scholar]
- 10.Corlu A, Choe R, Durduran T, Lee K, Schweiger M, Arridge SR, Hillman EMC, Yodh AG. Diffuse optical tomography with spectral constraints and wavelength optimization. Applied Optics. 2005;44(11):2082–2093. doi: 10.1364/ao.44.002082. [DOI] [PubMed] [Google Scholar]
- 11.Zacharakis G, Kambara H, Shih H, Ripoll J, Grimm J, Saeki Y, Weissleder R, Ntziachristos V. Volumetric tomography of fluorescent proteins through small animals in vivo. Proceedings of the National Academy of Sciences of the United States of America. 2005;102:18252–18257. doi: 10.1073/pnas.0504628102. [DOI] [PMC free article] [PubMed] [Google Scholar]
- 12.Ntziachristos V, Chance B. Probing physiology and molecular function using optical imaging: applications to breast cancer. Breast Cancer Research. 2001;3(1):41–46. doi: 10.1186/bcr269. [DOI] [PMC free article] [PubMed] [Google Scholar]
- 13.Ntziachristos V. Fluorescence molecular imaging. Annual Review of Biomedical Engineering. 2006;8:1–33. doi: 10.1146/annurev.bioeng.8.061505.095831. [DOI] [PubMed] [Google Scholar]
- 14.Milstein AB, Oh S, Webb KJ, Bouman CA, Zhanng Q, Boas DA, Millane RP. Fluorescence optical diffusion tomography. Applied Optics. 2003;42(16):3081–3094. doi: 10.1364/ao.42.003081. [DOI] [PubMed] [Google Scholar]
- 15.Davis SC, Pogue BW, Dehghani H, Paulsen KD. Contrast-detail analysis characterizing diffuse optical fluorescence tomography image reconstruction. Journal of Biomedical Optics Letters. 2005;10(5):050501. doi: 10.1117/1.2114727. [DOI] [PubMed] [Google Scholar]
- 16.Davis SC, Dehghani H, Wang J, Jiang S, Pogue BW, Paulsen KD. Image-guided diffuse optical fluorescence tomography implemented with Laplacian-type regularization. Optics Express. 2007;15(7):4066–4082. doi: 10.1364/oe.15.004066. [DOI] [PubMed] [Google Scholar]
- 17.Zeff BW, White BR, Dehghani H, Schlaggar BL, Culver JP. Retinotopic mapping of adult human visual cortex with high-density diffuse optical tomography. Proceedings of the National Academy of Sciences of the United States of America. 2007;104:12169–12174. doi: 10.1073/pnas.0611266104. [DOI] [PMC free article] [PubMed] [Google Scholar]
- 18.Leung TS, Tachtsidis I, Smith M, Delpy DT, Elwell CE. Measurement of the absolute optical properties and cerebral blood volume of the adult human head with hybrid differential and spatially resolved spectroscopy. Physics in Medicine and Biology. 2006;51:703–717. doi: 10.1088/0031-9155/51/3/015. [DOI] [PubMed] [Google Scholar]
- 19.Austin T, Hebden JC, Gibson AP, Branco G, Yusof R, Arridge SR, Meek JH, Delpy DT, Wyatt JS. Three-dimensional optical imaging of blood volume and oxygenation in the preterm brain. Neuroimage. 2006;31:1426–1433. doi: 10.1016/j.neuroimage.2006.02.038. [DOI] [PubMed] [Google Scholar]
- 20.Xu H, Springett R, Dehghani H, Pogue BW, Paulsen KD, Dunn JF. MRI coupled Broadband Near Infrared Tomography System for Small Animal Brain Studies. Applied Optics. 2005;44(11):2177–2188. doi: 10.1364/ao.44.002177. [DOI] [PubMed] [Google Scholar]
- 21.Hueber DM, Franceschini MA, Ma HY, Zhang Q, Ballesteros JR, Fantini S, Wallace D, Ntziachristos V, Chance B. Non-invasive and quantitative near-infrared haemoglobin spectrometry in the piglet brain during hypoxic stress, using a frequency-domain multidistance instrument. Physics in Medicine and Biology. 2001;46(1):41–62. doi: 10.1088/0031-9155/46/1/304. [DOI] [PubMed] [Google Scholar]
- 22.Brooksby B, Jiang S, Dehghani H, Pogue BW, Paulsen KD, Weaver J, Kogel C, Poplack SP. Combining near infrared tomography and magnetic resonance imaging to study in vivo breast tissue: implementation of a Laplacian-type regularization to incorporate magnetic resonance structure. Journal of Biomedical Optics. 2005;10(5):051504. doi: 10.1117/1.2098627. [DOI] [PubMed] [Google Scholar]
- 23.Poplack SP, Paulsen KD, Hartov A, Meaney PM, Pogue BW, Tosteson TD, Grove MR, Soho SK, Wells WA. Electromagnetic breast imaging: average tissue property values in women with negative clinical findings. Radiology. 2004;231:571–580. doi: 10.1148/radiol.2312030606. [DOI] [PubMed] [Google Scholar]
- 24.Pogue BW, Jiang S, Dehghani H, Kogel C, Soho S, Srinivasan S, Song X, Poplack SP, Paulsen KD. Characterization of hemoglobin, water and NIR scattering in breast tissue: analysis of inter-subject variability and menstrual cycle changes relative to lesions. Journal of Biomedical Optics. 2004;9(3):541–552. doi: 10.1117/1.1691028. [DOI] [PubMed] [Google Scholar]
- 25.Srinivasan S, Pogue BW, Jiang S, Dehghani H, Kogel C, Soho S, Gibson JJ, Tosteson TD, Poplack SP, Paulsen KD. Interpreting hemoglobin and water concentration, oxygen saturation and scattering measured in vivo by near-infrared breast tomography. Proceedings of the National Academy of Sciences of the United States of America. 2003;100(21):12349–12354. doi: 10.1073/pnas.2032822100. [DOI] [PMC free article] [PubMed] [Google Scholar]
- 26.Jiang H, Xu Y, Iftimia N, Eggert J, Klove K, Baron L, Fajardo L. Three-dimensional optical tomographic imaging of breast in a human subject. IEEE Transactions on Medical Imaging. 2001;20(12):1334–1340. doi: 10.1109/42.974928. [DOI] [PubMed] [Google Scholar]
- 27.Shah N, Cerussi A, Eker C, Espinoza J, Butler J, Fishkin J, Hornung R, Tromberg B. Noninvasive functional optical spectroscopy of human breast tissue. Proceedings of the National Academy of Sciences of the United States of America. 2001;98(8):4420–4425. doi: 10.1073/pnas.071511098. [DOI] [PMC free article] [PubMed] [Google Scholar]
- 28.Jobsis FF. Non-invasive, infra-red monitoring of cerebral and myocardial oxygen sufficiency and circulatory parameters. Science. 1977;198:1264–1267. doi: 10.1126/science.929199. [DOI] [PubMed] [Google Scholar]
- 29.Arridge SR, Schweiger M. Direct calculation of the moments of the distribution of photon time-of-flight in tissue with a finite-element method. Applied Optics. 1995;34(15):2683–2687. doi: 10.1364/AO.34.002683. [DOI] [PubMed] [Google Scholar]
- 30.Schotland JC. Continuous-wave diffusion imaging. Journal of the Optical Society of America A—Optics Image Science and Vision. 1997;14(1):275–279. [Google Scholar]
- 31.Ripoll J, Ntziachristos V, Culver JP, Pattanayak DN, Yodh AG, Nieto-Vesperinas M. Recovery of optical parameters in multiple-layered diffusive media: theory and experiments. Journal of the Optical Society of America A—Optics, Image Science, and Vision. 2001;18(4):821–830. doi: 10.1364/josaa.18.000821. [DOI] [PubMed] [Google Scholar]
- 32.Arridge SR. Optical tomography in medical imaging. Inverse Problems. 1999;15(2):R41–R93. [Google Scholar]
- 33.Dehghani H, Pogue BW, Jiang S, Poplack S, Paulsen KD. Proceedings of the SPIE. vol. 4955. San Jose, CA: 2003. Optical images from pathophysiological signals within breast tissue using three-dimensional near-infrared light. [Google Scholar]
- 34.Hielscher AH, Bartel S. Use of penalty terms in gradient-based iterative reconstruction schemes for optical tomography. Journal of Biomedical Optics. 2001;6(2):183–192. doi: 10.1117/1.1352753. [DOI] [PubMed] [Google Scholar]
- 35.Brooksby B, Jiang S, Kogel C, Doyley M, Dehghani H, Weaver JB, Poplack SP, Pogue BW, Paulsen KD. Magnetic resonance-guided near-infrared tomography of the breast. Review of Scientific Instruments. 2004;75(12):5262–5270. [Google Scholar]
- 36.Carpenter CM, Pogue BW, Jiang S, Dehghani H, Wang X, Paulsen KD, Wells WA, Forero J, Kogel C, Weaver JB, Poplack SP, Kaufman PA. Image-guided optical spectroscopy provides molecular-specific information in vivo: MRI-guided spectroscopy of breast cancer hemoglobin, water and scatterer size. Optics Letters. 2007;32(8):933–935. doi: 10.1364/ol.32.000933. [DOI] [PubMed] [Google Scholar]
- 37.Schweiger M, Arridge SR, Hiroaka M, Delpy DT. The finite element model for the propagation of light in scattering media: boundary and source conditions. Medical Physics. 1995;22:1779–1792. doi: 10.1118/1.597634. [DOI] [PubMed] [Google Scholar]
- 38.Dehghani H, Brooksby B, Vishwanath K, Pogue BW, Paulsen KD. The effects of internal refractive index variation in near infrared optical tomography: a finite element modeling approach. Physics in Medicine and Biology. 2003;48:2713–2727. doi: 10.1088/0031-9155/48/16/310. [DOI] [PubMed] [Google Scholar]
- 39.Paulsen KD, Jiang H. Spatially varying optical property reconstruction using a finite element diffusion equation approximation. Medical Physics. 1995;22(6):691–701. doi: 10.1118/1.597488. [DOI] [PubMed] [Google Scholar]
- 40.Arridge SR, Schweiger M, Hiraoka M, Delpy DT. A finite element approach for modeling photon transport in tissue. Medical Physics. 1993;20:299–309. doi: 10.1118/1.597069. [DOI] [PubMed] [Google Scholar]
- 41.Farrell TJ, Patterson MS, Wilson BC. A diffusion theory model of spatially resolved, steady-state diffuse reflectance for the noninvasive determination of tissue optical properties. Medical Physics. 1992;19(4):879–888. doi: 10.1118/1.596777. [DOI] [PubMed] [Google Scholar]
- 42.Yalavarthy PK, Pogue BW, Dehghani H, Paulsen KD. Weight-matrix structured regularization provides optimal generalized least-squares estimate in diffuse optical tomography. Medical Physics. 2007;34(6):2085–2098. doi: 10.1118/1.2733803. [DOI] [PubMed] [Google Scholar]
- 43.McBride TO, Pogue BW, Osterberg UL, Paulsen KD. Oxygen Transport to Tissue XXIV. Springer; 2003. Strategies for absolute calibration of near infrared tomographic tissue imaging; pp. 85–99. [DOI] [PubMed] [Google Scholar]
- 44.Brooksby B. Combining NIR tomography and MRI to improve breast tissue chromophore and scattering assessment. Hanover: Thayer School of Engineering, Dartmouth College; 2005. [Google Scholar]
- 45.Arridge SR, Schweiger M. Photon-measurement density functions. Part 2: finite-element-method calculations. Applied Optics. 1995;34:8026–8037. doi: 10.1364/AO.34.008026. [DOI] [PubMed] [Google Scholar]
- 46.Levenberg K. A method for the solution of certain nonlinear problems in least squares. The Quarterly of Applied Mathematics. 1944;2:164. [Google Scholar]
- 47.Srinivasan S, Pogue BW, Jiang S, Dehghani H, Paulsen KD. Proceedings of the SPIE. vol. 4955. San Jose, CA: 2003. Validation of hemoglobin and water molar absorption spectra in near-infrared diffuse optical tomography. [Google Scholar]
- 48.Mourant JR, Fuselier T, Boyer J, Johnson TM, Bigio IJ. Predictions sand measurements of scattering and absorption over broad wavelength ranges in tissue phantoms. Applied Optics. 1997;36(4):949–957. doi: 10.1364/ao.36.000949. [DOI] [PubMed] [Google Scholar]
- 49.van Staveren HJ, Moes CJM, van Marle J, Prahl SA, van Gemert MJC. Light Scattering in Intralipil-10% in the wavelength range of 400–1100 nm. Applied Optics. 1991;30(31):4507–4514. doi: 10.1364/AO.30.004507. [DOI] [PubMed] [Google Scholar]
- 50.Wang X, Pogue BW, Jiang S, Dehghani S, Song X, Srinivasan S, Brooksby BA, Paulsen KD, Kogel C, Poplack SP, Wells WA. Image reconstruction of effective Mie scattering parameters of breast tissue in vivo with near-infrared tomography. Journal of Biomedical Optics. 2006;11(4):041106. doi: 10.1117/1.2342747. [DOI] [PubMed] [Google Scholar]
- 51.Srinivasan S, Pogue BW, Brooksby B, Jiang S, Dehghani H, Kogel C, Poplack SP, Paulsen KD. Near-infrared characterization of breast tumors in vivo using spectrally-constrained reconstruction. Technology in Cancer Research and Treatment. 2005;5(5):513–526. doi: 10.1177/153303460500400505. [DOI] [PubMed] [Google Scholar]
- 52.Penrose R. A generalized inverse for matrices. Proceedings of the Cambridge Philosophical Society. 1955;51:406–413. [Google Scholar]
- 53.Paulsen KD, Jiang H. Enhanced frequency-domain optical image reconstruction in tissues through total-variation minimization. Applied Optics. 1996;35(19):3447–3458. doi: 10.1364/AO.35.003447. [DOI] [PubMed] [Google Scholar]
- 54.Schweiger M, Arridge SR. Optical tomographic reconstruction in a complex head model using a priori region boundary information. Physics in Medicine and Biology. 1999;44:2703–2722. doi: 10.1088/0031-9155/44/11/302. [DOI] [PubMed] [Google Scholar]
- 55.McBride TO, Pogue BW, Jiang S, Osterberg UL, Paulsen KD. Development and calibration of a parallel modulated near-infrared tomography system for hemoglobin imaging in vivo. Review of Scientific Instruments. 2001;72(3):1817–1824. [Google Scholar]
- 56.Lionheart WR. EIT reconstruction algorithms: pitfalls, challenges and recent developments. Physiological Measurement. 2004;25(1):125–142. doi: 10.1088/0967-3334/25/1/021. [DOI] [PubMed] [Google Scholar]
- 57.McBride TO, Pogue BW, Österberg UL, Paulsen KD. Strategies for absolute calibration of near infrared tomographic tissue imaging. In: Dunn JF, Swartz HM, editors. Oxygen Transport to Tissue XXI. Lengerich: Pabst; 2001. [DOI] [PubMed] [Google Scholar]
- 58.Brooksby B, Srinivasan S, Jiang S, Dehghani H, Pogue BW, Paulsen KD, Weaver J, Kogel C, Poplack SP. Spectral-prior information improves near-infrared diffuse tomography more than spatial-prior. Optics Letters. 2005;30(15):1968–1970. doi: 10.1364/ol.30.001968. [DOI] [PubMed] [Google Scholar]
- 59.Geng Z. Rainbow 3D camera—a new concept for high speed and low-cost 3D vision. Journal of Optical Engineering. 1996;35(2):376. [Google Scholar]
- 60.Krouskop TA, Wheeler TM, Kallel F, Garra BS, Hall T. Elastic moduli of breast and prostate tissues under compression. Ultrasonic Imaging. 1998;20(4):260–274. doi: 10.1177/016173469802000403. [DOI] [PubMed] [Google Scholar]
- 61.Fung YC. Mechanical Properties of Living Tissue. 2nd edn. Berlin: Springer; 1993. [Google Scholar]
- 62.Dehghani H, Doyley MM, Pogue BW, Jiang S, Geng J, Paulsen KD. Breast deformation modeling for image reconstruction in near infrared optical tomography. Physics in Medicine and Biology. 2004;49(7):1131–1146. doi: 10.1088/0031-9155/49/7/004. [DOI] [PubMed] [Google Scholar]
- 63.Arridge SR, Lionheart WRB. Nonuniqueness in diffusion-based optical tomography. Optics Letters. 1998;23(11):882–884. doi: 10.1364/ol.23.000882. [DOI] [PubMed] [Google Scholar]
- 64.McBride TO, Pogue BW, Wells WA, Jiang S, Osterberg UL, Paulsen KD, Poplack SP. Proceedings of the SPIE. vol. 4250. San Jose, CA: 2001. Near-infrared tomographic imaging of heterogeneous media—a preliminary study in excised breast tissue. [Google Scholar]
- 65.Dehghani H, Pogue BW, Jiang S, Brooksby B, Paulsen KD. Three dimensional optical tomography: resolution in small object imaging. Applied Optics. 2003;42(18):3117–3128. doi: 10.1364/ao.42.003117. [DOI] [PubMed] [Google Scholar]
- 66.Dehghani H, Davis SC, Jiang S, Pogue BW, Paulsen KD, Patterson MS. Spectrally-resolved bioluminescence optical tomography. Optics Letters. 2006;31(3):365–367. doi: 10.1364/ol.31.000365. [DOI] [PubMed] [Google Scholar]


