

Summary
The retrotrapezoid nucleus (RTN) contains non-cholinergic non-catecholaminergic glutamatergic neurons that express the transcription factor Phox2b (chemically coded or “cc” RTN neurons). These cells regulate breathing and may be central chemoreceptors. Here we explore their ultrastructure and their acid-sensitivity using two novel BAC eGFP-Phox2b transgenic mice (B/G, GENSAT JX99) in which respectively 36% and 100% of the cc RTN neurons express the transgene in complete or partial anatomical isolation from other populations of eGFP neurons.
All but one eGFP-labeled RTN neuron recorded in these mice were acid-activated in slices. These cells contained VGLUT2 mRNA and 50% contained preprogalanin mRNA (determined by single-cell PCR in the B/G mouse). Two neuronal subgroups were revealed which differed in discharge rate at pH 7.3 (Type I ~2; Type II ~4 Hz) and the degree of alkalization that silenced the cells (Type I: 7.4 – 7.6; Type II: 7.8 – 8.0). Medial to the RTN, C1 neurons recorded in a tyrosine-hydroxylase-GFP mouse were pH-insensitive between pH 6.9 – 7.5.
Ultrastructural studies demonstrated that eGFP-labeled RTN neurons were surrounded by numerous capillaries and were often in direct contact with glial cells, pericytes and the basement membrane of capillaries. Terminals contacting large proximal eGFP-dendrites formed mainly symmetric, likely inhibitory, synapses. Terminals on more distal eGFP-dendrites formed preferentially asymmetric, presumably excitatory, synapses.
In sum, C1 cells are pH-insensitive whereas cc RTN neurons are uniformly acid-sensitive. The RTN neurons receive inhibitory and excitatory synaptic inputs and may have unfettered biochemical interactions with glial cells and the local microvasculature.
Keywords: Central chemoreceptors, breathing, respiration, Phox2b, retrotrapezoid nucleus, medulla oblongata
INTRODUCTION
The term retrotrapezoid nucleus (RTN) was originally coined by Smith et al. (1989) to describe a rostral extension of the ventrolateral medullary reticular formation containing neurons that innervate the solitary tract nucleus and more caudal regions of the ventrolateral medulla. The RTN lies below the facial motor nucleus and above a portion of the ventral medullary surface believed since the 1960s to contribute to respiratory chemoreception (Mitchell et al., 1963; Loeschcke, 1982). The possibility that the RTN could contain central respiratory chemoreceptors was therefore considered by Smith et al. (1989) and this interpretation has now received substantial experimental support (Guyenet, 2008; Nattie and Li, 2008a). For instance, the RTN contains neurons that are activated by CO2 in vivo (Connelly et al., 1990b; Sato et al., 1992; Nattie et al., 1993; Teppema et al., 1994; Bodineau et al., 2000b; Mulkey et al., 2004) and the same region contains neurons that are activated by acidification in slices, including under conditions of reduced synaptic activity or action potential blockade (Mulkey et al., 2004; Putnam et al., 2004; Guyenet, 2008; Nattie and Li, 2008b). The RTN neurons that are activated by hypercapnia in vivo and those that are activated by acid in vitro have the same phenotype in rats, namely these cells are non-cholinergic, non-catecholaminergic, glutamatergic, and express high levels of the transcription factor Phox2b (Pattyn et al., 1997; Brunet and Pattyn, 2002; Stornetta et al., 2006; Mulkey et al., 2007c; Guyenet, 2008). RTN neurons with this specific phenotype are henceforth called the chemically coded RTN neurons, cc RTN neurons. Whether the region of the medulla called RTN by various investigators contains other types of neurons is unknown. The cc RTN neurons selectively fail to develop in the Phox2b27Ala/+ mouse, a model of the congenital central hypoventilation syndrome which exhibits at birth the cardinal symptoms of the human disease, namely severely depressed breathing and loss of central respiratory chemosensitivity (Dubreuil et al., 2008). This evidence stresses the importance of the cc RTN neurons in respiratory control, especially as regards the regulation of breathing by CO2. However, many questions remain unanswered, for example, whether only subsets of these neurons are acid-responsive, what type of synaptic inputs, if any, these cells receive and why these neurons have such extensive superficial dendrites (Guyenet, 2008).
To begin addressing these questions we introduce two novel BAC transgenic mouse lines in which eGFP expression is directed to Phox2b-expressing neurons. For these purposes, the first line (B/G mouse) has the advantage that eGFP is expressed by the cc RTN neurons and by no other cell type in the immediate vicinity. The disadvantage of this mouse is that only 38% of the cc RTN neurons express eGFP. The second mouse line (GENSAT JX99) has the advantage that virtually 100% of the cc RTN neurons are eGFP-positive. Its main disadvantage is that eGFP is also expressed by subsets of neighboring Phox2b-positive cholinergic motor neurons and C1 catecholaminergic neurons. Therefore, for ultrastructural studies of the cc RTN neurons we used the B/G mouse because of its anatomical selectivity and to test the pH-sensitivity of the cc RTN neurons we used both strains to minimize sampling bias.
All the eGFP-labeled RTN neurons recorded in either strain showed similar pH-sensitivity whereas C1 adrenergic neurons recorded in slices from a tyrosine-hydroxylase-GFP transgenic mouse were unresponsive to acidification under identical conditions. The ultrastructural study of the eGFP-labeled RTN neurons in the B/G mouse revealed many synaptic contacts, an unusually high local capillary density and numerous direct physical contacts with capillaries, pericytes and glial cells.
MATERIALS AND METHODS
Animal use was in accordance with NIH guidelines and approved by the University of Virginia Animal Care and Use Committee.
Phox2b-eGFP BAC transgenic mouse lines
In the present study, we used two novel lines of BAC transgenic mice in which eGFP expression was directed to Phox2b-expressing neurons. The first mouse (B/G mouse) was made on site. The second mouse (JX99) was more recently prepared by the GENSAT project at our suggestion.
Phox2b-EGFP B/G mouse
The BAC construct was made by the BAC Engineering Core Facility at the University of North Carolina (Gong et al., 2003) using mouse BAC RP23-15D10 as a template. This C57BL/6 mouse BAC covers the entire Phox2b gene plus an additional 93 kb upstream and 113 kb downstream in the genomic sequence (Fig. 1A). Homologous arms were generated by PCR from BAC RP23-15D10 with primer sets L1/L2 and R1/R2 (see Table, below). Overlap extension PCR was then performed with primer L1/R2 on these amplicons to generate multiple cloning sites (BamH1, SmaI, SalI and AflII) between homologous arms. A single mismatch was introduced in primer L2 to generate a new NcoI site. An eGFP cassette with SV40 pA signal was excised from an eGFP-containing plasmid (Clontech, Mountain View, CA) with NcoI/AflII sites and ligated between the homologous arms. Thus, after targeting, eGFP replaced the first 19 nucleotides of Phox2b, starting from ATG. To allow selection based on antibiotic resistance, a Frt-SV40-em7-Neo-pA-Frt cassette was inserted into the eGFP targeting construct at the Not I site located between eGFP and pA signals. This yielded a targeting construct in which an eGFP-Frt-Neo-FRT-pA cassette was flanked by Phox2b homologous arms (Fig. 1A). The targeting construct and BAC RP23-15D10 were transferred into recombinogenic bacteria strain. Detailed procedures for heat activation of the recombinase complex in this strain have been described elsewhere (Bouvier and Cheng, 2009). Recombinant clones were selected based on kanamycin resistance and proper integration of the targeting construct confirmed by genotyping PCR with both 5′ (F1/B6) and 3′ (F4/B12) primers. The Frt-Neo-Frt cassette was removed from the correctly targeted BAC transgene by passing the modified BAC though bacteria strain EL250, which contains arabinose-inducible FLPe recombinase. The modified BAC was transformed into DH10B bacteria, purified (MTR Scientific, Ijamsville, MD) and sequenced from the proximal 5′-UTR through the GFP coding region. The Phox2b-eGFP transgenic mice were generated by the Transgenic Mouse Core at the University of Virginia. In short, the purified BAC transgene was injected into eggs fertilized from a cross between C57BL/6 female and SJL male mice. A female transgenic mouse (strain: B6SJLF1/J) obtained from these injections was crossed to a C57BL/6 male; offspring positive for the eGFP transgene were identified by PCR (F4/B12 primers) and intercrossed to propagate the transgenic line and used for experiments reported here.
Figure 1. Targeting constructs.

Schematic of the BACs used to generate both lines of mice, the B/G (A) and the GENSAT JX99 (B). Amp, ampicillin resistance; Neo, neomycin resistance; pA, polyadenylation sequence; ATG, start codon; U, untranslated region; R6kγ, R6kγ origin of replication; RP23 15D10, parent BAC.
Phox2b-EGFP JX99 mouse
For some experiments, we also used a Phox2b-eGFP mouse (JX99) prepared contemporaneously by the GENSAT project. The general procedures used for high throughput BAC recombineering have been described (supplementary information in (Gong et al., 2003)). The GENSAT group also used BAC RP23-15D10 for generating the JX99 mouse and, as with our construct, an eGFP coding sequence with an exogenous pA signal was integrated at the start codon for Phox2b (Fig. 1B). Two differences in the BAC constructs are noteworthy. In ours, the eGFP-pA insertion removed 19 nucleotides of the endogenous exon 1, with the remainder of exon 1 following the exogenous pA site; in the GENSAT construct, the eGFP-pA cassette was incorporated immediately 5′ to the endogenous start site on exon 1, which is retained in full behind an ampicillin resistance gene and an R6kγ origin of replication derived from the pLD53.SC2 shuttle vector. It is not clear if these differences in BAC targeting constructs account for the distinct eGFP expression patterns observed in the two mouse lines (see below), or if those distinct patterns are due to different chromosomal integration sites.
Light microscopic characterization of the Phox2b-eGFP BAC transgenic mouse lines
Immunohistochemistry
The mice were deeply anesthetized with an overdose of pentobarbital (125 mg/kg) and perfused transcardially, first with 5–10 ml of heparinized phosphate buffered saline (pH 7.4) followed by 80 ml of 4% phosphate-buffered (0.1 M; pH 7.4) paraformaldehyde (Electron Microscopy Sciences, Fort Washington, PA). The brains were removed and stored in the perfusion fixative for 24–48 hours at 4°C. A series of coronal sections (50 μm) from the brain were cut using a vibrating microtome and stored in cryoprotectant solution at −20°C for up to 2 weeks (20% glycerol plus 30% ethylene glycol in 50 mM phosphate buffer, pH 7.4) awaiting histological processing. All histochemical procedures were done with free-floating sections. Tyrosine-hydroxylase was detected with a mouse antibody (1:1000, MAB318, Millipore Corp., Temecula, CA), Phox2b with a rabbit antibody (1:800, gift from J.-F. Brunet, Ecole Normale Supérieure, Paris, France) and eGFP with a chicken anti-GFP antibody (1:1000; Aves Labs Inc., Tigard, OR). These primary antibodies were detected by incubation with appropriate secondary antibodies tagged with fluorescent reporters to reveal TH (1:200 goat anti-mouse Cy3, Jackson ImmunoResearch Laboratories, Inc., West Grove, PA), Phox2b (1:200 donkey anti-rabbit Cy3, Jackson) or eGFP (1:200 donkey anti-chicken Cy2, Jackson).
Antibody characterization
The Phox2b rabbit polyclonal antibody was raised against the fourteen amino acid C-terminal sequence of the Phox2b protein, a sequence identical in rats and mice, with the addition of a tyrosine at the N-terminal end (YFHRKPGPALKTNLF) (Pattyn et al., 1997). The specificity was originally ascertained by the perfect match between the expression patterns of the protein detected by immunohistochemistry and of the mRNA detected by in situ hybridization at pre-natal stages (Pattyn et al., 1997). This specificity was further confirmed by the absence of immunoreactivity in Phox2b knock-out mice (A. Pattyn and J.-F. Brunet, personal communication). The mouse anti-TH monoclonal antibody (Chemicon) was raised against tyrosine hydroxylase purified from PC12 cells and recognizes an epitope on the regulatory N-terminus of tyrosine-hydroxylase. This antibody recognizes a protein of approximately 59–61 kDa by Western blot of rat striatum with a single band (Perez et al., 2002) and does not cross-react with dopamine-beta-hydroxylase, phenylalanine hydroxylase, tryptophan hydroxylase or phenyl ethanolamine-N-methyl transferase (Millipore Corp., MAB318 details sheet). The labeling produced in the current study was restricted to known catecholamine cell groups and seen in cell soma, dendrites and putative terminals. The chicken anti-GFP antibody (Aves Labs) was raised by immunizing chicken eggs with recombinant GFP emulsified in Freund’s adjuvant. The anti-GFP antibody identifies neurons only in GFP transgenic mice with no signal in non-GFP transgenic mice.
Cell mapping, cell counting and imaging
Cells with clearly identified nuclei were mapped and counted using a computer-assisted mapping technique based on the Neurolucida software as previously described (Stornetta and Guyenet, 1999). The Abercrombie correction (Abercrombie, 1946) was applied for total cell counts where corrected total objects counted = total objects counted × [average section thickness/(average section thickness + average object height)]. Since only objects with clearly discernible nuclei were counted, the nuclear diameter was used as the object height. The nuclei are oval with the long axis in the coronal plane; therefore their height should be roughly the same as the length of the shorter axis in the coronal plane. The Neurolucida files were exported to the NeuroExplorer software (MicroBrightfield, Colchester, VT) to count the various types of neuronal profiles within a defined area of the reticular formation. When appropriate, selections of the Neurolucida files were also exported to the Canvas 9 software drawing program (ACD Systems of America, Miami, FLA USA) for final modifications. The neuroanatomical nomenclature is after Paxinos and Franklin (Paxinos and Franklin, 2004).
Images were captured with a SensiCam QE 12-bit CCD camera (resolution 1376 × 1040 pixels, Cooke Corp., Auburn Hills, MI) or with a Zeiss AxioCam MRC 12-bit CCD camera (1388 × 1040 pixels, Carl Zeiss MicroImaging, Göttingen, Germany).
Electron microscopy of RTN neurons
Specimen preparation
Phox2b-eGFP mice from the B/G line (N = 2) were deeply anesthetized with sodium pentobarbital (125 mg/kg, i.p.) and perfused through the ascending aorta sequentially with: 1) 5–7 ml saline (0.9%) containing 100 U of heparin; and 2) 40 ml of 3.75% acrolein (Polysciences, Inc., Washington, PA) and 2% paraformaldehyde in 0.1M phosphate buffer (PB; pH 7.4). The brains were removed from the skull and postfixed in a solution containing 1.875% acrolein and 2% paraformaldehyde in PB for 30 minutes. Coronal blocks containing the RTN were cut into 40-μm-thick sections on a vibrating microtome (Vibratome; Leica, Wien, Austria) and collected in PB.
Brain sections containing the RTN were processed for eGFP immunocytochemistry using the avidin-biotin complex (ABC)-peroxidase technique as previously described (Wang et al., 2006). Briefly, free-floating sections were treated with 1% sodium borohydride in PB for 30 min and rinsed in PB. To enhance penetration, sections underwent a freeze-thaw procedure: they were placed in cryoprotectant solution (25% sucrose, 2.5% glycerol in 0.05M PB) for 15 min and briefly dipped in liquid Freon, followed by liquid nitrogen and PB. Sections then were incubated in 0.5% bovine albumin serum (BSA) in 0.1M Tris saline (pH 7.6; TS) for 30 min. rinsed in TS and placed in the anti-GFP antiserum (1:4000) in 0.1% BSA in TS for 1 day at room temperature and 1 day at 4°C. The sections then were incubated in: 1) biotinylated goat anti-chicken IgG in 0.1% BSA (1:400, Vector Laboratories, Burlingame, CA) for 30 min; (2) ABC solution (at half the recommended dilution) for 30 min.; and (3) diaminobenzidine (Aldrich, Milwaukee, WI) and H2O2 for 6 min. All steps were separated by TS washes. Sections were rinsed in PB and postfixed in 2% osmium tetroxide in PB for 1 hour, dehydrated in alcohols and propylene oxide, and embedded between two sheets of Aclar plastic (Honeywell, Morristown, NJ) in Embed 812 (Electron Microscopy Sciences, Hatfield, PA). Ultrathin sections (70 nm thick) through the RTN were cut on an ultratome (Leica Microsystems, Wetzlar, Germany). Sections were counterstained with uranyl acetate and Reynold’s lead citrate and were analyzed using a FEI Tecnai Biotwin transmission electron microscope.
Immunocytochemical analysis
Immunocytochemical analysis was performed on 2 blocks per mouse. The cellular and subcellular localization of eGFP was assessed using standard morphological characteristics (Peters et al., 1991). Briefly, somata were identified by the presence of a nucleus. Dendrites contained regular microtubule arrays and mitochondria, and usually were postsynaptic to axon terminals. Terminals had numerous small synaptic vesicles, often contacted other neuronal profiles and had minimal diameter greater than 0.2 μm. Astrocytic profiles tended to conform to the boundaries of surrounding profiles, contained glial filaments and/or lacked microtubules. Asymmetric synapses had thick postsynaptic densities and wide synaptic clefts whereas symmetric synapses had less distinct postsynaptic densities and narrower synaptic clefts.
Mitochondrial density was calculated based on the method outlined by Bertoni-Freddari et al. (1993). Briefly, the numbers of mitochondria were determined from 22 digital images each containing 1 unique Phox2b RTN cell. The number of pixels within each mitochondrion was determined by averaging number of pixels from 10 randomly chosen mitochondria per cell. This number was multiplied by the number of mitochondria for each of the 22 cells to determine the mitochondrial area for that particular cell. The ratio between the total mitochondrial area for the particular cell in pixels to the total number of pixels falling within the cytoplasm of the cell was used as the measure of mitochondrial volume density as per Bertoni-Freddari et al. (1993). This value was then used as “V” (volume density) in the formula for calculating number of mitochondria per cubic micron of tissue based on Weibel’s (1979) morphometric formula: Nv = (K/B)sq root(Na3/V) where K= 1 (size distribution coefficient regarding cellular organelles, for mitochondria =1), B= 1.57 (the shape coefficient for mitochondria based on the average of an oblate and prolate spheroid), Na = number of mitochondria/μm2 cell area. The rest of the values were then calculated for each of the 22 cells and an average and standard error of the mean determined.
All images were obtained in tiff format (resolution 1024 × 1024 pixels) using a digital camera system (Advanced Microscopy Techniques, software version 3.2). They were converted to 300 dpi without resampling in Photoshop 7.0. Brightness and contrast were adjusted and some sharpening was performed to enhance contrast.
Electrophysiological recordings in brainstem slices
Brainstem slice preparation
Transverse brainstem slices were prepared from neonatal (P6-P10) mice as described previously (Mulkey et al., 2004). Briefly, mice were anesthetized with ketamine (375 mg/kg) and xylazine (25 mg/kg), i.m. and rapidly decapitated; brainstems were removed and slices (300 μm) cut in the coronal plane with a microslicer (DSK 1500E; Dosaka) in ice-cold substituted Ringer’s solution containing (in mM): 260 sucrose, 3 KCl, 5 MgCl2, 1 CaCl2, 1.25 NaH2PO4, 26 NaHCO3, 10 glucose, and 1 kynurenic acid. Slices were incubated for 30 min at 37°C and subsequently at room temperature in a normal Ringer’s solution containing (in mM): 130 NaCl, 3 KCl, 2 MgCl2, 2 CaCl2, 1.25 NaH2PO4, 26 NaHCO3, and 10 glucose. Both substituted and normal Ringer’s solutions were bubbled with 95% O2 and 5% CO2.
Electrophysiology
We targeted the eGFP-fluorescent subpopulation of Phox2b-expressing RTN neurons for loose patch recordings of firing activity (Mulkey et al., 2004). For control experiments, we recorded from GFP-labeled neurons located in the C1 region of a TH-GFP (GFP-tyrosine hydroxylase) transgenic mouse (Matsushita et al., 2002). The C1 region resides medial and slightly caudal to RTN (Kang et al., 2007).
All recordings were obtained from coronal slices in a chamber on a fixed-stage fluorescence microscope (Zeiss Axioskop FS); slices were perfused continuously (~2 ml/min) with a bath solution containing (in mM): 140 NaCl, 3 KCl, 2 MgCl2, 2 CaCl2, 10 HEPES, 10 glucose; the pH of the bath solution was adjusted between 7.0 and 8.0 by addition of HCl or NaOH. All recordings were performed at room temperature. Patch electrodes had a DC resistance of 3–6 MΩ when filled with internal solution containing (mM): 125 potassium D-gluconate, 17.5 KCl, 1 MgCl2, 10 HEPES, 0.2 EGTA, 3 Mg-ATP, 0.3 GTP-Tris, pH 7.2; electrode tips were coated with Sylgard 184 (Dow Corning).
Data acquisition and analysis
Recordings were obtained using an Axopatch 200B amplifier and a Digidata 1322A analog-to-digital converter with pClamp 9.0 software (all from Axon Instruments, Foster City, CA). Firing rate histograms were generated by integrating action potential discharge in 10-s bins using Spike 5.0 software. We determined pH sensitivity of individual RTN neurons by plotting firing rate at different bath pH and calculating the pH value at which firing rate was reduced to half of that obtained at pH 7.0 (pH50) by using linear regression analysis (Excel). The frequency distribution plot of pH50 values was fitted with a double Gaussian fit using Origin (v. 7.0). Averaged data are presented as mean ± S.E. Statistical analysis was performed using Student’s t test, with statistical significance at p < 0.05.
Single-cell RT-PCR from acutely dissociated GFP-expressing RTN neurons
Acute dissociation and cell harvesting procedure
Brainstem neurons were dissociated acutely from neonatal (P6-P15) brainstem slices prepared from Phox2b-eGFP mice essentially as described by Hempel et al. (2007). After incubation in normal Ringer’s solution, slices were placed in an oxygenated chamber containing pronase (Sigma protease Type XIV, 1–2 mg/ml) in low-Ca2+ Ringer’s solution (0.1 mM Ca2+) at room temperature with constant stirring. After 20–40 min of enzyme digestion, the tissue was rinsed multiple times in low-Ca2+ Ringer’s solution and normal Ringer’s solution before transfer to HEPES-buffered bath solution. The RTN region was microdissected and mechanically dissociated by triturating through ~600 μm fire-polished Pasteur pipette until the solution turned cloudy and was free of tissue ‘chunks’. The cell suspension was plated onto poly-L-lysine (100 μg/ml)-coated glass coverslips; cells were allowed to adhere for 20 min at room temperature before the bath solution was gently changed. The isolated cells were used for up to 8h.
Single cell RT-PCR
Single cell RT-PCR was performed on eGFP+ dissociated RTN neurons, using methods similar to those described by others (Yan and Surmeier, 1996). In short, baked, silanized pipettes were filled with sterile internal solution containing 10x RT buffer and RNaseOUT (Superscript III, Invitrogen) and lowered onto eGFP+ cells visualized on a Zeiss Axioskop fluorescence microscope. The eGFP+ cells were aspirated into the pipette and ~3 μl of internal solution containing the cytoplasmic contents were expelled into a sterile tube containing dNTPs, BSA, RNaseOUT, oligo-dT and random hexamers; this pre-RT mixture was incubated at 65°C for 5 minutes, cooled on ice for 1 minute and stored at −70°C. First strand cDNA synthesis was performed with Superscript III Reverse Transcriptase, RNA was digested with RNase H and cDNA stored at −20°C. Single cell cDNA was amplified using two rounds of conventional PCR (GoTaq, Promega) with pairs of gene-specific outside (1st round) and nested primers (2nd round) for Phox2b, GAPDH, VGLUT2 and galanin; all primers were intron-spanning (see Table 1 for primer sequences and predicted amplicon sizes). The PCR conditions were as follows: 95°C (120 s); 35 cycles of 95°C (20 s), 59°C (20 s) and 72°C (20 - 40 s); 72°C (300 s); for galanin PCR, 40 cycles were included and the annealing temperature was 47°C. We included a no template negative control for each experiment; amplification of GAPDH mRNA served as a positive control. PCR products were separated by electrophoresis on agarose gels. Data were only included from experiments in which no PCR product was obtained from the no template control and from cells in which there was a positive signal for at least one of the genes.
Table 1.
Primer sequences for BAC transgenic line 1
| primer | for overlap extension to produce homologous arms and enzyme sites |
|---|---|
| L1 | GAGACCTCAGACAAGGCATCTCAC |
| L2 | CTTAAGTCGACCCGGGATCCCATGGAAAAGGTTCTGGATGGC |
| R1 | GGATCCCGGGTCGACTTAAGCTTACCTCAATTCCTCTGCCTAC |
| R2 | GGTCCTTATCGGGTTATACTGGAAG |
| primer | for determining proper targeting of transgene and genotype mice | |
|---|---|---|
| F1 | CAATGATAGGGAGGTTGGACAGC | F1-B6 331 nt product |
| B6 | AAAAGGTTCTGGATGGCTCAGC | |
| F4 | ATCACATGGTCCTGCTGGAGTTCG | F4-B12 455 nt product |
| B12 | GCCCCAAAAGTGGTCCTTATCG |
RESULTS
Selective labeling of RTN neurons in the Phox2b-eGFP B/G mouse
As shown in the case of a representative adult B/G mouse (Fig. 2), eGFPneurons were confined to the pons and the rostral medulla within a subset of Phox2b-expressing structures. The only eGFPneurons present in the medulla oblongata (with the exception of a few eGFP neurons in the vestibular nuclei) were located next to the ventral surface at the level of the facial motor nucleus, i.e. within the region previously defined as the RTN (Fig. 2, magenta circles; Fig. 3A,B). The rest of the Phox2b-expressing neurons present in the medulla oblongata did not express detectable levels of eGFP (e.g. facial and other motor neurons, Fig. 3A; nucleus of the solitary tract including all types of catecholaminergic neurons therein, Fig. 3C; C1 adrenergic neurons, Fig. 3D). Although Phox2b is normally expressed by every cluster of lower brainstem catecholaminergic neurons in adult rodents (Kang et al., 2007), none of the medullary catecholaminergic neurons expressed detectable levels of eGFP in the B/G line of Phox2b-eGFP transgenic mice. However, a modest number of pontine locus coeruleus neurons did so (Fig. 3E).
Figure 2. Distribution of eGFP-expressing neurons in the lower brainstem of the B/G Phox2b-eGFP mouse.

Computer-assisted plots of the eGFP-positive neurons (50 μm-thick coronal hemi-sections; each dot represents one neuron). The numbers at the left of the sections indicate the approximate levels of the sections relative to Bregma (in mm) according to the atlas of Paxinos and Franklin (2004). Scale bar (top left section) is 500 microns. Abbreviations: 7, facial motor nucleus; 7n, facial nerve; 8n, vestibulocochlear nerve; Amb, nucleus ambiguus; CIC, central nucleus of the inferior colliculus; DC, dorsal cochlear nucleus; g7, genu of the facial nerve; icp, inferior cerebellar peduncle; IntP, interpositus nucleus of the cerebellum, posterior; IO, inferior olive; LC, locus coeruleus; LSO, lateral superior olive; LDTg, lateral dorsal tegmental nucleus; LVe, lateral vestibular nucleus; Med, medial cerebellar nucleus; Mo5, trigeminal motor nucleus; MVe, medial vestibular nucleus; PFl, paraflocculus; Pr, prepositus nucleus; Pr5VL, principal sensory trigeminal nucleus, ventrolateral; scp, superior cerebellar peduncle; sol, solitary tract; sp5; spinal trigeminal tract; SPO, superior paraolivary nucleus; SpVe, spinal vestibular nucleus; xscp, decussation of the superior cerebellar peduncle. Magenta dots represent the RTN neurons. The rest of the eGFP+ neurons are in green.
Figure 3.
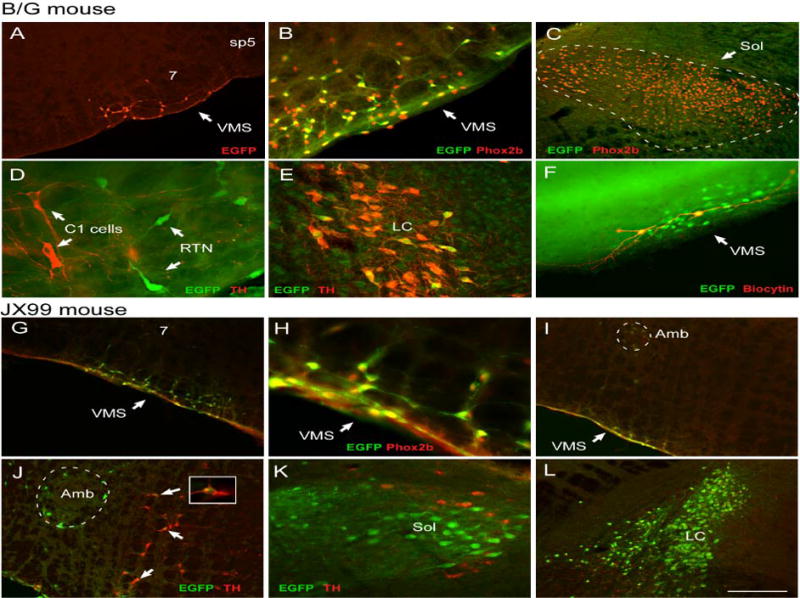
eGFP-expressing neurons in 50 μm coronal sections of the medulla oblongata and pons of the B/G (Panels A-G) and the JX99 (Panels G-L) mouse lines. Brain sections are oriented with the lateral edge towards the right (A-G) or left (G-L).
A, Low power image of the RTN region showing eGFP+ neurons (Cy3, red). Facial motor neurons (7) are unlabeled. B, Higher power image of the same region showing that every eGFP-labeled neuron (Cy-2, green) has a Phox2b-ir nucleus (Cy-3, red). C, In the nucleus of the solitary tract (Sol), Phox2b-ir neurons (nuclei labeled in red with Cy-3) do not express eGFP. D, In the RTN region, eGFP-expressing neurons (Cy2, green) do not contain tyrosine-hydroxylase (TH; Cy-3, red). E, A few TH-ir neurons in the locus coeruleus express eGFP (yellow). F, Structure of two eGFP RTN neurons (eGFP: Cy-2, green) recorded in a coronal slice of a neonatal mouse (P9) and filled with biocytin (Cy-3, red). Note the extensive superficial dendrites. G, Low power photomicrograph of the RTN region showing eGFP neurons (Cy2, green) with Phox2b-ir nuclei (Cy3,red). Facial motor neurons (7) are lightly labeled. H, Higher power image of the same region showing that every eGFP-labeled neuron (Cy-2, green) has a Phox2b-ir nucleus (Cy-3, red). I, Low power image of area just caudal to the facial motor nucleus showing light eGFP labeling of ambiguus motor neurons (Amb, surrounded by dashed line) as well as RTN neurons on the ventral medullary surface (VMS). J, In the caudal RTN region, a few eGFP-expressing neurons (Cy2, green) did contain tyrosine-hydroxylase (TH; Cy-3, red) and appear orange (arrows). K, Many neurons of the solitary tract express eGFP. However, the presumed A2 neurons (TH in red with Cy-3) do not express eGFP. L, The locus coeruleus expresses many brightly labeled eGFP neurons. Abbreviations: 7, facial motor nucleus; 7n, facial nerve; C1 cells, C1 adrenergic cell group; LC, locus coeruleus; Sol, nucleus of the solitary tract; sp5, spinal trigeminal tract; VMS, ventral medullary surface. Scale bar in L equals 200 μm in panel A, G, I, J, L; 100 μm in panels B,C, E, F, K and 50 μm in panel D, H. A magenta-green version of this figure is available as supplemental Figure 1.
All the eGFP neurons of the RTN region expressed Phox2b in the B/G mouse (Fig. 3B) but the eGFP neurons represented only 38.2% ± 5% of the total cluster of Phox2b cells in this area. This percentage was determined in five mice by counting singly (Phox2b-ir; mean 154 cells per mouse, range 77–191) and doubly labeled neurons (Phox2b/eGFP; mean 92 cells per mouse, range 67–121) within the ventrolateral medullary cluster of Phox2b-ir neurons in five equidistant 50 micron-thick coronal brain sections per mouse (one section every 150 microns). The eGFP-positive neurons were distributed throughout the group of TH-negative Phox2b-positive neurons from the caudal end of the facial motor nucleus (Fig. 2; level −6.57) to its rostral end (Fig. 2; level −5. 67) with much fewer neurons in between (Fig. 2; level −6.12–6.27). This double-hump distribution is typical of the cc RTN neurons in both rats (Takakura et al., 2008) and mice (see also Fig. 5). In short an approximately constant percentage of the Phox2b cells were eGFP labeled in the B/G mouse regardless of the rostrocaudal level.
Figure 5. Distribution of the eGFP-expressing neurons in the rostral medulla oblongata of the JX99 mouse.

Computer-assisted plots of the eGFP-positive neurons in one JX99 mouse (50 μm-thick coronal hemi-sections; each dot represents one eGFP+Phox2b neuron, each cross represents one Phox2b non-eGFP neuron). The numbers at the left of the sections indicate the approximate levels of the sections relative to bregma (in mm) according to the atlas of Paxinos and Franklin (2004). Scale bar is 1 mm. The area below the double-headed arrows was counted as the RTN in the three sections caudal to the facial motor nucleus. Graphs in the left hand panel represent the average number of Phox2b-ir neurons (either with eGFP, squares, or no eGFP, crosses) counted on both sides of coronal sections for 4 JX99 mice taken at the levels represented by the coronal sections in the left hand panel. The error bars denote the SEM. Abbreviations as in Figure 2.
Somatic and autonomic brainstem motoneurons express Phox2b during early development and in adulthood (Brunet and Pattyn, 2002; Kang et al., 2007). The eGFP neurons of the RTN region in the B/G mouse did not contain choline-acetyl transferase and the surrounding ChAT-expressing neurons (e.g. facial motor neurons, ambiguus motor neurons), were devoid of eGFP immunoreactivity (3 mice sampled; results not illustrated).
We characterized expression of a number of markers for RTN neurons by single cell PCR from dissociated, eGFP-fluorescent ventral medullary neurons obtained from B/G mice. As expected, we found Phox2b expression in every neuron tested (n = 9; data not shown); likewise, all neurons tested were positive for VGLUT2 (n = 20, see Fig. 4), a result that is consistent with our previous histochemical characterization of the pH-sensitive neurons cells of the RTN region as Phox2b-positive and glutamatergic (Mulkey et al., 2004; 2007c). Finally, galanin immunoreactivity was found in 5 of 10 cells (see Fig. 4). This marker was tested because preprogalanin mRNA was previously identified in about half of the RTN neurons that are activated by CO2 in anesthetized rats (Stornetta et al., 2009). The latter result indicates that the subset of Phox2b cells that expresses eGFP in the B/G mouse line includes both galanin-positive and galanin-negative RTN neurons.
Figure 4. eGFP-expressing neurons of the B/G mouse RTN are glutamatergic and express galanin.

Agarose gel of single cell RT-PCR for GAPDH (expected product = 255 bp), VGLUT2 (expected product = 131 bp) and pre-pro-galanin (Galanin, expected product = 331 bp). All 4 eGFP-positive RTN neurons express VGLUT2, however only 2 of the 4 express pre-pro-galanin. Control reactions performed in the absence of template (no template, nt) were included for all PCR reactions.
The eGFP+ neurons of the RTN had a profusion of superficial dendrites that extended within the marginal layer of the ventral medulla in the coronal plane. This peculiar morphological characteristic, already noted in RTN neurons selected solely on the basis of their sensitivity to acidification in rats and mice (Mulkey et al., 2004), is illustrated in the case of two eGFP+ neurons that were filled with biocytin after intracellular recording in transverse slices (Fig. 3F).
In brief, in the B/G mouse, eGFP identifies around 38% of the cc RTN neurons in complete anatomical isolation from other populations of Phox2b-expressing neurons.
eGFP-expression pattern in the brainstem of the JX99 strain
The expression pattern was examined in the lower brainstem of four six day-old JX99 mice using a similar protocol as for the B/G mouse. That is, a one-in three series of 50 μm-thick transverse sections was used for simultaneous detection of eGFP and Phox2b and an alternate series of sections was used for simultaneous detection of TH and eGFP.
Expression of eGFP was also strictly neuronal judging from the morphology of the labeled cells. As in the B/G mouse eGFP-ir was detectable exclusively in neurons that contained a Phox2b-ir nucleus. The medulla oblongata of the JX99 mouse contained larger numbers of eGFP-ir neurons than the B/G mouse. For example, large numbers of eGFP-positive neurons were present in the solitary tract nucleus (Fig. 3K), the locus coeruleus (Fig. 3L) and the nucleus ambiguus (Fig. 3I). Yet, eGFP expression was still confined to a subset of Phox2b-ir neurons. For example, only a few facial motor neurons had a detectable level of eGFP (Fig. 3G) and the C1 neurons of the ventrolateral medulla were also rarely eGFP-positive (30 out of 504 neurons counted in 4 mice, examples in Fig. 3J). In the RTN region, every Phox2b-ir neuron contained strikingly high levels of eGFP (Fig. 3G–J). These very superficial neurons had the same anatomical distribution as in the B/G mouse. Also the distribution of the RTN eGFP neurons in the JX99 mouse was exactly the same as the cc RTN neurons in the rat with the bulk of these neurons clustered at the caudal end of the facial motor nucleus and a smaller cluster appearing at the rostral end of the facial nucleus (compare Fig. 5 in this study with Fig. 1 in Takakura et al., 2008). However, the rostral and caudal boundaries of the RTN cluster of eGFP-labeled neurons were less distinct in the JX99 mouse than in the B/G mouse. The caudal boundary was somewhat blurred in the JX99 mouse because of the presence, medially and dorsally to the RTN cluster, of some eGFP-positive C1 cells and motor neurons. The rostral boundary was notably indistinct because of the presence, rostral to the facial motor nucleus, of numerous eGFP-labeled neurons that probably belong to the superior salivary nucleus and the A5 cell group which both express Phox2b (Kang et al., 2007).
An attempt was made to count the total number of cc RTN neurons of the neonate mouse by “carving out” the dense cluster of eGFP-positive neurons and excluding regions located at the margin of this area and known or suspected to have different types of neurons (facial motor nucleus, Bötzinger region, medial region where C1 cells congregate in the mouse and region rostral to the rostral end of the facial motor nucleus, Fig. 5). The total number of eGFP neurons counted by the presence of a Phox2b-ir nucleus in this region (9 sections per mouse in a 1/3 series of 50 μm coronal sections extending from 300 μm caudal to the facial motor nucleus to the ponto-medullary border at the exit of the 7th nerve) was 311.5 ± 19.7 neurons (N = 4). After applying the Abercrombie (1946) correction (with the average section thickness of 35.7 microns and the nuclear diameter (height) of 6.7 microns), the total number of cc RTN neurons of the neonate JX99 mouse was estimated at 787.4 ± 49.8 neurons per brain, roughly 40% of the number that we previously estimated for the adult Sprague-Dawley rat (Takakura et al., 2008).
In short, practically all the Phox2b-ir neurons of the RTN region express eGFP in the JX99 mouse. The cluster of cc RTN neurons is easily identifiable in the neonate mouse because of its packing density and superficial location but the neurons are not fully isolated spatially from other surrounding types of Phox2b-expressing neurons.
Chemosensitive properties of the RTN neurons in Phox2b-eGFP transgenic mice in vitro
We took advantage of the Phox2b-eGFP transgenic mice to ask whether all the eGFP cc RTN neurons are pH-sensitive, a question that could not be addressed previously with a sampling strategy that consisted of first identifying whether a neuron is pH-sensitive and then testing its phenotype (Mulkey et al., 2004; Mulkey et al., 2007c; Onimaru et al., 2008). We used loose patch recordings to measure firing activity of eGFP-fluorescent RTN neurons in bath solutions with pH ranging from 7.0 to 8.0.
All the eGFP RTN neurons recorded in the B/G mouse were sensitive to bath pH; cells were spontaneously active at pH 7.3 (3.3 ± 0.3 Hz, n = 43), increased their discharge during bath acidification to pH 7.0 (4.8 ± 0.3 Hz) and stopped firing in alkalized bath solutions (pH ranging from 7.5 to 8.0) (Fig. 6).
Figure 6. Chemosensitive properties of RTN neurons in the B/G mouse in vitro.

A1, Brightfield (DIC) photomicrograph of a typical pH sensitive RTN neuron. Scale bar = 25 microns. A2, Same cell as A1 under fluorescence to show eGFP labeling.
B1, Loose patch recording of action potential discharge in a Type I pH-sensitive eGFP-expressing cell in RTN. As illustrated in the firing rate histogram (lower), the cell was extremely sensitive to changes in bath pH (pHo; upper); it fired at 3–4 Hz at pH 7.0 and was silenced at pH 7.5. Note that the cell was strongly excited by SP (100 nM). B2, Relationship between discharge rate and pHo for the neuron shown in B1; spike firing ceased at pH 7.5, as was typical of Type I cells. C1 – C2, Representative profile of pH-sensitivity in Type II RTN neuron. Like Type I cells, Type II neurons were also excited by SP and sensitive to changes in bath pHo; however, they typically had a higher initial firing rate at pH 7.3 and required stronger alkalization to become silent (to pH 7.8–8.0). D1, Relationship between initial resting discharge at pH 7.3 of Type I (open circles, n = 23) and Type II (filled circles, n = 20) neurons and pH50 (i.e. the bath pH at which firing rate was reduced to half that at pH 7.0). D2, Frequency distribution of pH50 values for eGFP-expressing RTN cells. The distribution reveals two peaks (at pH50 = 7.3 and pH50 = 7.5) and was well-fitted by two Gaussian curves; based on this fit, cells were classified as either Type I (pH50 < 7.42) or Type II (pH50 > 7.42). D3, Averaged pH-sensitivity for all neurons (grey circles, n = 43) or for neurons classified as Type I (open circles) or Type II neurons (filled circles); pH sensitivity (i.e., the slope) was similar for all groupings, but the relationship for Type II neurons was displaced toward higher firing rates. E1–E2, Example of one Type I neuron recorded in the JX99 mouse RTN. F1–F2, Example of one Type II neuron recorded in the JX99 mouse RTN.
Two different populations emerged from this analysis of cells that were targeted based on eGFP expression, each accounting for approximately half of the total. The first, which we have called Type I, had properties similar to the neurons that we selected previously in the same brain region of wild type rats and mice based on their pH sensitivity; they had a control firing rate of ~2 Hz at pH 7.3, increased firing to ~4 Hz at pH 7.0 and were mostly silenced at pH 7.5 (Fig. 6B1,B2). The other group of eGFP neurons, called Type II, typically had higher initial firing rates (~4–5 Hz) and required a greater degree of alkalization (to pH 7.8–8.0) before they stopped firing (Fig. 6C1,C2). We calculated a pH50 value for each cell (see Methods); there was a strong correlation between pH50 and initial firing rate (Fig. 6D1), and a frequency distribution of cells based on pH50 revealed two populations distributed approximately equally, with peaks at pH50 = 7.3 and pH50 = 7.5 (Fig. 6D2). Based on this distribution, we used a cutoff pH50 of 7.42 to classify cells as Type I (n = 23) or Type II (n = 20). There was no obvious difference in morphology or localization of Type I and Type II cells, and both cell types responded to substance P (SP,100 nM) with a 2–3 Hz increase in firing (3 cells per group; Fig. 6B1, 6C1). Likewise, the two groups had similar pH sensitivity, as revealed by the slopes of firing rate responses to changes in pH (Fig. 6D3); the major difference between the groups was that Type II cells had higher resting discharges at pH 7.3 than Type I cells (4.4 ± 0.3 Hz vs. 2.2 ± 0.3 Hz; p < 0.005), which appears to account for the shift to more alkalized values of the pH sensitivity curve of Type II cells.
Because eGFP is expressed by only approximately 38% of the RTN neurons in the B/G mouse, the above-described experiments had a built-in sampling bias. To reduce this sampling bias we also recorded from eGFP-positive RTN neurons from the JX99 mouse in which eGFP is expressed by every Phox2b-ir RTN neuron. However, because the rostral and caudal end of the RTN are less distinct in the JX99 mouse than in the B/G mouse we confined our recordings to the middle of the compact cluster of eGFP-labeled cells, which resides strictly under the facial motor nucleus. Virtually every eGFP neuron recorded within this region was sensitive to extracellular pH changes (16/17, 94%; Fig. 6E1,E2). All the pH-sensitive eGFP RTN neurons from the JX99 mice were spontaneously active at pH 7.3 (3.5 ± 0.5 Hz, n = 16). Bath acidification from pH 7.3 to pH 7.0 increased firing activity in 10 tested neurons by 60% (from 2.7 ± 0.4 Hz to 4.3 ± 0.6 Hz; p < 0.05), whereas bath alkalization to between pH 7.5 and pH 8.0 decreased firing to or near zero. Based on the classification criterion defined for RTN neurons recorded in the B/G mouse, JX99 neurons could also be classified into Type-I and Type-II neurons with an average pH50 of 7.3 ± 0.03 for Type-I cells (6/16, 37.5%; Fig. 6E1–E2) and 7.6 ± 0.03 for Type-II (10/16, 63.5%; Fig. 6F1–F2). The fractional distribution of Type-I and Type-II neurons was not statistically different between the two mouse strains by χ2 analysis.
For controls we recorded from GFP-labeled neurons in a TH-GFP transgenic mouse (Matsushita et al., 2002). We selected cells located within the rostral portion of the ventrolateral medulla in close proximity to the RTN where TH-positive neurons are most likely to belong to the C1 adrenergic cell group. These cells (n = 11 from 8 mice) were slowly active at rest (1.8 ± 0.3 Hz) and every neuron tested (N=6) was strongly inhibited by the α2-adrenergic agonist α-methylnorepinephrine (Fig. 7A), a characteristic previously associated with C1 neurons in rats (Li et al., 1995). Intracellular labeling with biocytin confirmed the catecholaminergic nature of the recorded neurons in all cases tested (9 cells; Fig. 7C). As a group, the sampled neurons were insensitive to changes in extracellular pH in the range of 6.9 to 7.5 (Fig. 7B).
Figure 7. TH-immunoreactive (C1) neurons lack pH sensitivity in vitro.

A, Representative loose-patch recording of a C1 neuron recorded from a TH-GFP mice showing membrane hyperpolarization upon activation of α-2 adrenergic receptors with 30 μM α-methylnorepinephrine (αMN). B, average firing rate ± s.e.m. of 11 TH-ir (C1) neurons at three different pH. The effect of pH was not significant (p > 0.05 by ANOVA). C-E, example of 2 αMN-sensitive neurons filled with biocytin (C, Alexa488, aqua) and immunostained with an antibody for tyrosine-hydroxylase (D, Cy-3, magenta). The overlay between the two images is shown in panel E. Calibration bar: 50μm.
Ultrastructure of the eGFP+ RTN neurons in the B/G mouse
By electron microscopy, eGFP cell bodies (Fig. 8A–C) and dendrites (Fig. 8D) were identified from surrounding unlabelled neuropil and vascular elements by the presence of electron-dense floccular material distributed throughout the cell, including within the nucleus. Consistent with light microscopic observations, eGFP-labeled RTN somata and dendrites were located near and sometimes apposed the ventral surface of the medulla (not shown). Numerous astrocytic processes, identified by the presence of filament bundles, surrounded somata that were adjacent to the ventral surface. In many instances, eGFP-labeled somata were located near or almost completely surrounded blood vessels, the majority of which were capillaries (Fig. 9). In the latter instances, the eGFP-labeled somata either directly apposed the basement membrane (Fig. 9C) or were separated from the basement membrane by an astrocytic process (Fig. 9D). Commonly, eGFP-labeled somata also were found near or closely apposed to pericytes, identified by heterochromatin in the nucleus and dark cytoplasm (Fig. 8B,C).
Figure 8. General characteristics of the eGFP-labeled RTN cell bodies and dendrites.

A, An eGFP-labeled soma contains a nucleolus (n) within the nucleus (N) as well as numerous mitochondria (m, small arrows) within the cytoplasm. The soma is surrounded by myelinated axons (mA). B, An eGFP-labeled somata with invaginated nucleus (arrow) and numerous mitochondria (m) is surrounded by myelinated axons (mA) and directly abuts (arrowheads) a pericyte (P). The inset shows a lower magnification of the same neuron and pericyte. C, An eGFP-labeled soma with invaginated nucleus (arrow) directly abuts (arrowheads) a pericyte (P). D, An eGFP-labeled dendrite (d) is surrounded by myelinated axons (mA). Scale bar = 2 μm in A, B, and 750 nm in C,D.
Figure 9. Proximity of the eGFP-labeled RTN neurons with blood vessels.

A, An eGFP-labeled soma is surrounded by three blood vessels (BV) and an astrocytic soma (Ast). One of the blood vessels is contacted by a pericyte (P). The asterisk indicates the tissue/plastic interface. N, nucleus. B, Different eGFP-labeled soma envelopes a blood vessel (BV). The eGFP-labeled soma contains numerous mitochondria (m, straight arrows). IB, neurofibrillary inclusion body. C, An eGFP-labeled soma apposes the basement membrane (bm, inset) of a blood vessel (BV) and is surrounded by myelinated axons (mA). The nucleus (N) of the neuron contains an invagination (curved arrow, seen also in A and B). D, An eGFP-labeled somata with nucleus (N) and numerous mitochondria (m, straight arrows) directly abuts the astrocytic end feet (asterisks, inset) apposed to the basement membrane (bm). Scale bar = 4 μm. For A,C; 1.25 μm for B,D.
Phox2b-eGFP labeled somata (n = 17) ranged from 5.0 to 11.2 μm minimum diameter (average 7.7 ± 0.5 μm), and often had an invaginated nucleus (Figs. 8B,C and 9A,C) with an occasional nucleolus (Fig. 8A) and abundant cytoplasm (Figs. 8A,B). Within the cytoplasm, numerous mitochondria (2.5 ± 0.2 mitochondria/μm3) and occasional neurofibrillary inclusion bodies were observed (Figs. 8A and 9B,D).
eGFP-labeled dendrites (n = 39) ranged in minimum diameter from 0.4 – 2.0 μm (average 1.1 ± 0.1 μm). Dendrites were usually contacted by one terminal in a plane of section (Fig. 10A,C) and more rarely by two terminals (Fig. 10B). Small, more distal dendrites (< 1.2 μm in diameter) contained on occasion smooth endoplasmic reticulum and mitochondria. The synapses were tentatively classified as either asymmetric (Fig. 10A,B) or symmetric (Fig. 10B,C). The smaller dendrites were typically contacted by terminals forming asymmetric synapses (Table 2) regardless of whether they resided at the ventral surface or deeper below the surface. Dendrites over 1.2 μm in diameter usually contained smooth and rough endoplasmic reticula, mitochondria and occasional lysosomes and thus were considered proximal to the somata. These large dendrites were generally contacted by unlabeled terminals that formed symmetric synapses (Fig. 10B,C; Table 2). Portions of the dendrites not contacted by terminals were surrounded by astrocytic profiles.
Figure 10. Synaptic inputs of RTN neurons.

A, An unlabeled terminal (uT) forms an asymmetric synapse (arrow), presumably excitatory, with an eGFP-labeled dendrite (d). B, Two unlabeled axon terminals (uT) form synapses (curved black arrows) with a small eGFP-labeled dendrite (d). C, Unlabeled axon terminal (uT) forms a symmetric, presumably inhibitory, synapses (white arrows) with an eGFP-labeled dendrite (d) and with an unlabeled dendrite (ud). Scale bar is 1 μm for all panels.
Table 2.
Primer Sequences for single-cell PCR
| Primer | Sequence | Amplicon (bp) |
|---|---|---|
| Phox2b | ||
| Outside | 238 | |
| Forward | CAGTGGCTTCCAGTATAACCCGAT | |
| Reverse | AGCGAAGACCCTCTCCAACTCTTT | |
| Nested | 104 | |
| Forward | TACGCCGCAGTTCCATACAAACTC | |
| Reverse | TCTTTGAGCTGCGCGCTTGTGAAG | |
| GAPDH | ||
| Outside | 542 | |
| Forward | AAATGGTGAAGGTCGGTGTGAACG | |
| Reverse | AGTGATGGCATGGACTGTGGTCAT | |
| Nested | 255 | |
| Forward | GCAAATTCAACGGCACAGTCAAGG | |
| Reverse | TCTCGTGGTTCACACCCATCACAA | |
| VGLUT2 | ||
| Outside | 543 | |
| Forward | CTGCTTCTGGTTGTTGGCTACTCT | |
| Reverse | ATCTCGGTCCTTATAGGTGTACGC | |
| Nested | 131 | |
| Forward | CATCTCCTTCTTGGTGCTTGCAGT | |
| Reverse | ACAGCGTGCCAACGCCATTTGAAA | |
| Galanin | ||
| Outside | 498 | |
| Forward | TCAGCCACTCTGGGACTTGG | |
| Reverse | ACTTGCTAGTTTTTATTATGTCACAC | |
| Nested | 331 | |
| Forward | CATGCCATTGACAACCACAG | |
| Reverse | CGATTGGCTTGAGGAGTTGG | |
Rarely, axon terminals (n = 2) and axons contained eGFP immunoreactivity (result not illustrated). These eGFP-positive terminals had a minimum diameter of 0.6 μm, and contained numerous small, synaptic vesicles. They were located near blood vessels and formed symmetric synapses with unlabeled dendrites in the plane of section analyzed. The origin of these eGFP-labeled inhibitory synapses is unknown. Since RTN neurons are glutamatergic (Mulkey et al., 2004; Stornetta et al., 2006) and should therefore presumably form asymmetric synapses, we suspect that these eGFP terminals may originate from neurons located outside the RTN, possibly within the pons.
DISCUSSION
We describe two new BAC Phox2b-eGFP transgenic mouse lines in which the non-cholinergic, non-catecholaminergic, glutamatergic Phox2b neurons of the RTN (cc RTN neurons) express the transgene. We show that virtually every cc RTN neuron is activated by acidification in vitro. We provide the first ultrastructural analysis of these putative respiratory chemoreceptors, which shows that they are subject to a considerable degree of synaptic regulation and have a close anatomical relationship with small blood vessels and pericytes.
The B/G mouse, a line in which eGFP is expressed selectively by cc RTN neurons
The eGFP-expressing neurons located in the ventrolateral aspect of the medulla oblongata of the B/G mouse had the same structure, location and markers as the RTN cells previously identified by their CO2-sensitivity in vivo and acid sensitivity in slices (Mulkey et al., 2004; Stornetta et al., 2006; Stornetta et al., 2009). We have previously demonstrated the virtually complete coincidence between Phox2b and VGLUT2 mRNA in the RTN of the rat by combining immunohistochemistry (Phox2b) with in situ hybridization (Stornetta et al., 2006). We therefore assume that the same holds true for the mouse and support this interpretation by our evidence that VGLUT2 mRNA could be detected in every eGFP neuron examined by single cell PCR in the B/G mouse. Moreover, the eGFP-labeled cells located in the RTN region of this mouse had strongly Phox2b-immunoreactive nuclei and lacked both choline acetyl transferase and TH. Finally, these neurons had extensive dendrites running parallel to the ventral medullary surface in the coronal plane, a feature also found in the RTN of the rat (Mulkey et al., 2004).
In short, eGFP identifies the cc RTN neurons with complete selectivity in the B/G mouse since no other type of Phox2b-expressing neurons located in the vicinity [(motor neurons, C1 adrenergic neurons, ambigual motor neurons, A5 neurons and superior salivary neurons, (Kang et al., 2007)] were eGFP-positive. It is not unusual for BAC transgenic lines to exhibit distinct and selective expression patterns, a property that is usually attributed to variations in copy number and/or to insertion of the clone into a particular region of the genome. The selective eGFP expression that we obtained in the B/G mouse line is fortuitous in that it obviates concern with other Phox2b-expressing cells that might lead to misidentification of cells as cc RTN neurons and confound interpretations of anatomical or electrophysiological results.
On the negative side, only 38% of the cc RTN neurons expressed eGFP in the B/G mouse. This is a limitation as far as the ultrastructural component of the present study is concerned because the eGFP-labeled neurons may not be representative of the entire population of RTN neurons. However, with regard to the electrophysiological data, the predominant use of the B/G mouse is not a significant limitation since we reproduced the data by recording from randomly selected eGFP-labeled neurons in the JX99 mouse in which all the Phox2b neurons of the RTN region are fluorescent.
The JX99 mouse expresses eGFP in all the cc RTN neurons
Although the JX99 mouse line was created using the same BAC as the B/G mouse (i.e., RP23-15D10), its pattern of eGFP expression was different and, in general, showed a much higher proportion of Phox2b-positive neurons expressing eGFP. This characteristic had both advantages and limitations. The main advantage was that every Phox2b-positive neuron of the RTN region was highly fluorescent. Because cholinergic and catecholaminergic eGFP neurons tend to congregate at the margins of the cc RTN neurons, it was therefore possible to record reliably from these neurons by targeting fluorescent neurons located near the geographic center of the RTN cell cluster. However, the JX99 line is less advantageous for ultrastructural studies. Indeed, although the cell bodies of the Phox2b-expressing cholinergic or catecholaminergic neurons reside at the margins of the cluster of cc RTN neurons, there is considerable intermingling of their dendrites (Takakura et al., 2008).
The cc RTN neurons are uniformly activated by acidification
Our prior evidence that the cc RTN neurons are acid-sensitive relied on a sampling strategy whereby pH-activated neurons (in slices) or CO2-activated neurons (in vivo) were selectively studied (Mulkey et al., 2004). This sampling strategy revealed that acid-sensitive neurons in vitro had the same location and dendritic structure as the CO2-sensitive neurons recorded in vivo and that both populations had the cc RTN phenotype (Guyenet, 2008). However, this sampling strategy could not answer whether a small or large proportion of the cc RTN neurons are pH-activated. The present study suggests that all these neurons are uniformly activated by acidification in slices. In addition, all the neurons tested had a uniform sensitivity to substance P identical to the cc RTN neurons previously tested in the rat and mouse (Mulkey et al., 2007).
The degree of alkalization needed to silence the cc RTN neurons varied but it was directly related to the resting discharge at pH 7.3; in fact, the pH-sensitivity, expressed as change in firing rate per pH unit, was the same (Fig. 6). Thus, the variability in the range of pH over which the cells remained active may simply reflect differences in baseline cell excitability onto which a similar pH-sensitive mechanism is superimposed. Nevertheless, the bimodal distribution of basal discharge and of the pH required to silence the cells implies the existence of two discrete neuronal subtypes. The neurons with lower basal discharge rate and a pH50 of less than 7.3 (Type I neurons) had properties essentially identical to the pH-sensitive neurons that we previously selected for study in mice or rats (Mulkey et al., 2004; 2007c). The more active RTN neurons that required alkalization to pH 8 to be silenced (Type II neurons) would have been rejected in our previous studies since, at pH 7.5, these cells are typically inhibited by only 50% relative to their basal activity at pH 7.3. The discharge of Type I neurons in slices was previously attributed to an intrinsic property because it is unaffected by blocking ionotropic receptors for glutamate, GABA and glycine and both ionotropic and metabotropic ATP receptors (Mulkey et al., 2004; 2007b). Similar experiments have not been done with Type II neurons, therefore we cannot exclude a contribution of synaptic inputs to the discharge of these neurons. Whether Type I and Type II cells differentially express galanin is also an interesting question.
One possible limitation of the present experiments is that they were carried out in neonate animals during a time period when, at least in rats, the central chemoreflex is at a low ebb (Stunden et al., 2001). However, judging from work done in the locus coeruleus, this transient reduction in chemoreflex gain may have little to do with a change in the pH-sensitivity of brain neurons (Stunden et al., 2001). Furthermore, immediately after birth, the RTN already contains Phox2b-expressing neurons that are pH-sensitive (Onimaru et al., 2008). In the Suzue preparation, these cells are a subset of the pre-inspiratory neurons called the parafacial respiratory group (Onimaru et al., 2008). These neurons have the same phenotype as the cc RTN neurons (Onimaru et al., 2008) and are very probably the same or a subset of the cc RTN neurons.
Prior ultrastructural studies of the ventrolateral medullary surface
Two subregions covering the bulk of the ventral medullary surface have been described as chemosensitive in cats based on the observation that topical acidification increased respiration (Mitchell et al., 1963; Loeschcke, 1982). These two chemosensitive regions bracket an intermediate region where acid produces weak inhibition of breathing (Loeschcke, 1982). In retrospect, only the rostral chemosensitive region (called RA or area M) can be viewed as roughly in register with the RTN (Mitchell et al., 1963; Loeschcke, 1982). The cc RTN neurons do not extend very far caudal to the facial motor nucleus and are clearly not in register with the caudal and intermediate areas. Prior work on these regions is therefore not directly germane to the present study. Acid-activated neurons and or glia have been identified throughout the cat’s medullary surface by in vivo and in vitro electrophysiology as early as the 1970s and superficial neurons were described at the light and ultrastructural level (for a review of the older literature see (Loeschcke, 1982)). It is therefore quite possible that some of the neurons that were studied at the time could have been what are now referred to as RTN neurons. These older studies laid the essential concepts regarding central respiratory chemosensitivity but they were conducted without the benefit of modern immunohistochemistry or intracellular staining techniques and these limitations preclude a direct comparison with the present work on a population of chemically coded neurons. Adding to these uncertainties, Trouth et al. (1982) assert that there are no superficial neurons in the rostral area of cats. In contrast, they find very superficial neurons in area S, a region described by Loeschcke (1982) as having little or no chemosensitivity to acid. The lack of superficial neurons in area M may be due to the fact that the RTN of the cat resides farther away from the ventral medullary surface than in the rat (Connelly et al., 1990a; Teppema et al., 1994; Bodineau et al., 2000a; Weston et al., 2004; Stornetta et al., 2006; 2009). The slightly deeper location of the cell bodies in cats could have to do with the larger size of a more superficial location of the spinocerebellar tract. The validity of this comparative neuroanatomy argument will of course require verifying the homology between the neuronal cluster identified as RTN in the cat and the cc RTN rodent neurons of interest to the present study. However, were these assumptions to be correct, one would have to conclude that the putative chemosensory role of the RTN neurons does not require that these cells or their dendrites reside in the marginal layer of the ventral medullary surface.
Synaptic regulation of the cc RTN neurons of the RTN region
Substantial pH-modulated leak potassium current is present in the cc RTN neurons after action potential blockade with TTX and their acid sensitivity persists after blocking glutamate, GABA, glycine and ATP receptors (Mulkey et al., 2004). Accordingly, the pH-sensitivity of these neurons could be an intrinsic property although the contribution of paracrine mechanisms remains a possibility (Mulkey et al., 2004; Gourine et al., 2005a; 2006).
The present EM analysis reveals that the cc RTN neurons receive many synapses. Their small-caliber dendrites that reside in the marginal layer of the medulla oblongata are also covered with synaptic boutons consistent with prior LM observations (Rosin et al., 2006). RTN neurons seem to have predominantly asymmetric synapses at the level of their distal dendrites whereas their soma and proximal dendrites receive mostly symmetric synapses. Asymmetric synapses are generally considered to be excitatory, presumably glutamatergic, whereas symmetric synapses are associated with inhibitory transmission (GABA- or glycinergic)(Carlin et al., 1980). The predominance of glutamatergic synapses on distal dendrites and of inhibitory ones closer to the cell body is a common neuronal characteristic. Because the characterization of some of the synapses as asymmetric or symmetric was occasionally ambiguous, the existence of these two classes of synaptic inputs will require confirmation using defining markers of glutamatergic or inhibitory transmission such as, respectively VGLUT2, GAD67 and GlyT2. Nonetheless, the existence of this type of input is consistent with many prior physiological observations indicating that the resting activity of RTN neurons is regulated at rest by both GABA and glutamate inputs in addition to pH (Nattie and Li, 1995; Nattie et al., 2001). More recent work indicates that some of the glutamatergic inputs to RTN probably originate from second-order chemoreceptor neurons located in the nucleus of the solitary tract (NTS) whereas some of their inhibitory inputs originate from NTS pump cells and various components of the respiratory pattern generator (Guyenet et al., 2005; Takakura et al., 2006; 2007). Orexinergic neurons may be another source of glutamatergic input to RTN neurons (Rosin et al., 2003; Dias et al., 2009).
The perikarya of RTN neurons contain a high density of mitochondria (2.5 mitochondria/μm3) indicating that these cells are metabolically very active. In comparison, neurons in other brain areas measured in adult rats, e.g. cerebellum, hippocampus and striatum, contain between 0.6 and 0.95 mitochondria per cubic micron (Bertoni-Freddari et al., 1993; Balietti et al., 2008; Platano et al., 2008). Other ultrastructural characteristics of RTN neurons such as the “fibrillary inclusion” bodies and the invaginated nuclei are not unique to RTN neurons and their significance is unknown (Peters et al., 1991). RTN perikarya and dendrites are covered by a number of astrocytic profiles. This morphological characteristic is again not unique to the RTN and also occurs in the nearby C1 region of the rostral ventrolateral medulla (Wang et al., 2006). Although we found no evidence of intrinsic pH-sensitivity in the C1 cells, this anatomical similarity does not rule out that the glial cells of the RTN region might contribute to central chemosensitivity. The proposed roles of RTN glia in central chemoreception include pH detection followed by action potential independent release of paracrine signals, notably ATP, and amplification of extracellular acidification in response to a rise in CO2 concentration (Putnam et al., 2004; Gourine, 2005; Erlichman et al., 2008).
Relationship between cc RTN neurons and the microcirculation
The notion that central chemoreceptors should be located in a highly perfused brain area next to blood vessels has been debated for decades and remains unsettled (Cragg et al., 1977; Severson et al., 2003; Nattie, 2006). Because the central chemoreflex has a slow time constant (Cragg et al., 1977; Smith et al., 2006), the argument has often been made that proximity of central respiratory chemoreceptors to blood vessels may be irrelevant. This is a fair critique with respect to the kinetic issue (time constant for equilibration between blood and brain pH) but there are many other considerations. For example, if the physiological variable that is regulated by central chemoreceptors via changes in breathing is arterial pCO2 rather than brain pH, it may be advantageous for central chemoreceptors to reside in a highly vascularized region where pCO2 is as close as possible to the arterial level at steady state (Nattie, 2006; Nattie and Li, 2008b). Furthermore, medullary blood flow is influenced by hypoxia and by blood pressure, conditions that may require some adjustment of the sensitivity of central chemoreceptors to the local pH (Cragg et al., 1977; Xie et al., 2006).
The medulla oblongata receives most of its arterial blood supply from penetrating arterioles that ascend from the ventral surface hence the high vascular density of the most superficial regions (Cragg et al., 1977). The region surrounding the cc RTN neurons conforms to this rule. Nonetheless, at the ultrastructural level, the density of capillaries, as opposed to larger vessels, in the vicinity of the cc RTN neurons seems unusually high and, of special interest, we observed numerous instances of direct apposition between the cc RTN neurons and the basement membrane of capillaries and direct appositions between these neurons and pericytes.
Cells located in the RTN region appear to be directly sensitive to hypoxia (Bodineau et al., 2001; Voituron et al., 2006). Although the cells shown to express c-Fos following hypoxia were not identified neurochemically in these reports, they might have been the Phox2b-expressing neurons that we have characterized. Conceivably, their particular sensitivity to hypoxia could be accounted for by their high metabolic activity that is, in turn, suggested by their high mitochondrial content.
Another interesting feature revealed by our EM analysis was the presence of large numbers of pericytes (perivascular microglia) in the RTN region. Pericytes are contractile cells related to vascular smooth muscle (Bergers and Song, 2005; Peppiatt et al., 2006). Their most commonly recognized function is the regulation of brain capillary flow. Pericytes are in contact with the blood vessels and are thought to be entirely shielded from neurons by glial processes (Bergers and Song, 2005; Peppiatt et al., 2006). As expected, contact between pericytes and glial cells were commonly observed in the RTN suggesting that, like elsewhere in the CNS, ATP released from glial cells probably regulates capillary blood flow by regulating pericyte contractions (Peppiatt et al., 2006; Koizumi and Fujishita, 2007; Koizumi et al., 2008). However, an unexpected feature of the RTN region was that some of the pericytes were directly apposed to the eGFP-expressing neurons without an intervening glial process. To our knowledge, this feature is unusual and suggests that RTN pericytes and the cc RTN neurons could have unfettered biochemical interactions.
The functional significance of this potentially “quadripartite” arrangement consisting of the cc RTN neurons, their synaptic inputs, the surrounding glia and pericytes remains to be evaluated. From a cell biological standpoint, we only know that ATP is released in high amounts by superficial layers of the medulla, including the RTN region, during hypoxia and hypercapnia (Gourine et al., 2005a; Gourine et al., 2005b). The source of this ATP is likely to be the glial cells but other cells such as the pericytes themselves could also contribute. Based on slice work, ATP activates the cc RTN neurons in a TTX-independent manner via P2Y receptors suggesting that this type of receptor is probably expressed by these neurons (Mulkey et al., 2006). However, ATP application also produces P2X-receptor-mediated inhibitory effects on RTN neurons (Mulkey et al., 2006). These effects are GABA-receptor dependent and therefore presumably presynaptic. By analogy with other brain regions we can also assume that ATP released by the glial cells of the RTN region contracts the pericytes via P2Y receptors (Peppiatt et al., 2006; Koizumi et al., 2008).
Drug-induced alterations in cerebral blood flow alter the central chemoreflex (Xie et al., 2006). Specifically a reduction in brain perfusion produces hyperventilation and an increase in the gain of the central respiratory chemoreflex. These effects are tentatively explained by excessive brain acidification relative to the prevailing blood pCO2. Speculatively, the “quadripartite” arrangement between RTN neurons, glial cells and pericytes may serve to adjust the pH-response of the cc RTN neurons when blood flow changes so as to make these cells more precisely encode the level of blood pCO2. Such a process would be advantageous to central respiratory chemoreception either by minimizing the CO2 wash-out phenomenon, i.e. the slight parenchymal alkalization that could result if tissue perfusion is increased without concomitant rise in local metabolic activity such as during a rise in blood pressure or by adjusting the pH-response of the central chemoreceptors in the case of change in the local blood flow. As already mentioned, this reasoning presupposes that the physiological variable that is regulated by central chemoreceptors via changes in breathing is arterial pCO2 rather than brain pH, which is not proven (Nattie, 2006; Nattie and Li, 2008b).
In conclusion, using Phox2b-eGFP mice we demonstrated that a specific population of RTN neurons, the non-cholinergic, non-catecholaminergic glutamatergic Phox2b neurons, are uniformly pH-sensitive and we performed the first ultrastructural analysis of these cells. The results reinforce several other lines of evidence suggesting that the cc RTN neurons regulate breathing via the combination of a chemosensory mechanism and synaptic inputs. These studies also highlight that the cc RTN neurons reside in a highly perfused area of the medulla oblongata and they suggest that these neurons may have biochemical interactions with local glial cells and selected vascular components including pericytes.
Supplementary Material
Table 3.
Synaptic contacts on eGFP-labeled dendrites
| Diameter of dendrites (μm) | ||||
|---|---|---|---|---|
| 0.6–0.8 | 0.8–1.0 | 1.0–1.2 | ≥1.2 | |
| Number of asymmetric synapses | 2 | 8 | 7 | 6 |
| Number of symmetric synapses | 0 | 1 | 0 | 8 |
Acknowledgments
This work was supported by the following grants from the National Institutes of Health (HL74011 to PGG; HL18974 and DA08259 to TAM; NS33583 to DAB). Our thanks to Dr. Kazuto Kobayashi, Department of Molecular Genetics, Institute of Biomedical Sciences Fukushima Medical University School of Medicine for the use of his TH-GFP mouse, to Dr. JrGang Cheng, BAC Engineering Core, The Neuroscience Center, UNC-Chapel Hill, CB#7250, Chapel Hill, NC 27599 for making the Phox2b-eGFP BAC construct (B/G mouse line) and to Laura Kus, GENSAT Project at The Rockefeller University, for use of the GENSAT Phox2b-eGFP BAC transgenic mouse.
LITERATURE CITED
- Abercrombie M. Estimation of nuclear population from microtome sections. Anat Rec. 1946;94:239–247. doi: 10.1002/ar.1090940210. [DOI] [PubMed] [Google Scholar]
- Balietti M, Giorgetti B, Fattoretti P, Grossi Y, Di SG, Casoli T, Platano D, Solazzi M, Orlando F, Aicardi G, Bertoni-Freddari C. Ketogenic diets cause opposing changes in synaptic morphology in CA1 hippocampus and dentate gyrus of late-adult rats. Rejuvenation Res. 2008;11:631–640. doi: 10.1089/rej.2007.0650. [DOI] [PubMed] [Google Scholar]
- Bergers G, Song S. The role of pericytes in blood-vessel formation and maintenance. Neuro Oncol. 2005;7:452–464. doi: 10.1215/S1152851705000232. [DOI] [PMC free article] [PubMed] [Google Scholar]
- Bertoni-Freddari C, Fattoretti P, Casoli T, Spagna C, Meier-Ruge W, Ulrich J. Morphological plasticity of synaptic mitochondria during aging. Brain Res. 1993;628:193–200. doi: 10.1016/0006-8993(93)90955-m. [DOI] [PubMed] [Google Scholar]
- Bodineau L, Cayetanot F, Frugière A. Fos study of ponto-medullary areas involved in the in vitro hypoxic respiratory depression. NeuroReport. 2001;12:3913–3916. doi: 10.1097/00001756-200112210-00012. [DOI] [PubMed] [Google Scholar]
- Bodineau L, Frugière A, Marlot D, Wallois F. Connections between retrotrapezoid nucleus and nucleus tractus solitarii in cat. Neurosci Lett. 2000a;280:111–114. doi: 10.1016/s0304-3940(00)00770-9. [DOI] [PubMed] [Google Scholar]
- Bodineau L, Frugiere A, Marlot D, Wallois F. Effect of hypoxia on the activity of respiratory and non-respiratory modulated retrotrapezoid neurons of the cat. Auton Neurosci. 2000b;86:70–77. doi: 10.1016/S1566-0702(00)00237-X. [DOI] [PubMed] [Google Scholar]
- Bouvier J, Cheng JG. Recombineering-based procedure for creating Cre/loxP conditional knockouts in the mouse. Curr Protoc Mol Biol. 2009;Chapter 23 doi: 10.1002/0471142727.mb2313s85. Unit. [DOI] [PubMed] [Google Scholar]
- Brunet JF, Pattyn A. Phox2 genes - from patterning to connectivity. Curr Opin Genet Dev. 2002;12:435–440. doi: 10.1016/s0959-437x(02)00322-2. [DOI] [PubMed] [Google Scholar]
- Carlin RK, Grab DJ, Cohen RS, Siekevitz P. Isolation and characterization of postsynaptic densities from various brain regions: enrichment of different types of postsynaptic densities. J Cell Biol. 1980;86:831–845. doi: 10.1083/jcb.86.3.831. [DOI] [PMC free article] [PubMed] [Google Scholar]
- Connelly CA, Ellenberger HH, Feldman JL. Respiratory activity in retrotrapezoid nucleus in cat. Am J Physiol. 1990a;258:L33–L44. doi: 10.1152/ajplung.1990.258.2.L33. [DOI] [PubMed] [Google Scholar]
- Connelly CA, Ellenberger HH, Feldman JL. Respiratory activity in retrotrapezoid nucleus in cat. Am J Physiol. 1990b;258:L33–L44. doi: 10.1152/ajplung.1990.258.2.L33. [DOI] [PubMed] [Google Scholar]
- Cragg P, Patterson L, Purves MJ. The pH of brain extracellular fluid in the cat. J Physiol. 1977;272:137–166. doi: 10.1113/jphysiol.1977.sp012038. [DOI] [PMC free article] [PubMed] [Google Scholar]
- Dias MB, Li A, Nattie EE. Antagonism of orexin receptor 1 (OX1R) in the retrotrapezoid nucleus (RTN) inhibits the ventilatory response to hypercapnia predominantly in wakefulness. J Physiol. 2009 doi: 10.1113/jphysiol.2008.168260. [DOI] [PMC free article] [PubMed] [Google Scholar]
- Dubreuil V, Ramanantsoa N, Trochet D, Vaubourg V, Amiel J, Gallego J, Brunet JF, Goridis C. A human mutation in Phox2b causes lack of CO2 chemosensitivity, fatal central apnoea and specific loss of parafacial neurons. Proc Natl Acad Sci USA. 2008;105:1067–1072. doi: 10.1073/pnas.0709115105. [DOI] [PMC free article] [PubMed] [Google Scholar]
- Erlichman JS, Putnam RW, Leiter JC. Glial modulation of CO2 chemosensory excitability in the retrotrapezoid nucleus of rodents. Adv Exp Med Biol. 2008;605:317–321. doi: 10.1007/978-0-387-73693-8_55. [DOI] [PubMed] [Google Scholar]
- Gong S, Zheng C, Doughty ML, Losos K, Didkovsky N, Schambra UB, Nowak NJ, Joyner A, Leblanc G, Hatten ME, Heintz N. A gene expression atlas of the central nervous system based on bacterial artificial chromosomes. Nature. 2003;425:917–925. doi: 10.1038/nature02033. [DOI] [PubMed] [Google Scholar]
- Gourine AV. On the peripheral and central chemoreception and control of breathing: an emerging role of ATP. J Physiol. 2005;568:715–724. doi: 10.1113/jphysiol.2005.095968. [DOI] [PMC free article] [PubMed] [Google Scholar]
- Gourine AV, Llaudet E, Dale N, Spyer KM. ATP is a mediator of chemosensory transduction in the central nervous system. Nature. 2005a;436:108–111. doi: 10.1038/nature03690. [DOI] [PubMed] [Google Scholar]
- Gourine AV, Llaudet E, Dale N, Spyer KM. Release of ATP in the ventral medulla during hypoxia in rats: role in hypoxic ventilatory response. J Neurosci. 2005b;25:1211–1218. doi: 10.1523/JNEUROSCI.3763-04.2005. [DOI] [PMC free article] [PubMed] [Google Scholar]
- Guyenet PG. The 2008 Carl Ludwig Lecture: retrotrapezoid nucleus, CO2 homeostasis, and breathing automaticity. J Appl Physiol. 2008;105:404–416. doi: 10.1152/japplphysiol.90452.2008. [DOI] [PMC free article] [PubMed] [Google Scholar]
- Guyenet PG, Mulkey DK, Stornetta RL, Bayliss DA. Regulation of ventral surface chemoreceptors by the central respiratory pattern generator. J Neurosci. 2005;25:8938–8947. doi: 10.1523/JNEUROSCI.2415-05.2005. [DOI] [PMC free article] [PubMed] [Google Scholar]
- Hempel CM, Sugino K, Nelson SB. A manual method for the purification of fluorescently labeled neurons from the mammalian brain. Nat Protoc. 2007;2:2924–2929. doi: 10.1038/nprot.2007.416. [DOI] [PubMed] [Google Scholar]
- Kang BJ, Chang DA, Mackay DD, West GH, Moreira TS, Takakura AC, Gwilt JM, Guyenet PG, Stornetta RL. Central nervous system distribution of the transcription factor Phox2b in the adult rat. J Comp Neurol. 2007;503:627–641. doi: 10.1002/cne.21409. [DOI] [PubMed] [Google Scholar]
- Koizumi S, Fujishita K. Gliotransmitter ATP-mediated cell-to-cell communication. Brain Nerve. 2007;59:707–715. [PubMed] [Google Scholar]
- Koizumi S, Fujishita K, Sueishi K, Takata F, Kataoka Y. Astrocyte-to-pericyte communication mediated by ATP. Society for Neuroscience Abstracts, Abstract 242.16. 2008 Ref Type: Abstract. [Google Scholar]
- Li YW, Bayliss DA, Guyenet PG. C1 neurons of neonatal rats: Intrinsic beating properties and α2-adrenergic receptors. Am J Physiol-Reg Integr Comp Physiol. 1995;269:R1356–R1369. doi: 10.1152/ajpregu.1995.269.6.R1356. [DOI] [PubMed] [Google Scholar]
- Loeschcke HH. Central chemosensitivity and the reaction theory. J Physiol. 1982;332:1–24. doi: 10.1113/jphysiol.1982.sp014397. [DOI] [PMC free article] [PubMed] [Google Scholar]
- Matsushita N, Okada H, Yasoshima Y, Takahashi K, Kiuchi K, Kobayashi K. Dynamics of tyrosine hydroxylase promoter activity during midbrain dopaminergic neuron development. J Neurochem. 2002;82:295–304. doi: 10.1046/j.1471-4159.2002.00972.x. [DOI] [PubMed] [Google Scholar]
- Mitchell RA, Loeschcke HH, Severinghaus JW, Richardson JW, Massion WH. Regions of respiratory chemosensitivity on the surface of the medulla. Ann NY Acad Sci. 1963;109:661–681. [Google Scholar]
- Mulkey DK, Mistry AM, Guyenet PG, Bayliss DA. Purinergic P2 receptors modulate excitability but do not mediate pH sensitivity of RTN respiratory chemoreceptors. J Neurosci. 2006;26:7230–7233. doi: 10.1523/JNEUROSCI.1696-06.2006. [DOI] [PMC free article] [PubMed] [Google Scholar]
- Mulkey DK, Rosin DL, West G, Takakura AC, Moreira TS, Bayliss DA, Guyenet PG. Serotonergic neurons activate chemosensitive retrotrapezoid nucleus neurons by a pH-independent mechanism. Journal of Neuroscience. 2007a;27:14128–14138. doi: 10.1523/JNEUROSCI.4167-07.2007. [DOI] [PMC free article] [PubMed] [Google Scholar]
- Mulkey DK, Rosin DL, West G, Takakura AC, Moreira TS, Bayliss DA, Guyenet PG. Serotonergic neurons activate chemosensitive retrotrapezoid nucleus neurons by a pH-independent mechanism. J Neurosci. 2007b;27:14128–14138. doi: 10.1523/JNEUROSCI.4167-07.2007. [DOI] [PMC free article] [PubMed] [Google Scholar]
- Mulkey DK, Stornetta RL, Weston MC, Simmons JR, Parker A, Bayliss DA, Guyenet PG. Respiratory control by ventral surface chemoreceptor neurons in rats. Nat Neurosci. 2004;7:1360–1369. doi: 10.1038/nn1357. [DOI] [PubMed] [Google Scholar]
- Mulkey DK, Talley EM, Stornetta RL, Siegel AR, West GH, Chen X, Sen N, Mistry AM, Guyenet PG, Bayliss DA. TASK channels determine pH sensitivity in select respiratory neurons but do not contribute to central respiratory chemosensitivity. J Neurosci. 2007c;27:14049–14058. doi: 10.1523/JNEUROSCI.4254-07.2007. [DOI] [PMC free article] [PubMed] [Google Scholar]
- Nattie E. Why do we have both peripheral and central chemoreceptors? J Appl Physiol. 2006;100:9–10. doi: 10.1152/japplphysiol.01097.2005. [DOI] [PubMed] [Google Scholar]
- Nattie E, Shi J, Li A. Bicuculline dialysis in the retrotrapezoid nucleus (RTN) region stimulates breathing in the awake rat. Resp Physiol. 2001;124:179–193. doi: 10.1016/s0034-5687(00)00212-7. [DOI] [PubMed] [Google Scholar]
- Nattie EE, Fung ML, Li A, St John WM. Responses of respiratory modulated and tonic units in the retrotrapezoid nucleus to CO2. Resp Physiol. 1993;94:35–50. doi: 10.1016/0034-5687(93)90055-f. [DOI] [PubMed] [Google Scholar]
- Nattie EE, Li A. Rat retrotrapezoid nucleus iono- and metabotropic glutamate receptors and the control of breathing. J Appl Physiol. 1995;78:153–163. doi: 10.1152/jappl.1995.78.1.153. [DOI] [PubMed] [Google Scholar]
- Nattie EE, Li A. Central chemoreception is a complex system function that involves multiple brainstem sites. J Appl Physiol. 2008a doi: 10.1152/japplphysiol.00112.2008. [DOI] [PMC free article] [PubMed] [Google Scholar]
- Nattie G, Li A. Multiple central chemoreceptor sites: cell types and function in vivo. Adv Exp Med Biol. 2008b;605:343–347. doi: 10.1007/978-0-387-73693-8_60. [DOI] [PubMed] [Google Scholar]
- Onimaru H, Ikeda K, Kawakami K. CO2-Sensitive Preinspiratory Neurons of the Parafacial Respiratory Group Express Phox2b in the Neonatal Rat. J Neurosci. 2008;28:12845–12850. doi: 10.1523/JNEUROSCI.3625-08.2008. [DOI] [PMC free article] [PubMed] [Google Scholar]
- Pattyn A, Morin X, Cremer H, Goridis C, Brunet JF. Expression and interactions of the two closely related homeobox genes Phox2a and Phox2b during neurogenesis. Development. 1997;124:4065–4075. doi: 10.1242/dev.124.20.4065. [DOI] [PubMed] [Google Scholar]
- Paxinos G, Franklin KBJ. The Mouse Brain in Stereotaxic Coordinates. Amsterdam: Elsevier; 2004. [Google Scholar]
- Peppiatt CM, Howarth C, Mobbs P, Attwell D. Bidirectional control of CNS capillary diameter by pericytes. Nature. 2006;443:700–704. doi: 10.1038/nature05193. [DOI] [PMC free article] [PubMed] [Google Scholar]
- Perez RG, Waymire JC, Lin E, Liu JJ, Guo F, Zigmond MJ. A role for alpha-synuclein in the regulation of dopamine biosynthesis. J Neurosci. 2002;22:3090–3099. doi: 10.1523/JNEUROSCI.22-08-03090.2002. [DOI] [PMC free article] [PubMed] [Google Scholar]
- Peters A, Palay SL, Webster Hd. The Fine Structure of the Nervous System: Neurons and Their Supporting Cells. New York, NY: Oxford University Press; 1991. [Google Scholar]
- Platano D, Fattoretti P, Balietti M, Giorgetti B, Casoli T, Di SG, Bertoni-Freddari C, Aicardi G. Synaptic remodeling in hippocampal CA1 region of aged rats correlates with better memory performance in passive avoidance test. Rejuvenation Res. 2008;11:341–348. doi: 10.1089/rej.2008.0725. [DOI] [PubMed] [Google Scholar]
- Putnam RW, Filosa JA, Ritucci NA. Cellular mechanisms involved in CO(2) and acid signaling in chemosensitive neurons. Am J Physiol Cell Physiol. 2004;287:C1493–C1526. doi: 10.1152/ajpcell.00282.2004. [DOI] [PubMed] [Google Scholar]
- Rosin DL, Chang DA, Guyenet PG. Afferent and efferent connections of the rat retrotrapezoid nucleus. J Comp Neurol. 2006;499:64–89. doi: 10.1002/cne.21105. [DOI] [PubMed] [Google Scholar]
- Rosin DL, Weston MC, Sevigny CP, Stornetta RL, Guyenet PG. Hypothalamic orexin (hypocretin) neurons express vesicular glutamate transporters VGLUT1 or VGLUT2. J Comp Neurol. 2003;465:593–603. doi: 10.1002/cne.10860. [DOI] [PubMed] [Google Scholar]
- Sato M, Severinghaus JW, Basbaum AI. Medullary CO2 chemoreceptor neuron identification by c-fos immunocytochemistry. J Appl Physiol. 1992;73:96–100. doi: 10.1152/jappl.1992.73.1.96. [DOI] [PubMed] [Google Scholar]
- Severson CA, Wang W, Pieribone VA, Dohle CI, Richerson GB. Midbrain serotonergic neurons are central pH chemoreceptors. Nat Neurosci. 2003;6:1139–1140. doi: 10.1038/nn1130. [DOI] [PubMed] [Google Scholar]
- Smith CA, Rodman JR, Chenuel BJ, Henderson KS, Dempsey JA. Response time and sensitivity of the ventilatory response to CO2 in unanesthetized intact dogs: central vs. peripheral chemoreceptors. J Appl Physiol. 2006;100:13–19. doi: 10.1152/japplphysiol.00926.2005. [DOI] [PubMed] [Google Scholar]
- Smith JC, Morrison DE, Ellenberger HH, Otto MR, Feldman JL. Brainstem projections to the major respiratory neuron populations in the medulla of the cat. J Comp Neurol. 1989;281:69–96. doi: 10.1002/cne.902810107. [DOI] [PubMed] [Google Scholar]
- Stornetta RL, Guyenet PG. Distribution of glutamic acid decarboxylase mRNA-containing neurons in rat medulla projecting to thoracic spinal cord in relation to monoaminergic brainstem neurons. J Comp Neurol. 1999;407:367–380. [PubMed] [Google Scholar]
- Stornetta RL, Moreira TS, Takakura AC, Kang BJ, Chang DA, West GH, Brunet JF, Mulkey DK, Bayliss DA, Guyenet PG. Expression of Phox2b by brainstem neurons involved in chemosensory integration in the adult rat. J Neurosci. 2006;26:10305–10314. doi: 10.1523/JNEUROSCI.2917-06.2006. [DOI] [PMC free article] [PubMed] [Google Scholar]
- Stornetta RL, Spirovski D, Moreira TS, Takakura AC, West GH, Gwilt JM, Pilowsky PM, Guyenet PG. Galanin is a selective marker of the retrotrapezoid nucleus in rats. J Comp Neurol. 2009;512:373–383. doi: 10.1002/cne.21897. [DOI] [PMC free article] [PubMed] [Google Scholar]
- Stunden CE, Filosa JA, Garcia AJ, Dean JB, Putnam RW. Development of in vivo ventilatory and single chemosensitive neuron responses to hypercapnia in rats. Resp Physiol. 2001;127:135–155. doi: 10.1016/s0034-5687(01)00242-0. [DOI] [PubMed] [Google Scholar]
- Takakura AC, Moreira TS, Colombari E, West GH, Stornetta RL, Guyenet PG. Peripheral chemoreceptor inputs to retrotrapezoid nucleus (RTN) CO2-sensitive neurons in rats. J Physiol. 2006;572:503–523. doi: 10.1113/jphysiol.2005.103788. [DOI] [PMC free article] [PubMed] [Google Scholar]
- Takakura AC, Moreira TS, Stornetta RL, West GH, Gwilt JM, Guyenet PG. Selective lesion of retrotrapezoid Phox2b-expressing neurons raises the apnoeic threshold in rats. J Physiol. 2008;586:2975–2991. doi: 10.1113/jphysiol.2008.153163. [DOI] [PMC free article] [PubMed] [Google Scholar]
- Takakura AC, Moreira TS, West GH, Gwilt JM, Colombari E, Stornetta RL, Guyenet PG. GABAergic pump cells of solitary tract nucleus innervate retrotrapezoid nucleus chemoreceptors. J Neurophysiol. 2007;98:374–381. doi: 10.1152/jn.00322.2007. [DOI] [PubMed] [Google Scholar]
- Teppema LJ, Berkenbosch A, Veening JG, Olievier CN. Hypercapnia induces c-fos expression in neurons of retrotrapezoid nucleus in cats. Brain Res. 1994;635:353–356. doi: 10.1016/0006-8993(94)91462-1. [DOI] [PubMed] [Google Scholar]
- Trouth CO, Odek-Ogunde M, Holloway JA. Morphological observations on superficial medullary CO2--chemosensitive areas. Brain Res. 1982;246:35–45. doi: 10.1016/0006-8993(82)90139-1. [DOI] [PubMed] [Google Scholar]
- Voituron N, Frugiere A, Champagnat J, Bodineau L. Hypoxia-sensing properties of the newborn rat ventral medullary surface in vitro. J Physiol. 2006;577:55–68. doi: 10.1113/jphysiol.2006.111765. [DOI] [PMC free article] [PubMed] [Google Scholar]
- Wang G, Drake CT, Rozenblit M, Zhou P, Alves SE, Herrick SP, Hayashi S, Warrier S, Iadecola C, Milner TA. Evidence that estrogen directly and indirectly modulates C1 adrenergic bulbospinal neurons in the rostral ventrolateral medulla. Brain Res. 2006;1094:163–178. doi: 10.1016/j.brainres.2006.03.089. [DOI] [PubMed] [Google Scholar]
- Weibel ER. Stereological Methods. New York: Academic Press; 1979. [Google Scholar]
- Weston MC, Stornetta RL, Guyenet PG. Glutamatergic neuronal projections from the marginal layer of the rostral ventral medulla to the respiratory centers in rats. J Comp Neurol. 2004;473:73–85. doi: 10.1002/cne.20076. [DOI] [PubMed] [Google Scholar]
- Xie A, Skatrud JB, Morgan BJ, Chenuel B, Khayat R, Reichmuth K, Lin J, Dempsey JA. Influence of Cerebrovascular Function on the Hypercapnic Ventilatory Response in Healthy Humans. J Physiol. 2006;577:319–329. doi: 10.1113/jphysiol.2006.110627. [DOI] [PMC free article] [PubMed] [Google Scholar]
- Yan Z, Surmeier DJ. Muscarinic (m2/m4) receptors reduce N- and P-type Ca2+ currents in rat neostriatal cholinergic interneurons through a fast, membrane-delimited, G-protein pathway. J Neurosci. 1996;16:2592–2604. doi: 10.1523/JNEUROSCI.16-08-02592.1996. [DOI] [PMC free article] [PubMed] [Google Scholar]
Associated Data
This section collects any data citations, data availability statements, or supplementary materials included in this article.