

Abstract
In this paper we explore a method of segmentation of muscle interstitial adipose tissue (IAT) in MR images of the thigh. The objective is to apply the method towards research into biomarkers of osteoarthritis (OA). T1-weighted images of the thigh are intensity standardized through bias field correction and intensity normalization. IAT within the thigh muscles is then segmented using a threshold combined with morphological constraints applied on connected regions in the thresholded image. The morphological constraints can be adjusted to allow for highly sensitive or highly specific IAT segmentation. The use of the morphological constraints improved the specificity of IAT segmentation over a threshold segmentation method from 0.54 to 0.67, while retaining a nearly equivalent sensitivity of 0.82 compared to 0.84. We then present a preliminary statistical analysis to demonstrate the application of the automated IAT segmentation. Finally, we specify a protocol for further exploration of IAT by leveraging the massive imaging dataset of the Osteoarthritis Initiative (OAI).
I. Introduction
Osteoarthritis (OA), the most common form of arthritis, is a major public health concern [1]. It is estimated that up to 90% of the population over 65 has incidence of OA in one or more joints [2].
Muscle strength has been shown to be an important factor in incidence and progression of OA [3]. In terms of knee OA, the extensors of the knee – the quadriceps muscles – are an important component of joint stabilization and reduction and dispersion of mechanical stress across the joint and have been analyzed extensively [4,5].
Infiltration of lean muscle with adipose tissue (fat) has been associated with both an increase in age, an increase in body-mass index (BMI), and a decrease in strength [6–8]. Muscle cross-sectional area (CSA) has been related to muscle strength [9], however the presence of interstitial adipose tissue (IAT) causes an increase in CSA that is theoretically not commensurate with an appropriate increase in strength. Since muscle IAT is related to BMI, and BMI is a risk factor for OA [10], the presence and amount of IAT may be a risk factor for OA and a biomarker of disease incidence and progression. Therefore, the proper segmentation and quantification of IAT is important not only for the proper measurement of adipose-tissue free (ATF) muscle for use in calculation of CSA, but for the detection and characterization of the disease process of OA, and other diseases such as muscular dystrophy [11], that may show an increased infiltration of fat into muscle. The current work focuses on the segmentation and characterization of IAT in the thigh muscles and its relation to knee OA.
II. Data
The data used for this analysis was from 103 subjects in the progression cohort of the Osteoarthritis Initiative’s (OAI) public use dataset (www.oai.ucsf.edu). Population and OA characteristics of these subjects are summarized in Table I. T1-weighted axial scans of the thigh were acquired at 5 mm intervals in the range from 10 cm to 17 cm proximal to the medial femoral epiphysis of the right knee. A single slice taken at 17 cm proximal to the right medial femoral epiphysis was analyzed for this study (Fig. 1).
Table I.
Subject information.
| Number of subjects | 103 | |
|---|---|---|
| Age | Mean | 61.2 |
| Standard deviation | 10.2 | |
| Sex | Male | 53 |
| Female | 50 | |
| Ethnicity | Caucasian | 85 |
| African American | 16 | |
| Asian | 1 | |
| Other non-white | 1 | |
| KL grade | 0 | 11 |
| 1 | 19 | |
| 2 | 34 | |
| 3 | 35 | |
| 4 | 4 | |
Figure 1.
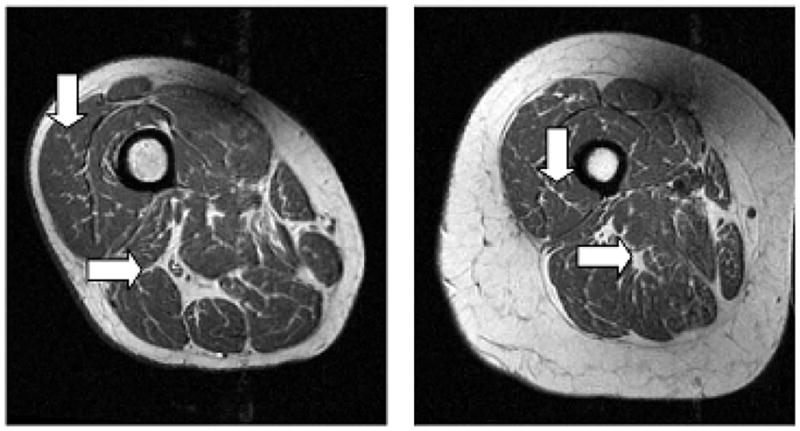
Intensity standardized images from two subjects. Note the thin, high intensity areas within low intensity muscle, which correspond to IAT or connective tissue (vertical arrows). Also, note the high intensity areas between muscles (horizontal arrows).
III. Methodology
A. IAT segmentation
The objective of the IAT segmentation procedure is to correctly segment areas corresponding to adipose tissue within the muscle, while disregarding high intensity areas of fat and connective tissue between the muscles (Fig. 1), high intensity flow artifacts, and subcutaneous fat (the high intensity region between the outer borders of the muscles and the skin). The segmentation of IAT was performed using thresholding and morphological operations on intensity-standardized images.
1) Intensity Standardization
The first step in the analysis was standardization of the MR image intensities. The standardization of MR image intensities across subjects with images acquired at different times and at different sites was important for the consistent application of the developed algorithm. Intensity standardization was achieved through a two step process:
Bias field correction: Correction of the slowly-varying multiplicative bias field created by magnetic field inhomogeneities using the nonparametric, nonuniform intensity normalization (N3) algorithm [12].
Normalization: Normalization of the bias-field corrected images to a scale of [0,1]. The top 0.05% of intensities (outliers) were removed from the scaling operation and instead scaled directly to one.
Bias field correction followed by intensity normalization for intensity standardization has been suggested in previous work [13].
2) Thigh mask generation
A thigh mask was created for removal of the background, subcutaneous fat, and the femur. The standardization of intensities allowed for a single set of thresholds to be applied across all images and all patients. The background was removed by removing all pixels with intensity less than 0.15. The subcutaneous fat was removed by thresholding the standardized image intensities to retain pixels with intensities above 0.5 and then removing connected regions that were larger than 1000 pixels. The threshold and area constraint values were experimentally determined to provide consistent removal of the subcutaneous fat regions among all subjects. The femur was removed using an automated procedure consisting of morphological detection of the high intensity medulla and a level set-based segmentation of the surrounding low-intensity cortex [14].
3) Thresholding
A threshold based on the image’s standardized histogram was applied to separate fat from muscle/background. The threshold was applied to the image with the thigh mask applied (Fig. 2). The threshold was experimentally varied and compared to the results of manual segmentations to define an optimal value for discriminating muscle and fat. The details of the manual segmentation validation method (a random point-based method) are described in section III.B, – Validation.
Figure 2.
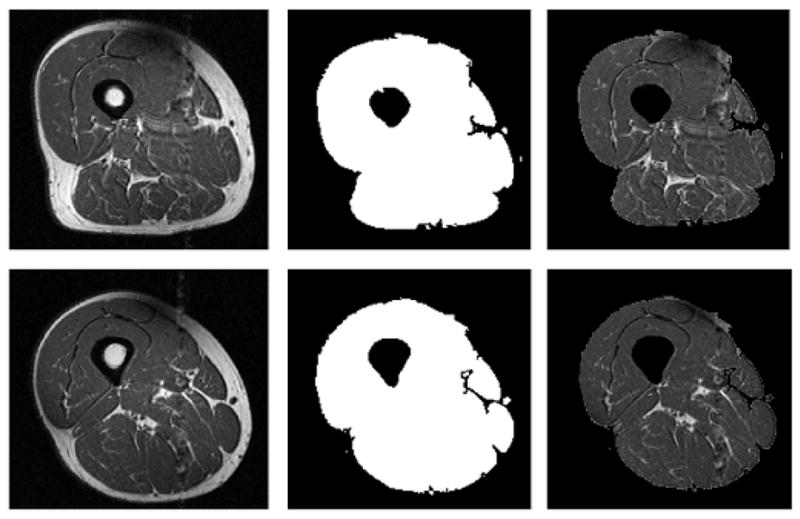
Two examples (top and bottom rows) of original images (left column), automatically generated thigh masks used for threshold and morphological segmentation and validation (center column), and images after application of mask (right column). The random low intensity and high intensity points used for validation were selected from the masked images.
4) Morphological processing
Areas of IAT were segmented by applying morphological constraints to labeled connected-region maps of the binary image created by the thresholding operation (Fig. 2). These masks were used in a comparative analysis between threshold-only segmentation of IAT and segmentation of IAT using morphological constraints based on region skeletonization.
IAT generally appears as thin, high intensity regions in the images. To extract these thin regions, a morphological skeletonization [15] was performed on each connected region, followed by the application of a threshold on the minimum ratio of the skeletonized region area to the original region area. The threshold effectively removed thick regions that may correspond to subcutaneous fat, intermuscular fat, and intermuscular connective tissue, leaving only regions of IAT in the muscle. The value of the ratio threshold was varied to characterize its effect on sensitivity and specificity measures of the automated segmentation. The method of validation is described in section III.B.
B. Validation
The performance of the algorithm was validated through comparison to manual point-based tissue selection. A trained user was asked to identify randomly selected points in a thigh mask (Fig. 2). The mask constrained the random points selected to mainly be within the muscle or between muscles.
There were 100 points selected by the algorithm – 50 high intensity points (standardized intensity > 0.5), which most likely corresponded to fat/connective tissue, and 50 low intensity points (standardized intensity ≤ 0.5), which most likely corresponded to lean muscle. The user classified each pixel as (1) muscle, (2) IAT, or (3) intermuscular fat, artifact, or don’t know.
Agreement between the manual reader and the automated procedure was quantified using sensitivity and specificity. Sensitivity measured the number of IAT pixels classified correctly, and specificity measured the number of muscle/other tissue pixels classified correctly.
C. Statistical analysis of IAT content in the quadriceps muscles and subject sex, age, and BMI
An analysis of IAT content in the quadriceps muscle was undertaken using a pooled variance t-test. Associations between IAT area, lean muscle area (total muscle cross-sectional area (CSA) minus IAT area), and IAT area to lean muscle area ratio and the subjects’ sex, age, and BMI were explored. This analysis was performed using manual segmentations of the quadriceps muscle performed by trained readers, combined with the automated IAT segmentation procedure. The initial segmentation threshold was set to 0.45 and the skeletonization ratio threshold was set to 0.4, values which produced a balance between the sensitivity and specificity of IAT segmentation (Table II).
Table II.
Mean (standard deviation) sensitivities and specificities for varying ratios of skeletonized region area to original region area. Threshold = 0.45.
| Ratio | Sensitivity | Specificity |
|---|---|---|
| 0.0 | 0.84 (0.18) | 0.54 (0.06) |
| 0.1 | 0.84 (0.18) | 0.54 (0.06) |
| 0.2 | 0.84 (0.18) | 0.54 (0.07) |
| 0.3 | 0.84 (0.18) | 0.56 (0.08) |
| 0.4 | 0.82 (0.19) | 0.67 (0.13) |
| 0.5 | 0.67 (0.24) | 0.82 (0.11) |
| 0.6 | 0.50 (0.25) | 0.90 (0.06) |
| 0.7 | 0.31 (0.22) | 0.95 (0.03) |
IV. Results
Example images with IAT segmented are shown in Fig. 3. Mean sensitivities and specificities for the automated IAT extraction, when compared to the point-based manual segmentation as the ground truth, are shown in Tables II and III. Table II shows results when the initial thresholding has a value of 0.45, while Table III shows the result when the threshold is set to 0.35. In one of the best-performing cases, with the threshold set to 0.45 and the skeletonization ratio set to 0.4, the specificity of IAT segmentation increased from 0.54 to 0.67, while the sensitivity only decreased to 0.82 from 0.84. Table IV shows the sensitivities and specificities of a simple thresholding operation on the muscle masks of Fig. 2 for segmentation of IAT.
Figure 3.
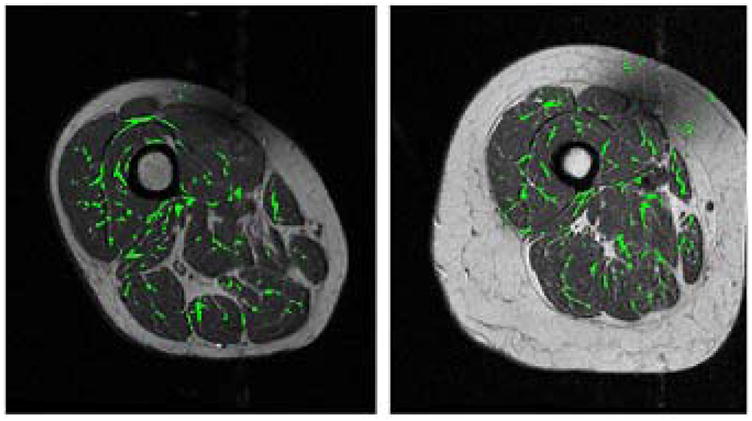
Images from Fig. 1 with automatically segmented regions of intramuscular fat overlaid in green. Note that the regions of intermuscular fat and connective tissue shown in Fig. 1 are generally not segmented.
Table III.
Mean (standard deviation) sensitivities and specificities for varying ratios of skeletonized region area to original region area. Threshold = 0.35.
| Ratio | Sensitivity | Specificity |
|---|---|---|
| 0.0 | 0.94 (0.16) | 0.48 (0.05) |
| 0.1 | 0.94 (0.16) | 0.48 (0.05) |
| 0.2 | 0.94 (0.16) | 0.48 (0.07) |
| 0.3 | 0.94 (0.16) | 0.50 (0.09) |
| 0.4 | 0.87 (0.20) | 0.64 (0.14) |
| 0.5 | 0.53 (0.23) | 0.87 (0.09) |
| 0.6 | 0.19 (0.18) | 0.95 (0.03) |
| 0.7 | 0.08 (0.15) | 0.97 (0.02) |
Table IV.
Mean (standard deviation) sensitivities and specificities for different thresholds applied to thigh images with subcutaneous fat and femur removed (see Fig. 2).
| Threshold | Sensitivity | Specificity |
|---|---|---|
| 0.25 | 1.00 (0.02) | 0.18 (0.06) |
| 0.30 | 0.97 (0.11) | 0.40 (0.06) |
| 0.35 | 0.94 (0.16) | 0.48 (0.05) |
| 0.40 | 0.88 (0.17) | 0.51 (0.06) |
| 0.45 | 0.84 (0.18) | 0.54 (0.06) |
| 0.50 | 0.79 (0.18) | 0.56 (0.06) |
| 0.55 | 0.46 (0.20) | 0.65 (0.06) |
| 0.60 | 0.24 (0.15) | 0.72 (0.06) |
Both the IAT and lean muscle measurements are significantly dependent on the subject’s age and BMI (Table V), as expected from previous work [6–8]. The sex of the subject is only significant for lean muscle area.
Table V.
Results (p-values) of the pooled variance t-test for IAT measurements and sex, age, and BMI. Age was grouped into two categories: < 62 and ≥ 62. BMI was group into two categories: < 30 and ≥ 30.
| Stratified variable |
|||
|---|---|---|---|
| IAT, Muscle Measurement | Sex | Age | BMI |
| IAT Area | 0.66 | 0.008* | 0.0001* |
| Lean Muscle Area | < 0.0001* | 0.006* | 0.02* |
| IAT:Lean Muscle Area | 0.09 | 0.002* | 0.008* |
represents significance at p = 0.05 level
V. Discussion
The algorithm performs best using an initial intensity threshold of 0.45. A skeletonization ratio threshold of 0.4 causes a significant increase in the specificity of IAT segmentation from smaller ratio thresholds with only a minimal reduction in sensitivity. The best sensitivity being achieved at a skeletonization ratio of 0 is sensible, as this corresponds to the case when effectively no morphological constraint is applied to the fat regions extracted using the threshold. Similarly, the best specificity at the most stringent skeletonization ratio of 0.7 is a logical result. The IAT segmentation algorithm can be adjusted to provide a highly sensitive or highly specific performance, depending on the requirements of the user.
This algorithm is currently being employed for the analysis of biomarkers of OA – specifically associations between IAT and KL grade [16], a clinical measure of OA severity. Initial statistical analyses focused on possible confounding variables for the comparisons. It was found that age and BMI will need to be adjusted for when using the proposed measurements of IAT, lean muscle, and ratios between IAT and lean muscle. Sex is a significant confounder with measurements of lean muscle, but not of IAT. These results were expected based on previous work, and offer a preliminary validation of the efficacy of the automated IAT segmentation for further statistical analyses.
VI. Future Work
Further work in this area will include refinement of the automated segmentation procedure based on augmented MRI acquisition protocols and incorporation of features such as texture and gradient measures for delineation of IAT. Preliminary work with a Phillips 3T scanner has identified the use of the SPAIR fat saturation protocol with an inversion recovery time of 100 ms as an optimal supplement for the further development of our algorithms (Fig. 4). We intend to optimize our automated IAT segmentation method using training data acquired using the original OAI thigh acquisition protocol supplemented with the new fat saturation sequence.
Figure 4.
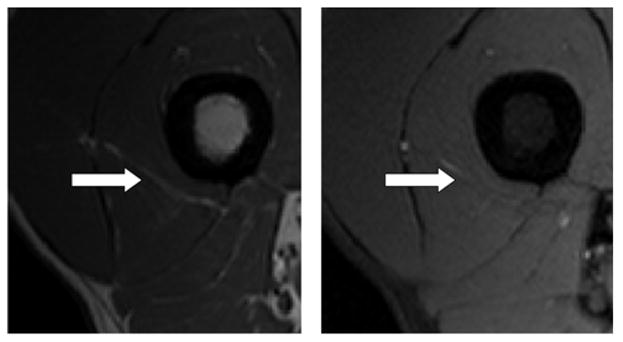
Experimental acquisition using OAI protocol (left) and SPAIR fat saturation acquisition (right). Note the area of high intensity (white arrow) in image acquired using OAI protocol and corresponding high intensity region on fat saturation (areas of fat should be dark in this image).
VII. Conclusions
We have developed and validated a method of IAT segmentation on 103 subjects from the OAI. The algorithm improves the specificity over a threshold segmentation method without sacrificing sensitivity. The objective is to employ the segmentation for the analysis of imaging biomarkers of OA. Initial statistical analysis has demonstrated the necessity to adjust for confounding variables of sex, age, and BMI in future work. Further investigation will explore the potential association between KL grade and IAT. In addition, the specification of a new protocol based on the original OAI protocol has been proposed. This new protocol will aid in the further development of the current automated IAT segmentation algorithm, and the analysis of IAT as a biomarker for OA.
Acknowledgments
The authors would like to thank G. Jia, S. Sammett, and M. Knopp for generating the protocol and images presented in the “Future work” section and useful discussions. The authors would like to thank K. Belkacem-Boussaid for helpful discussions and review of the manuscript. The project described was supported by Award Number R01LM010119 from the National Library of Medicine. The content is solely the responsibility of the authors and does not necessarily represent the official views of the National Library of Medicine or the National Institutes of Health.
References
- 1.Felson DT, Lawrence RC, Dieppe PA, et al. Osteoarthritis: New Insights. Part 1: The Disease and Its Risk Factors. Ann Intern Med. 2000 October 17;133:635–646. doi: 10.7326/0003-4819-133-8-200010170-00016. [DOI] [PubMed] [Google Scholar]
- 2.Buckwalter JA, Einhorn TA, Simon SR American Academy of Orthopaedic Surgeons. Orthopaedic Basic Science Biology and Biomechanics of the Musculoskeletal System. Rosemont, IL: American Academy of Orthopaedic Surgeons; 2000. [Google Scholar]
- 3.Steultjens MP, Dekker J, van Baar ME, Oostendorp RA, Bijlsma JW. Muscle strength, pain and disability in patients with osteoarthritis. Clin Rehabil. 2001 Jun;15(3):331–41. doi: 10.1191/026921501673178408. [DOI] [PubMed] [Google Scholar]
- 4.Baker KR, Xu L, Zhang Y, Nevitt M, Niu J, Aliabadi P, Yu W, Felson D. Quadriceps weakness and its relationship to tibiofemoral and patellafemoral knee osteoarthritis in Chinese. Arthritis Rheum. 2004;50:1815–21. doi: 10.1002/art.20261. [DOI] [PubMed] [Google Scholar]
- 5.O’Reilly SC, Jones A, Muir KR, Doherty M. Quadriceps weakness in knee osteoarthritis: the effect on pain and disability. Ann Rheum Dis. 1998;57:588–594. doi: 10.1136/ard.57.10.588. [DOI] [PMC free article] [PubMed] [Google Scholar]
- 6.Overend TJ, Cunningham DA, Paterson DH, Lefcoe MS. Thigh composition in young and elderly men determined by computed tomography. Clin Physiol. 1992;12:629–640. doi: 10.1111/j.1475-097x.1992.tb00366.x. [DOI] [PubMed] [Google Scholar]
- 7.Rice CL, Cunningham DA, Paterson DH, Lefcoe MS. Arm and leg composition determined by computed tomography in young and elderly men. Clin Physiol. 1989;9:207–220. doi: 10.1111/j.1475-097x.1989.tb00973.x. [DOI] [PubMed] [Google Scholar]
- 8.Goodpaster BH, Theriault R, Watkins SC, Kelley DE. Intramuscular lipid content is increased in obesity and decreased by weight loss. Metabolism. 2000;49:467–472. doi: 10.1016/s0026-0495(00)80010-4. [DOI] [PubMed] [Google Scholar]
- 9.Klein CS, Rice CL, Marsh GD. Normalized force, activation, and coactivation in the arm muscles of young and old men. J Appl Physiol. 2001;91(3):1341–1349. doi: 10.1152/jappl.2001.91.3.1341. [DOI] [PubMed] [Google Scholar]
- 10.Manek NJ, Hart D, Spector TD, MacGregor AJ. The Association of Body Mass Index and Osteoarthritis of the Knee Joint. Arthritis and Rheumatism. 2003 April;48(4):1024–1029. doi: 10.1002/art.10884. [DOI] [PubMed] [Google Scholar]
- 11.Marden FA, Connoly AM, Siegel MJ, Rubin DA. Compositional analysis of muscle in boys with Duchenne muscular dystrophy using MR imaging. Skeletal Radiol. 2005;34:140–148. doi: 10.1007/s00256-004-0825-3. [DOI] [PubMed] [Google Scholar]
- 12.Sled JG, Zijdenbox AP, Evans AC. A nonparametric method for automatic correction of intensity nonuniformity in MRI data. IEEE Trans Med Imag. 1998 Feb;17(1):87–97. doi: 10.1109/42.668698. [DOI] [PubMed] [Google Scholar]
- 13.Madabhushi A, Udupa JK. Interplay Between Intensity Standardization and Inhomogeneity Correction in MR Image Processing. IEEE Trans Med Img. 2005 May;24(5) doi: 10.1109/TMI.2004.843256. [DOI] [PubMed] [Google Scholar]
- 14.Prescott JW, Pennell M, Best TM, Swanson MS, Haq F, Jackson R, Gurcan MN. EMBC 2009. Minneapolis, MN: Sept, 2009. An Automated Method to Segment the Femur for Osteoarthritis Research. [DOI] [PMC free article] [PubMed] [Google Scholar]
- 15.Gonzalez RC, Woods RE. Digital Image Processing using Matlab. Prentice Hall; Upper Saddle River, NJ: 2003. [Google Scholar]
- 16.Kellgren J, Lawrence J. Radiological assessment of osteoarthritis. Ann Rheum Dis. 1957;16:494–501. doi: 10.1136/ard.16.4.494. [DOI] [PMC free article] [PubMed] [Google Scholar]