

Abstract
Neurophysiological studies have recently documented multisensory properties in ‘unimodal’ visual neurons of the cat posterolateral lateral suprasylvian (PLLS) cortex, a retinotopically organized area involved in visual motion processing. In this extrastriate visual area, a region has been identified where both visual and auditory stimuli were independently effective in activating neurons (bimodal zone), as well as a second region where visually-evoked activity was significantly facilitated by concurrent auditory stimulation but was unaffected by auditory stimulation alone (subthreshold multisensory region). Given their different distributions, the possible corticocortical connectivity underlying these distinct forms of crossmodal convergence was examined using biotinylated dextran amine (BDA) tracer methods in 21 adult cats. The auditory cortical areas examined included the anterior auditory field (AAF), primary auditory cortex (AI), dorsal zone (DZ), secondary auditory cortex (AII), field of the rostral suprasylvian sulcus (FRS), field anterior ectosylvian sulcus (FAES) and the posterior auditory field (PAF). Of these regions, the DZ, AI, AII, and FAES were found to project to the both the bimodal zone and the subthreshold region of the PLLS. This convergence of crossmodal inputs to the PLLS suggests not only that complex auditory information has access to this region but also that these connections provide the substrate for the different forms (bimodal versus subthreshold) of multisensory processing which may facilitate its functional role in visual motion processing.
Keywords: Auditory, Somatosensory, Visual, Association cortex, Multisensory
Introduction
Most neurophysiological studies of multisensory processing have examined this phenomenon in structures that are reknown for their multisensory properties, such as the superior colliculus or the cortical areas of the superior temporal sulcus or intraparietal suclus. In these areas, neurons that are activated by more than one sensory modality, known as bimodal (or trimodal) neurons, have been readily identified. Recently, however, multisensory inputs or effects have been documented in sensory areas previously regarded as ‘unimodal’ (for review, see Ghazanfar and Schroeder 2006). Although many of the cited studies describe or assume the presence of traditional bimodal responses in ‘unimodal’ areas, other studies have identified subthreshold crossmodal effects in regions that appear to be activated only by the single, dominant modality of the region. For example, although somatosensory (but not auditory) responses can be elicited from neurons in the somatotopically organized fourth somatosensory area (SIV), the tactile responses of nearly 70% of SIV neurons could be suppressed by concurrent auditory stimulation (Dehner et al. 2004). Similarly, over 25% of apparently ‘unimodal’ auditory responses in the auditory field of the anterior ectosylvian sulcus (FAES) were suppressed by the presence of a somatosensory stimulus (Meredith et al. 2006). In each of these studies, specific corticocortical pathways were shown to be involved in the generation of the crossmodal effect.
More recently, multisensory effects, including both suprathreshold (bimodal) and subthreshold responses have been documented in the visual area of the posterolateral lateral suprasylvian (PLLS) (Yaka et al. 2002; Allman and Meredith 2007; Allman et al. 2008a). The PLLS, known to be retinopically organized (Grant and Shipp 1991; Palmer et al. 1978) and involved in visual motion processing (Rauschecker et al. 1987; Robitaille et al. 2008), has been shown to have visual responses significantly facilitated by auditory cues that were ineffective when presented alone. The stratified distribution of these bimodal and subthreshold multisensory effects is summarized in Fig. 1 (modified from (Allman and Meredith 2007). Subthreshold multisensory neurons were generally encountered within the lower bank and fundus of the PLLS, primarily where visual receptive fields of <40° eccentricity were represented. In contrast, the bimodal neurons were largely segregated to the most external aspects of the sulcal bank at the PLLS border with the auditory dorsal zone (DZ) (He et al. 1997; He and Hashikawa 1998; Stecker et al. 2005) and where the receptive fields represented the visual periphery (>90% of bimodal neurons had visual receptive fields at eccentricities >40°). Given this differential distribution of multisensory types within the PLLS, it should be possible to determine, based on connectivity, whether these multisensory types are generated by similar or different sources of crossmodal inputs. However, the crossmodal connectivity of the PLLS is unknown.
Fig. 1.
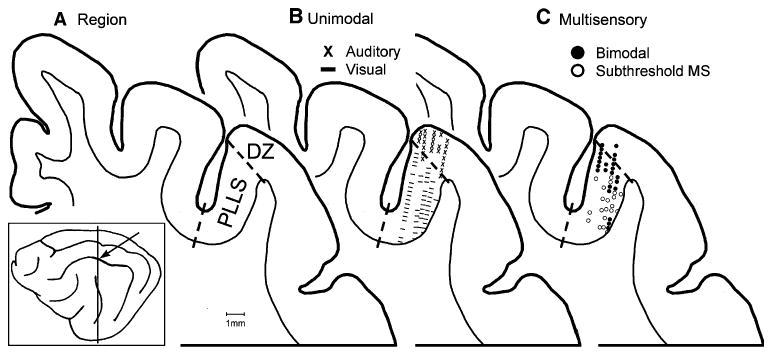
Sensory and multisensory processing in visual PLLS. The location of the posterolateral lateral suprasylvian (PLLS, arrow) visual area and the level of the coronal section (vertical line) are shown on the lateral view of the cat brain (box). Section A shows the location of the visual PLLS in the lateral bank and fundus of the suprasylvian sulcus and the auditory DZ at the lip of the sulcus. This same coronal section is used again in (B), and (C). In B the locations of physiologically identified visual PLLS neurons (dashes) and auditory DZ neurons (x's) are shown (from Allman and Meredith 2007). In C the location of physiologically recorded bimodal (closed circles) and subthreshold (open circles) multisensory neurons (1 marker = one or more neurons; see Allman and Meredith 2007) are shown. Note that bimodal neurons were clustered along the outer border of PLLS with DZ, while subthreshold multisensory neurons were found at deeper locations along the bank of the suprasylvian sulcus. PES posterior ectosylvian sulcus
Visual inputs to the PLLS arise from numerous ipsilateral visual cortical areas, including areas 17, 18, 19, 20, and 21 (summarized in (Norita et al. 1996); see also (Symonds and Rosenquist 1984; Sherk 1986). In contrast, there have been no reports of projections to the PLLS from any of the 13 different areas composing the auditory cortices. However, because the PLLS is involved in the analysis and perception of visual motion (Rauschecker et al. 1987; Robitaille et al. 2008), which is a function that involves localization of a moving stimulus, it would seem logical that auditory inputs to this region might arise from areas that have auditory localization capabilities. Because primary auditory area (A1), dorsal zone (DZ), posterior auditory field (PAF) and field anterior ectosylvian sulcus (FAES) (see Fig. 2 showing auditory cortices modified from (Rouiller et al. 1991) contribute to auditory localization functions (Malhotra et al. 2004; Malhotra and Lomber 2007), it seems likely that one or several of these areas might project to the PLLS to provide a cross-modal basis for one or both forms of multisensory processing in that structure. Therefore, the present experiments used neuroanatomical tract tracing techniques to determine which auditory cortical areas provide the source(s) of crossmodal inputs to the PLLS. A preliminary abstract of this work has been presented (Clemo et al. 2007b).
Fig. 2.
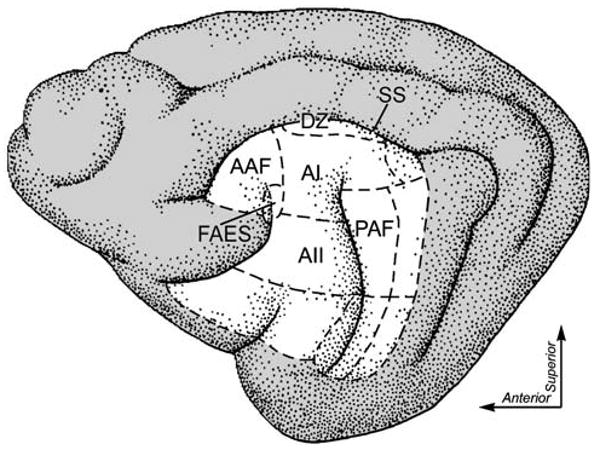
Location of auditory cortical areas and the visual PLLS. Auditory regions of cat cortex (dashed outlines based on Rouiller et al. 1991). Areas sampled in this study for possible projections to the visual PLLS include the FRS Field of the rostral suprasylvian sulcus, AAF anterior auditory field, FAES field anterior ectosylvian sulcus, AI primary auditory area, AII secondary auditory cortical area, PAF posterior auditory field, DZ dorsal zone, SS suprasylvian sulcus
Methods
All procedures were performed in compliance with the Guide for Care and Use of Laboratory Animals (NIH publication 86–23) and the National Research Council's Guidelines for Care and Use of Mammals in Neuroscience and Behavioral Research (2003) and approved by the Institutional Animal Care and Use Committee at Virginia Commonwealth University. These same procedures are also described in (Clemo and Meredith 2004; Clemo et al. 2007a) and are largely summarized here.
Surgery and tracer injection
Cats (n = 21) were anesthetized (sodium pentobarbital, 40 mg/kg, i.v.) and their heads placed in a stereotaxic frame. A craniotomy was performed under aseptic surgical conditions to expose the cortical area targeted for injection. Sulcal and gyral landmarks, as defined by (Rouiller et al. 1991), were used to guide injections in DZ (n = 2), A1 (n = 2), gyral aspects of the AAF (n = 3), AII (n = 1) the auditory field of the anterior ectosylvian sulcus (FAES; n = 6) and PAF (n = 2) and into the auditory-multisensory field located deep in the sulcal wall of the rostral suprasylvian sulcus, newly identified as field of the rostral suprasylvian sulcus (FRS; n = 5) (Clemo et al. 2006). For the injection, a modified electrode carrier was used to support a 31 gauge, 5 μl Hamilton syringe filled with biotinylated dextran amine (BDA; 10,000 MW; lysine fixable; 10% in 0.1 M phosphate buffer), which was pressure injected (volume = 0.350–4.5 μl; see Table 1 for details). For wide cortical areas, multiple injections were made to enhance a thorough filling of the region. After a 10 min delay, the needle was withdrawn, the cortex was covered with gel foam, the skin around the wound sutured closed, and standard postoperative care was provided.
Table 1.
Summary of injection sites and volumes
| Injection site | # of cases | Injection volume (nl) |
|---|---|---|
| DZ | 2 | 3 × 500; 4 × 250 |
| AI | 2 | 3 × 500; 8 × 150 |
| AAF | 3 | 7 × 150, 800, 800 |
| AII | 1 | 8 × 150 |
| FRS | 5 | 500, 800, 800, 800, 1,000 |
| PAF | 2 | 9 × 500; 9 × 200 |
| FAES | 6 | 375, 650, 700, 700, 1,000, 1,000 |
Histological processing
After injection, a 7–10 day survival period for tracer transport was allowed. The animal was then euthanized (barbiturate overdose, 120 mg/kg i.p.) and perfused intracardially with saline followed by fixative (4.0% paraformaldehyde, 0.5% glutaraldehyde). The cranium was then opened and the brain was blocked stereotaxically, removed and cryoprotected. Coronal sections (50 μm thick) were cut serially using a freezing microtome. One series of sections, at 300 μm intervals, was processed for visualization of BDA using the avidin-biotin peroxidase method, according to the protocol of Veenman et al. (Veenman et al. 1992) using nickle-cobalt intensification. An additional series of sections was counterstained using a standard cresyl violet procedure to assist in cytoarchitectonic and laminar identification.
Data analysis
These experiments sought to examine auditory connections to the lateral bank of the suprasylvian sulcus. The visual PLLS is located in the fundus and lower aspects of the bank, as defined by (Heath and Jones 1971; Palmer et al. 1978) (See Fig. 1). In addition, an auditory area occupies the external lip and upper portions of the same lateral bank (Palmer et al. 1978; Reale and Imig 1980), identified as the area DZ (He et al. 1997; Stecker et al. 2005). Anteriorly, the DZ extends deeply into the bank but tapers posteriorly to occupy only the lip of the sulcus, as depicted by Palmer et al. (1978). This relationship is also described by (van der Gucht et al. 2001), who identified cytoarchitectonic distinctions between the PLLS and DZ that correspond with the distribution of these representations. In addition, auditory areas AI, AII and PAF are known to project to DZ (He et al. 1997), and boutons labeled from these regions would be expected to densely label that region of the lip and external bank of the sulcus. In contrast, terminal labeling (if present) in the lower aspects of the bank and fundus would indicate inputs to the area of the visual PLLS.
BDA labeled axon terminals within the lateral bank of the suprasylvian sulcus and adjoining gyrus were digitally plotted using a light microscope (Nikon ES-600) coupled with a PC-driven digitizing stage controlled by Neurolucida software (MBF Biosciences, Williston VT). To reconstruct the distribution of labeled boutons, the outline, the border between gray and white matter, and the positions of labeled axon terminals were traced digitally for each selected section. BDA-labeled axon terminals appeared as sharp, black swellings at the end of thin axon stalks or as symmetrical varicosities along the course of an axon. Injection sites, defined as the large accumulation of densely labeled cells and neuropil at the end of the injection needle track, were also plotted. Tissue outlines and injection sites were plotted at 40 × magnification. Labeled boutons were plotted at 200 × magnification, and the Neurolucida software (MBF Bioscheinces, Williston VT) kept a count of the number of identified boutons. Images of BDA-labeled features were taken using a Nikon Eclipse E800 research microscope with a Diagnostics Instruments Spot RT digital camera. The images were subsequently sized and graphically arranged and their contrast and brightness adjusted with Adobe Photoshop.
The laminar distribution of labeled boutons was assessed by using a projecting microscope to cast an image of an adjacent cresyl violet-stained section onto a printed version of the plot. The location of lamina IV was traced and then transferred back to the digital plot. Computer-drawn contour lines then delimited the supragranular (above layer IV) and infragranular (below layer IV) layers for the section and NeuroExplorer software (MBF Biosciences, Williston VT) was used to count the number of labeled boutons within each laminar group. For each section, a ratio of labeled boutons in supragranular versus infragranular locations was determined and the mean was then calculated for all sections through the PLLS for a given case and, ultimately, projection source (e.g., AI, FAES, etc.).
Surface view contour plots of the distribution of labeled boutons in the lateral bank were made for representative cases for each injected auditory area. For each tissue section, the bank was divided into 500 μm-wide columns (extending from pia to white matter, approximately 1,500 μm) from the fundus and to the lip. NeuroExplorer software was used to count the number of labeled boutons within each column for each tissue section. Columnar data from all sections, and the spacing between sections, for a given case were tabulated. Areal contour plots were constructed using Sigmaplot.
Results
Following injection of the tracer into each of the auditory cortices, terminal labeling was sought in the lateral bank of the suprasylvian sulcus, examples of which are shown in the photomicrographs in Fig. 3. However, depending on the location of the injection, terminal label varied in its intensity and distribution (see Figs. 4, 5). Two general groups of projection patterns were observed based on their access (or lack thereof) to the region of the visual PLLS (as defined in Methods, above). Injections into DZ, AI, All and FAES each resulted in terminal label in locations that included both the PLLS and DZ areas, as depicted in Fig. 4, while those from PAF, AAF, and FRS generally lacked projections to the PLLS, as shown in Fig. 5. These effects are described in detail, below.
Fig. 3.
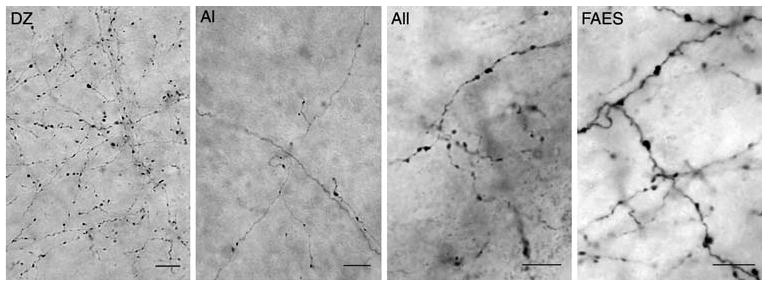
Photomicrographs of auditory cortical projections to visual PLLS. Each image shows BDA-positive axons (thin, wavy black lines) and boutons (black swellings) taken in the PLLS as a result of tracer injection into the indicated auditory cortical region. Abbreviations same as in Fig. 2. Scale bars = 10 μm
Fig. 4.
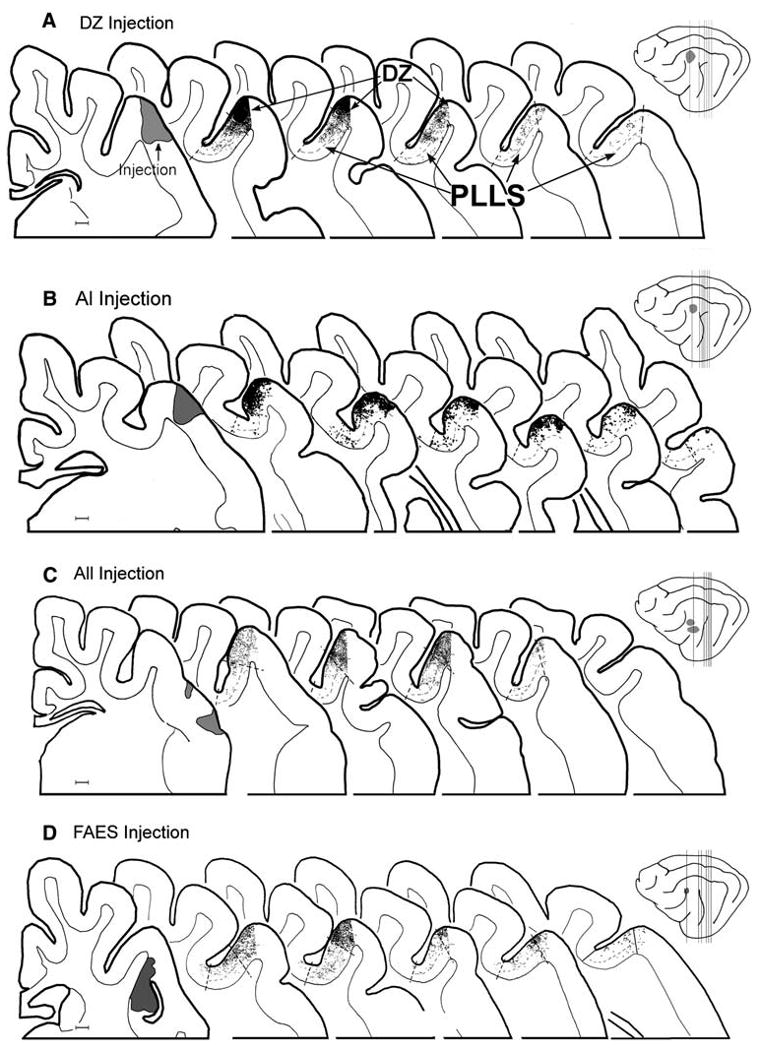
Projections from auditory cortices DZ, AI, All, and FAES. The schematics of the lateral brain views (far right) show the locations of injections (shaded gray) made into (a) DZ, (b) AI, (c) AII, and (d) FAES and the locations from which the enlarged serial coronal sections were taken (vertical lines). Serial coronal sections through the PLLS show the approximate borders of the PLLS and DZ regions (dashed lines that cross the cortical mantle); layer IV is also indicated by dashed lines. The location of labeled boutons (1 dot = 1 axon terminal) are plotted in the lateral bank of the suprasylvian sulcus. The a DZ and b AI injections produced heavy terminal labeling in DZ at its border with the PLLS, and became progressively reduced with depth in the bank of the sulcus as well as at posterior levels. Injection of c AII revealed similar pattern of labeling in the lateral bank, and the change in labeling density is especially evident at the border between PLLS and DZ. The d FAES injection produced consistent terminal labeling in the PLLS, not only at its border with DZ, but also along its bank and fundus. Labeling in PLLS in each case was the heaviest in the anterior sections which was progressively reduced, but not eliminated, at more posterior levels of the PLLS. Scale bars = 1 mm
Fig. 5.
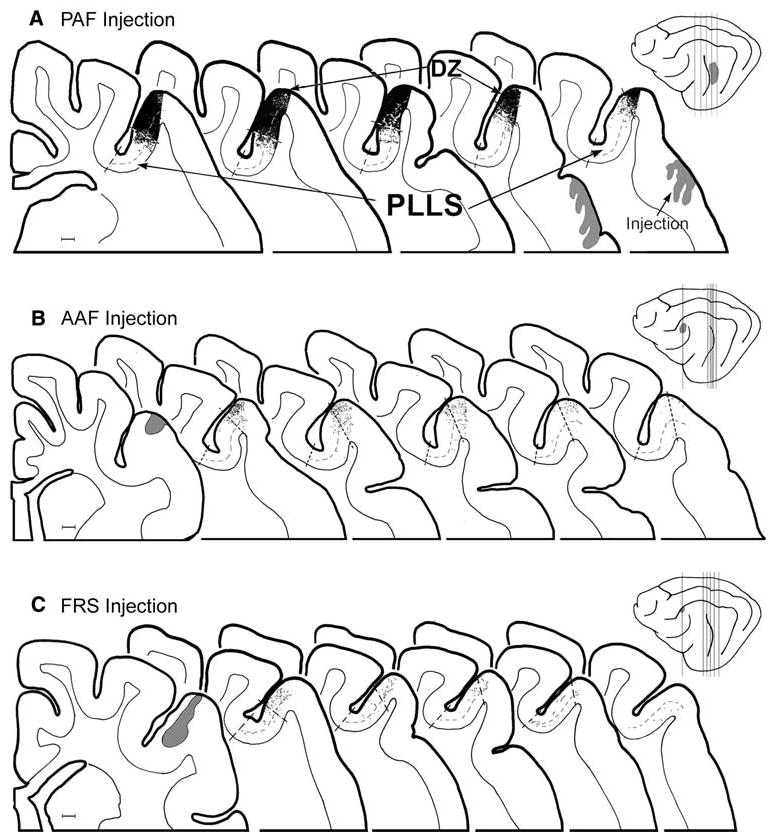
Projections from auditory cortices PAF, AAF, and FRS. The schematics of the lateral brain views (far right) show the locations of injections (shaded gray) made into a PAF (and extending ventrally into vPAF), b AAF, and c FRS, and the locations from which the enlarged serial coronal sections were taken (vertical lines). Serial coronal sections containing the suprasylvian sulcus show the approximate borders of the PLLS and DZ as well as the location of layer IV (dashed lines) The location of labeled boutons (1 dot = 1 axon terminal) are plotted in relation to the PLLS and DZ. PAF/vPAF injections produced almost no label in PLLS, except perhaps at its border with DZ, which itself was heavily labeled. In contrast, AAF injections yielded virtually no label in PLLS and only sparse projections to DZ. Injection of FRS revealed almost no terminal label in the PLLS, with very sparse levels of label in the adjoining DZ. Scale bars = 1 mm
The injections into DZ (n = 2) included the lateral lip of the suprasylvian sulcus and extended onto the adjoining gyrus, as shown in Fig. 4a. At more posterior levels of the brain that contain the PLLS, the resultant label in the lateral bank of the suprasylvian sulcus was densest in the external portion of the bank (corresponding to DZ), with a progressive decrease in label at successively deeper regions in the sulcus (corresponding to PLLS). This progressive decrease in label density occurred at each AP level, but was heaviest anteriorly and reduced substantially at posterior levels. Within the PLLS itself, labeled boutons from DZ favored the supragranular layers by a ratio of 70:30 (supra- vs. infragranular).
Projections from AI (n = 2) also resulted in terminal label in locations that included both the PLLS and DZ areas, as depicted in Fig. 4b. In this example, as well as the other case, the area of densest terminal label, observed at the lip and external portion of the sulcus, corresponds to the auditory area DZ. Anteriorly, the DZ label was heavy while posteriorly it decreased as the DZ decreased in size and changed sulcal position. In contrast, the lower areas of the lateral bank of the sulcus, where visual PLLS resides, received reduced levels of terminal labeling from AI. These AI inputs became progressively attenuated with depth in the PLLS and were quite sparse in the fundus. In addition, AI inputs were reduced at more posterior locations of the PLLS. Within the PLLS, terminal labeling from AI tended to favor termination within the supragranular layers by an 88:11 ratio (supra- vs. infragranular).
Tracer injection into auditory area AII revealed projections that were the heaviest along the lip and external portion of the bank of the suprasylvian sulcus corresponding to the location of auditory area DZ (Fig. 4c). By comparison, substantially reduced amounts of label continued into the lower aspects of the bank matching the location of the visual PLLS. The few AII boutons present in the PLLS distributed evenly across the supragranular and infragranular layers, with a supra-infragranular ratio of 59:41.
Similar to the other auditory cortical areas, injections into the auditory FAES (n = 5) produced terminal label in DZ. In addition, FAES injection consistently produced terminal label not only in the bank of the PLLS, but also in the fundus. This pattern of labeling again extended throughout the anterior-posterior extent of the PLLS. Fig. 4d shows a representative example of a FAES injection that produced terminal label in the entire area corresponding to the PLLS. The FAES projection heavily favored termination in the supragranular layers of the PLLS (85:15 supra- vs. infragranular ratio).
To examine projections from PAF (n = 2), a large volume of tracer was injected (see Table 1). Consequently, labeling when present was quite heavy. As shown in Fig. 5a, the lip and external portion of the lateral bank of the suprasylvian sulcus, corresponding to DZ, were very heavily labeled from the PAF (and portions of vPAF). However, only modest labeling was observed in the bank of the PLLS while its fundic portion was uniformly devoid of label. When tracer injections were made into the AAF (n = 5), terminal labeling in the PLLS, as depicted in Fig. 5b, was consistently sparse with only a few terminals within the bank and fundus of the PLLS. What little label that was present was largely confined to the lip of the lateral bank of the suprasylvian sulcus, corresponding to the location of DZ. Few projections from the FRS (n = 5) were observed in either the auditory DZ or visual PLLS. Figure 5c shows that the FRS projections to the lateral bank of the suprasylvian sulcus were quite sparse.
For representative examples of each of the injection areas, surface contour plots were generated to depict the distribution of labeled bouton terminals in the lateral bank of the suprasylvian sulcus. These plots are shown in Fig. 6 where, in each of the panels, the suprasylvian sulcus is opened to visualize the surface of its banks and fundus. Areas with similar density of terminal labeling are joined within a single contour and are rendered with the same grey level (highest density: > 1,000 boutons per 500 × 1,500 μm column = black; lowest density: <10 boutons per 500 × 1,500 μm column = white; etc. according to key). Represented from this perspective, these data show that each of the auditory cortical areas have some degree of access to the region corresponding to DZ, where the densest levels of terminal label were often observed. Areas of the lower bank and fundus received reduced levels of terminal label from DZ, Al, AII, and FAES and in each case there was a general, progressive reduction in bouton density from lip (bottom of panel) to fundus (top of panel) that appeared to indicate the transition of innervation across the DZ to PLLS. Furthermore, the density and distribution of terminal label generally tapered and became reduced at the more posterior levels for each of the auditory cortical afferents. On the other hand, PAF, AAF, and FRS revealed virtually no projections to in the PLLS region.
Fig. 6.

Areal contour plots of auditory projections to visual PLLS. The boxed schematic (top left) shows the area of the suprasylvian sulcus that is opened to reveal its banks, fundus, and the representations of visual PLLS and auditory DZ. A corresponding surface view of the lateral bank (fundus at top, lip at bottom) is shown in each of the subsequent contour plots of label from injections into the auditory cortical areas DZ, Al, AII, FAES, PAF, AAF, and FRS. In each plot, as indicated in the lower left panel, the x-axis represents the anterior–posterior dimension of the lateral bank (scale = 300 μm), the y-axis represents the distance from the lip to the fundus (scale = 500 μm), DZ is located in the external portion (lip) and PLLS is located in the internal portion and fundus of the bank. The contours represent the density of boutons (black = >1,000 boutons/500 μm-wide column, white = 0 boutons/column; see key for details) labeled from the indicated injection site; contours of similar grey level have same range of bouton density. In each case, the distribution of inputs was densest anteriorly and near the lip of the sulcus (corresponding to the location of auditory DZ—note its anterior-posterior taper). However, only when DZ, AI, AII, or FAES were injected was terminal label observed in the bank or fundus, corresponding to the location of the visual PLLS. Small brain schematics at top right of each panel indicate the location of the injection site as well as the anterior/posterior levels of the suprasylvian sulcus from which the data was derived
Functional correspondence with distribution of auditory cortical inputs
The distribution of auditory cortical projections to the PLLS was compared to the distribution of the different types of multisensory neurons identified in that region, each of which occupies relatively separate regions of the PLLS (Allman and Meredith 2007). In Allman and Meredith (2007), recording penetrations into PLLS first passed through auditory DZ where auditory neurons were identified, and then encountered visual-auditory (bimodal) neurons in the PLLS. Thus, the population of bimodal neurons was largely found at the border of PLLS and DZ, as depicted in Fig. 1. Therefore, it is logical to assume that terminal label found at the point of transition between PLLS and DZ correlates with the bimodal zone of the PLLS. As illustrated in Fig. 7, auditory cortical projections from DZ, AI, AII, and FAES each spanned the bimodal region. The second form of multisensory neuron observed in the PLLS exhibited subthreshold multisensory processing (Allman and Meredith 2007; Allman et al. 2008a). The distribution of subthreshold multisensory neurons essentially filled the PLLS except at its outer extent, occupied by the bimodal zone. Therefore, it is assumed that auditory cortical projections that terminate in the lower lateral bank and fundus of the PLLS contribute to the multisensory processing of the subthreshold region.
Fig. 7.

Correlation of multisensory physiology with crossmodal anatomy of the PLLS. The boxed view of a magnified coronal section through the PLLS (left) shows the distribution of physiologically determined multisensory neurons from Fig. 1 (closed circles = bimodal; open circles = subthreshold, 1 dot = one or more neurons; from Allman and Meredith 2007). Note that bimodal neurons were found largely at the outer border of the PLLS where it meets the DZ, while subthreshold multisensory neurons were found deeper the bank of the PLLS. To the right, the magnified views of the same region of the PLLS summarize the anatomical projections from the different auditory cortices: A DZ, B AI, C AII, D FAES, E PAF, F AAF, and G FRS. When these anatomical plots are compared with the summary of multisensory physiology, it is apparent that several of the auditory cortical areas (DZ, AI, AII, and FAES) targeted the multisensory (both bimodal and subthreshold) region of the PLLS. Dashed lines indicate the approximate borders of the PLLS. Lateral brain schematic (far right) indicates level from which coronal sections were taken
Discussion
These results indicate that, of the possible sources of auditory cortical input that could underlie the multisensory properties of the PLLS (Yaka et al. 2002; Allman and Meredith 2007; Allman et al. 2008a), several auditory fields are likely candidates. The auditory fields of DZ, AI, AII, and FAES each revealed projections to the bank and fundus of the PLLS. These projections not only distributed to the portions of the PLLS where subthreshold multisensory neurons are located, but also to the transition region of the PLLS that abuts the DZ zone, where bimodal PLLS neurons reside (Allman and Meredith 2007; Allman et al. 2008a). Given that multisensory responses of PLLS neurons in these locations are largely subthreshold, the presence of a modest (rather than heavy or dense) crossmodal projection seems proportional to its functional effect. On the other hand, all auditory regions tested had some level of connection with the adjoining DZ, and many of these sources provided the heaviest projection levels to the suprasylvian region that would be assumed to generate suprathreshold activation there (He et al. 1997; Stecker et al. 2005). Last, the auditory cortical regions of PAF, AAF, and FRS largely failed to innervate the lower bank and fundic portions of the PLLS and thus seem unlikely to play a role in subthreshold multisensory processing there. However, with the present techniques it is not possible to determine whether projections to these same areas contributed to the bimodal transition zone of the PLLS or not.
Since the PLLS is a visual structure, its connections with other visual, but not non-visual, areas have been documented (Norita et al. 1996; Sherk 1986). However, with the recent observations of auditory influences on visual PLLS neurons (Yaka et al. 2002; Allman and Meredith 2007; Allman et al. 2008a), the question of their non-visual source is now more relevant. Examinations of thalamic connections of the PLLS suggest that it has a modest connection with the dorsal nucleus of the medial geniculate (Raczkowski and Rosenquist 1983), but this label may have resulted from encroachment of the injection into the auditory DZ. Studies in other species indicate that projections from auditory to visual cortical areas do occur. Falchier et al. (2002) showed that the peripheral representation of V1 in cynomolgus monkey received connections, albeit sparsely, from core and association areas of auditory cortex. Rockland and Ojima (2003) found axons from auditory association areas of the superior temporal sulcus of the macaque to project sparsely to the representation of the periphery in V1, and somewhat more densely to the lower visual field of V2. Similarly, ferret auditory cortices project to the lower visual field representation of Area 21 (homologue of V4), and the functional consequences of this projection was revealed not as overt, suprathreshold auditory responses (e.g., bimodal neurons) but as subthreshold effects modulated by local GABAergic circuits (Allman et al. 2008b). The present study shows a modest/sparse crossmodal projection from auditory core and association areas to an extrastriate (association) visual area. These inputs appear to target the peripheral visual representation in the PLLS, since they mostly terminate on the bank of the PLLS (representing peripheral visual space), rather than fundus (representing central visual space; Palmer et al. 1978). Functionally, these auditory inputs appear consistent with the two forms of multisensory convergence (bimodal and subthreshold) in the region. Although collectively few in number, these studies of auditory-to-visual connectivity reveal several commonalities. Each of the projections appear to target a specific portion of the visual field representation and they are sparse in comparison to other projections known to generate suprathreshold responses, leading to the likelihood that such projections underlie crossmodal subthreshold/ modulatory effects at their target sites (Allman et al. 2008b).
For the auditory cortical areas that project to the PLLS, a gradient of projection density was generally observed that reduced with depth toward the fundus. Given the presence of bimodal (suprathreshold) neurons higher in the PLLS bank and subthreshold multisensory neurons located at lower levels (Allman and Meredith 2007), it is tempting to speculate that a simple mechanism like innervation density may account for the different suprathreshold and subthreshold multisensory response properties. If true, such a scenario would suggest that the different forms of multisensory processing might represent a continuum along which cross-modal inputs, at one end, are suffcient to evoke suprathreshold responses while, at the other end, inputs are so sparse (or non-existant) as to elicit no multisensory effect under any circumstances (e.g., unimodal). This scenario could also incorporate a large intermediate range of input levels that serve to modulate subthreshold multisensory effects.
As with any neuroanatomical tract-tracing study, it is acknowledged that it is difficult to demonstrate with precision the anatomical borders of physiologically determined effects. In the context of the present experiments, however, there is little ambiguity about the lower bank and fundus of the PLLS: this region exhibits subthreshold multisensory processing (Allman and Meredith 2007) and it either received a projection (from DZ, AI, AII, and FAES) or it did not (from PAF, AAF, and FRS). The issue of the bimodal zone of the PLLS is more complex, since it changes position on the bank of the sulcus with anterior-posterior level. However, the change in density of projection at the PLLS/DZ border correlates well with this anterior–posterior shift as well as with the physiological identification of bimodal neurons at that same location. It should also be noted that the injection volumes were different among the different cases. For example, because it is difficult to inject the submerged, cortical region of the FAES without over-filling it, tracer volumes injected into the FAES were 3–10 times smaller than those used to inject some of the gyral auditory areas (see Table 1). Thus, denser and more extensive labeling patterns should be expected from gyral areas such as AI or PAF than from the FAES. However, the larger tracer volumes delivered to PAF resulted in comparatively little terminal label in the lower banks and fundus of the PLLS, indicating that the influence of this region on the PLLS is likely to be minimal. What needs to be examined with better resolution is the specific functional contribution from DZ, AI, AII, and FAES to the bimodal area and to bimodal processing therein. Finally, it should be understood that these methods revealing areal multisensory convergence only demonstrate the potential for that convergence to occur on individual neurons. The fact remains that there are few anatomical reports documenting multisensory convergence at the neuronal level anywhere in the nervous system (Keniston et al. 2006; Shore et al. 2000), although multitudes of physiological studies convincingly document that such convergence has taken place.
The fact that projections from four different auditory cortical areas (DZ, AI, AII, and FAES) converge in the PLLS suggests that auditory information conveyed to that structure is rather complex. In general, areas AI, AII, and DZ are known for their processing of tonal information (Reale and Imig 1980; Schreiner and Cynader 1984; Stecker et al. 2005), while FAES neurons respond best to stimuli with complex frequency properties (Clarey and Irvine 1986). In addition, neurons in the FAES are sensitive to the spatial properties of auditory stimuli (Las et al. 2008; Middlebrooks et al. 1994), and the organization of receptive field features of AI neurons has been suggested to assist with auditory localization functions (Middlebrooks et al. 1980). Thus, it is possible that these converging projections relay information about the tonal as well as spatial properties of acoustic stimuli to the PLLS, both of which are features that can aid in localization and motion detection capacities. Accordingly, the functional consequences of crossmodal projections to the PLLS might relate to its well-documented role in visual motion processing (Rauschecker et al. 1987; Robitaille et al. 2008). Lesions of the PLLS produce behavioral deficits in the perception of moving visual stimuli (Hardy and Stein 1988; Spear et al. 1983), and neurons there show distinctive visual motion direction and velocity sensitivities (Rauschecker et al. 1987; Robitaille et al. 2008). How converging auditory inputs might influence these functions is not yet known. Concurrent auditory stimulation clearly facilitates visual responses throughout the PLLS, an effect that possibly enhances the perception of a moving object. Given the presence of bimodal auditory-visual neurons in the PLLS (Allman and Meredith 2007, Allman et al. 2008a; Yaka et al. 2002), it is also apparent that auditory inputs alone are sufficient to drive those PLLS neurons whose visual receptive fields reside in peripheral visual space (>40° eccentricity; (Allman and Meredith 2007). Furthermore, the projection of tone-related information from DZ, AI, and AII might contribute to Doppler-like features of auditory motion processing here. Consequently, the peripheral representation in the PLLS may provide a neuronal model in which auditory motion processing might be investigated. Ultimately, further experiments are necessary to determine whether auditory inputs influence the parametric qualities of visual motion processing in PLLS and, thereby, afford insight into these functional role(s) of multisensory processing in this heretofore ‘unimodal’ sensory region.
Acknowledgments
We thank Les Keniston for excellent technical assistance. Supported by NIH Grant NS39460 to MAM and by NIH-NINDS Center Core Grant to VCU Anatomy and Neurobiology Microscopy Facility. The original article is available at springerlink.com
Contributor Information
H. Ruth Clemo, Email: rclemo@vcu.edu, Department of Anatomy and Neurobiology, Virginia Commonwealth University School of Medicine, Richmond, VA 23298-0709, USA.
Brian. L. Allman, Department of Anatomy and Neurobiology, Virginia Commonwealth University School of Medicine, Richmond, VA 23298-0709, USA
M. Alex Meredith, Department of Anatomy and Neurobiology, Virginia Commonwealth University School of Medicine, Richmond, VA 23298-0709, USA.
Giriraj. K. Sharma, Department of Physiology, Virginia Commonwealth University, School of Medicine, Richmond, VA 23298-0709, USA
References
- Allman BL, Meredith MA. Multisensory processing in “unimodal” neurons: cross-modal subthreshold auditory effects in cat extrastriate visual cortex. J Neurophysiol. 2007;98:545–549. doi: 10.1152/jn.00173.2007. [DOI] [PubMed] [Google Scholar]
- Allman BL, Keniston LP, Meredith MA. Sensory requirements for subthreshold multisensory processing: sensitivity to parametric changes in stimulus quality and position. Brain Res. 2008a doi: 10.1016/brainres.2008.03.086. [DOI] [PMC free article] [PubMed] [Google Scholar]
- Allman BL, Bittencourt-Navarrete RE, Keniston LP, Medina A, Wang MY, Meredith MA. Do cross-modal projections always result in multisensory integration? Cerebral Cortex. 2008b doi: 10.1093/cercor/bhm230. [DOI] [PMC free article] [PubMed] [Google Scholar]
- Clarey JC, Irvine DR. Auditory response properties of neurons in the anterior ectosylvian sulcus of the cat. Brain Res. 1986;386:12–19. doi: 10.1016/0006-8993(86)90136-8. [DOI] [PubMed] [Google Scholar]
- Clemo HR, Meredith MA. Cortico-cortical relations of cat somatosensory areas SIV and SV. Somatosens Mot Res. 2004;21:199–209. doi: 10.1080/08990220400012505. [DOI] [PubMed] [Google Scholar]
- Clemo HR, Allman BL, Meredith MA. Multiple sensory representations in the cat rostral suprasylvian sulcal cortex. Soc Neurosci Abstr. 2006;36:639.12. [Google Scholar]
- Clemo HR, Allman BL, Donlan MA, Meredith MA. Sensory and multisensory representations within the cat rostral suprasylvian cortex. J Comp Neurol. 2007a;503:110–127. doi: 10.1002/cne.21378. [DOI] [PubMed] [Google Scholar]
- Clemo HR, Sharma GK, Allman BL, Meredith MA. Crossmodal connections underlying subthreshold multisensory processing: auditory cortical projections to extrastriate visual cortex in cat. Soc Neurosci Abstr. 2007b;37:614.13. [Google Scholar]
- Dehner LR, Keniston LP, Clemo HR, Meredith MA. Cross-modal circuitry between auditory and somatosensory areas of the cat anterior ectosylvian sulcal cortex: a ‘new’ inhibitory form of multisensory convergence. Cereb Cortex. 2004;14:387–403. doi: 10.1093/cercor/bhg135. [DOI] [PubMed] [Google Scholar]
- Falchier A, Clavagnier S, Barone P, Kennedy H. Anatomical evidence of multimodal integration in primate striate cortex. J Neurosci. 2002;22:5749–5759. doi: 10.1523/JNEUROSCI.22-13-05749.2002. [DOI] [PMC free article] [PubMed] [Google Scholar]
- Ghazanfar AA, Schroeder CE. Is neocortex essentially multisensory? Trends Cogn Sci. 2006;10:278–285. doi: 10.1016/j.tics.2006.04.008. [DOI] [PubMed] [Google Scholar]
- Grant S, Shipp S. Visuotopic organization of the lateral suprasylvian area and of an adjacent area of the ectosylvian gyrus of cat cortex: a physiological and connectional study. Vis Neurosci. 1991;6:315–338. doi: 10.1017/s0952523800006568. [DOI] [PubMed] [Google Scholar]
- Hardy SC, Stein BE. Small lateral suprasylvian cortex lesions produce visual neglect and decreased visual activity in the superior colliculus. J Comp Neurol. 1988;273:527–542. doi: 10.1002/cne.902730408. [DOI] [PubMed] [Google Scholar]
- He J, Hashikawa T. Connections of the dorsal zone of cat auditory cortex. J Comp Neurol. 1998;400:334–348. doi: 10.1002/(sici)1096-9861(19981026)400:3<334::aid-cne4>3.0.co;2-9. [DOI] [PubMed] [Google Scholar]
- He J, Hashikawa T, Ojima H, Kinouchi Y. Temporal integration and duration tuning in the dorsal zone of cat auditory cortex. J Neurosci. 1997;17:2615–2625. doi: 10.1523/JNEUROSCI.17-07-02615.1997. [DOI] [PMC free article] [PubMed] [Google Scholar]
- Heath CJ, Jones EG. The anatomical organization of the suprasylvian gyrus of the cat. Ergeb Anat Entwicklungsgesch. 1971;45:3–64. [PubMed] [Google Scholar]
- Keniston L, Henderson SC, Meredith MA. Confocal identification of multisensory convergence on cortical neurons in cat. Soc Neurosci Abstr. 2006;36:137.18. [Google Scholar]
- Las L, Shapira AH, Nelken I. Functional gradients of auditory sensitivity along the anterior ectosylvian sulcus of the cat. J Neurosci. 2008;28:3657–3667. doi: 10.1523/JNEUROSCI.4539-07.2008. [DOI] [PMC free article] [PubMed] [Google Scholar]
- Malhotra S, Lomber SG. Sound localization during homotopic and heterotopic bilateral cooling deactivation of primary and non-primary auditory cortical areas in the cat. J Neurophysiol. 2007;97:26–43. doi: 10.1152/jn.00720.2006. [DOI] [PubMed] [Google Scholar]
- Malhotra S, Hall AJ, Lomber SG. Cortical control of sound localization in the cat: unilateral cooling deactivation of 19 cerebral areas. J Neurophysiol. 2004;92:1625–1643. doi: 10.1152/jn.01205.2003. [DOI] [PubMed] [Google Scholar]
- Meredith MA, Keniston LR, Dehner LR, Clemo HR. Crossmodal projections from somatosensory area SIV to the auditory field of the anterior ectosylvian sulcus (FAES) in cat: further evidence for subthreshold forms of multisensory processing. Exp Brain Res. 2006;172:472–484. doi: 10.1007/s00221-006-0356-3. [DOI] [PubMed] [Google Scholar]
- Middlebrooks JC, Dykes RW, Merzenich MM. Binaural response-specific bands in primary auditory cortex (AI) of the cat: topographical organization orthogonal to isofrequency contours. Brain Res. 1980;181:31–48. doi: 10.1016/0006-8993(80)91257-3. [DOI] [PubMed] [Google Scholar]
- Middlebrooks JC, Clock AE, Xu L, Green DM. A panoramic code for sound location by cortical neurons. Science. 1994;264:842–844. doi: 10.1126/science.8171339. [DOI] [PubMed] [Google Scholar]
- Norita M, Kase M, Hoshino K, Meguro R, Funaki S, Hirano S, McHaffie JG. Extrinsic and intrinsic connections of the cat's lateral suprasylvian visual area. Prog Brain Res. 1996;112:231–250. doi: 10.1016/s0079-6123(08)63333-6. [DOI] [PubMed] [Google Scholar]
- Palmer LA, Rosenquist AC, Tusa RJ. Retinotopic organization of lateral suprasylvian visual areas in cat. J Comp Neurol. 1978;177:237–256. doi: 10.1002/cne.901770205. [DOI] [PubMed] [Google Scholar]
- Raczkowski D, Rosenquist AC. Connections of the multiple visual cortical areas with the lateral posterior-pulvinar complex and adjacent thalamic nuclei in the cat. J Neurosci. 1983;10:1912–1942. doi: 10.1523/JNEUROSCI.03-10-01912.1983. [DOI] [PMC free article] [PubMed] [Google Scholar]
- Rauschecker JP, von Grunau MW, Poulin C. Centrifugal organization of direction preferences in the cat's lateral suprasylvian visual cortex and its relation to flow field processing. J Neurosci. 1987;7:943–958. doi: 10.1523/JNEUROSCI.07-04-00943.1987. [DOI] [PMC free article] [PubMed] [Google Scholar]
- Reale RA, Imig TJ. Tonotopic organization in auditory cortex of the cat. J Comp Neurol. 1980;192:265–291. doi: 10.1002/cne.901920207. [DOI] [PubMed] [Google Scholar]
- Robitaille N, Lepore F, Bacon BA, Ellemberg D, Guillemot JP. Receptive field properties and sensitivity to edges defined by motion in the postero-lateral lateral suprasylvian (PLLS) area of the cat. Brain Res. 2008;1187:82–94. doi: 10.1016/j.brainres.2007.10.031. [DOI] [PubMed] [Google Scholar]
- Rockland KS, Ojima H. Multisensory convergence in calcarine visual areas in macaque monkey. Int J Psychophysiol. 2003;50:19–26. doi: 10.1016/s0167-8760(03)00121-1. [DOI] [PubMed] [Google Scholar]
- Rouiller EM, Simm GM, Villa AE, de Ribaupierre Y, de Ribaupierre F. Auditory corticocortical interconnections in the cat: evidence for parallel and hierarchical arrangement of the auditory cortical areas. Exp Brain Res. 1991;86:483–505. doi: 10.1007/BF00230523. [DOI] [PubMed] [Google Scholar]
- Schreiner CE, Cynader MS. Basic functional organization of second auditory cortical field (AII) of the cat. J Neurophysiol. 1984;51:1284–1305. doi: 10.1152/jn.1984.51.6.1284. [DOI] [PubMed] [Google Scholar]
- Sherk H. Location and connections of visual cortical areas in the cat's suprasylvian sulcus. J Comp Neurol. 1986;247:1–31. doi: 10.1002/cne.902470102. [DOI] [PubMed] [Google Scholar]
- Shore SE, Vass Z, Wys NL, Altschuler RA. Trigeminal ganglion innervates the auditory brainstem. J Comp Neurol. 2000;419:271–285. doi: 10.1002/(sici)1096-9861(20000410)419:3<271::aid-cne1>3.0.co;2-m. [DOI] [PubMed] [Google Scholar]
- Spear PD, Miller S, Ohman L. Effects of lateral suprasylvian visual cortex lesions on visual localization, discrimination, and attention in cats. Behav Brain Res. 1983;10:339–359. doi: 10.1016/0166-4328(83)90039-6. [DOI] [PubMed] [Google Scholar]
- Stecker GC, Harrington IA, Macpherson EA, Middlebrooks JC. Spatial sensitivity in the dorsal zone (area DZ) of cat auditory cortex. J Neurophysiol. 2005;94:1267–1280. doi: 10.1152/jn.00104.2005. [DOI] [PubMed] [Google Scholar]
- Symonds LL, Rosenquist AC. Corticocortical connections among the visual areas in the cat. J Comp Neurol. 1984;229:1–38. doi: 10.1002/cne.902290103. [DOI] [PubMed] [Google Scholar]
- van der Gucht E, Vandesande F, Arckens L. Neurofilament protein: a selective marker for the architectonic parcellation of the visual cortex in adult cat brain. J Comp Neurol. 2001;441:345–368. doi: 10.1002/cne.1416. [DOI] [PubMed] [Google Scholar]
- Veenman CL, Reiner A, Honig MG. Biotinylated dextran amine as an anterograde tracer for single- and double-labeling studies. J Neurosci Methods. 1992;41:239–254. doi: 10.1016/0165-0270(92)90089-v. [DOI] [PubMed] [Google Scholar]
- Yaka R, Notkin N, Yinon U, Wollberg Z. Visual, auditory and bimodal activity in the banks of the lateral suprasylvian sulcus in the cat. Neurosci Behav Physiol. 2002;32:103–108. doi: 10.1023/a:1012912828595. [DOI] [PubMed] [Google Scholar]