

Abstract
Posttraumatic growth (PTG; positive change resulting from the struggle with trauma) was examined among children impacted by Hurricane Katrina. The revised Posttraumatic Growth Inventory for Children (PTGI-C-R) assessed PTG at two time points, 12 (T1) and 22 months (T2) posthurricane. The PTGI-C-R demonstrated good reliability. Analyses focused on trauma-related variables in predicting PTG. Child-reported subjective responses to the hurricane and posttraumatic stress symptoms (PTSS) correlated with PTG at T1; however, in the regression, only PTSS significantly explained variance in PTG. At follow-up, T1 PTG was the only significant predictor of PTG. Findings suggest that the PTGI-C-R may assist efforts to understand children’s responses posttrauma.
Although posttraumatic growth (PTG), positive change resulting from one’s struggle with trauma, has garnered considerable interest in the adult literature (Calhoun & Tedeschi, 2006), the construct has received less attention among nonadults (Kilmer, 2006). As such, there is no clear standard for measurement in children and youth. Nevertheless, PTG has been reported in youth exposed to diverse traumas, including disasters (Cryder, Kilmer, Tedeschi, & Calhoun, 2006). In this article, we describe the revised Posttraumatic Growth Inventory for Children (PTGI-C-R) and correlates of PTG. This adaptation of the PTGI-C (Cryder et al., 2006) shortened the scale and simplified the response metric and item wording to facilitate efficient assessment of PTG in clinical and research settings.
This study grows out of a project assessing children and caregivers post-Hurricane Katrina. Describing the sample’s experiences, Gil-Rivas, Kilmer, Hypes, and Roof (in press) noted that 86.8% endorsed experiencing at least one hurricane-related trauma, and 63.2% of children reported that Katrina was one of the “most scary” events they had experienced. Overall, children and families reported substantial adversity and, one-year post-Katrina, 21% of children obtained scores suggesting probable posttraumatic stress disorder (PTSD); nearly all reported experiencing at least one posttraumatic stress symptom much or most of the time during the previous month.
We expected that (a) the PTGI-C-R would demonstrate good reliability at baseline (T1) and follow-up (T2), and that a meaningful proportion of children would evidence growth; (b) at T1, indicators of subjective response to the hurricane and ongoing distress i.e. posttraumatic stress symptoms (PTSS) would relate positively to PTG, over and above objective exposure; and (c) given the hypothesized role of distress in catalyzing the process that yields (and perhaps maintains) growth, T1 levels of PTSS and PTG would predict T2 PTG.
METHOD
Participants
Face-to-face interviews were conducted with children (aged 7–10 years) and their primary caregivers in the Baton Rouge and New Orleans, LA metropolitan areas and the Mississippi Gulf Coast. Baseline interviews were conducted roughly one year posthurricane (M = 12.4 months, SD = 3.4); follow-ups were approximately 2 years posthurricane (M = 22.4 months, SD = 3.3). Participants were recruited via flyers and participant referral. Trained assistants conducted interviews at participants’ homes or locations convenient to caregivers. Participants were compensated. The study was approved by the University of North Carolina at Charlotte and the Louisiana State University Institutional Review Boards.
At T1, participants included 68 children; of these, 53 (78%) completed T2 interviews. At T1, children, on average, were 8.3 years old (SD = 1.1), and 54.4% were girls. Seventy-eight percent were African American, 14.7% were White, and 7.3% reflected other backgrounds. Two thirds (67.6%) of caregivers reported they were unemployed, and 57.4% reported annual household incomes less than $10,000. Nearly three quarters (73.5%) of care-givers reported that their child had experienced at least one potential trauma prior to Katrina (M = 1.9, SD = 1.8), most frequently community violence (39.7%), violent death of a loved one (33.3%), domestic violence (23.5%), or painful medical treatment (23.5%). Nearly all study children (97.1%) were directly exposed to the hurricane. As a result of Katrina, 95.6% of families had to evacuate and 89.7% lost their homes. In the year postdisaster, families moved an average of 3.1 times (SD = 2.1; range 0–11). At T1, 38.2% of participants were living in FEMA trailers, 16.2% in their own homes/apartments, 36.8% in rental properties, 5.9% with relatives, and 3.0% other arrangements.
Development of the PTGI-C-R
In revising the 21-item PTGI-C (Cryder et al., 2006), researchers selected items reflecting key domains of growth; preference was given to items presumed to be more accessible to young children. A new metric was identified, asking about degree of change rather than how true the statement was, and a new introduction was integrated, providing additional explanation and including two open-ended items inquiring about changes. These items were intended to verify children’s ability to grasp the temporal element of the questions and perceive change and facilitate their ability to respond. Also, each item’s wording was modified—some changes involved a simple adaptation for consistency and clarity given the new metric, other revisions aimed to simplify language. Then, a specialist in early child development (who had worked with children in the impacted areas) made modifications to facilitate comprehension for younger children. The scale was piloted with three youngsters who had experienced other major stressors and three children who were affected directly by Katrina; this step informed minor edits.
Measures
At T1, caregivers provided demographic information. Children completed the following instruments.
Posttraumatic growth
The Posttraumatic Growth Inventory for Children-Revised (PTGI-C-R) was administered at T1 and T2 (see Appendix). The PTGI-C-R includes two open-ended items and 10 items assessing five PTG domains (new possibilities, relating to others, personal strength, appreciation of life, and spiritual change) on a 4-point scale.
Hurricane-related exposure
Children completed Part I of the UCLA-Posttraumatic Stress Reaction Index Revision 1 (UCLA-PTSD RI-1; Pynoos, Rodriguez, Steinberg, Stuber, & Frederick, 1998) at T1. Objective exposure and subjective response scores were computed, totaling items endorsed.
Child posttraumatic stress symptoms
The UCLA-PTSD RI-1 (Steinberg, Brymer, Decker, & Pynoos, 2004) assessed PTSS related to Hurricane Katrina at T1 and T2, using a 5-point scale; α = .88.
RESULTS
Table 1 summarizes descriptive statistics. At T1, Cronbach’s alpha for the new measure was .77 and would not be improved by deleting any items. Youngsters’ PTG scores ranged from 1 to 30, and 50.0% of participants had total scores of 20 or higher, suggesting an average response of some perceived change; 10.6% had total scores of 10 or lower, suggesting average responses of a little change or less. Scores for boys (M = 20.2, SD = 5.8) and girls (M = 19.9, SD = 7.2) did not differ, and age did not correlate with PTG (r = −.10). Table 2 shows item-level data for both time points. At T2, Cronbach’s alpha was .81; the stability coefficient over the 10-month interval from T1 to T2 was .44. Paired sample t test demonstrated that children’s T2 scores did not differ from their T1 scores, t(50) = 1. As at T1, there was considerable variability in child-reported PTG (obtained range: 3–30); 51% of children had total scores of 20 or higher; PTG scores for boys (M = 18.9, SD = 7.2) and girls (M = 19.4, SD = 7.5) did not differ; and age did not relate to PTG (r = .09).
Table 1.
Descriptive Statistics for Key Variablesa
| M | SD | Scale range | |
|---|---|---|---|
| Posttraumatic growth | 0–30 | ||
| Time 1 | 20.0 | 6.5 | |
| Time 2 | 19.2 | 7.3 | |
| Hurricane exposure: Objective exposure | 3.1 | 1.9 | 0–7 |
| Hurricane exposure: Subjective response | 2.5 | 1.5 | 0–5 |
| Posttraumatic stress symptoms | 0–68 | ||
| Time 1 | 27.8 | 16.0 | |
| Time 2 | 23.8 | 12.5 |
Time 1: n = 66–68; Time 2: n = 53.
Table 2.
Posttraumatic Growth Inventory for Children Revised Item-Level Descriptive Statistics at Both Time Pointsa
| Time 1 |
Time 2 |
||||
|---|---|---|---|---|---|
| Itemb | M | SD | M | SD | Domain of PTG |
| 1. I learned how nice/helpful people can be. | 1.79 | 1.23 | 1.54 | 1.29 | Relating to others |
| 2. I can handle big problems better. | 1.89 | 1.15 | 1.77 | 1.30 | Personal strength |
| 3. I know what is important to me. | 1.95 | 1.06 | 1.98 | 1.12 | Appreciation of life |
| 4. I understand how God works better. | 2.23 | 1.17 | 2.25 | 1.11 | Spiritual change |
| 5. I feel closer to people. | 1.94 | 1.18 | 1.70 | 1.30 | Relating to others |
| 6. I appreciate/enjoy each day more. | 2.06 | 1.12 | 1.89 | 1.25 | Appreciation of life |
| 7. I have a chance to do things I couldn’t. | 1.79 | 1.14 | 2.02 | 1.14 | New possibilities |
| 8. My faith/belief in God is stronger. | 2.29 | 1.13 | 2.00 | 1.29 | Spiritual change |
| 9. I can deal with more. | 1.91 | 1.15 | 1.94 | 1.13 | Personal strength |
| 10. I have new ideas how I want things to be. | 2.15 | 1.13 | 2.13 | 1.19 | New possibilities |
Note. PTG = Posttraumatic growth.
Time 1: n = 66; Time 2: n = 52–53.
Items shortened for table.
Independent raters coded open-ended items (i.e., no change, change but not growth, and growth; interrater agreement: Time 1 Kendall’s tau-b = .84; Time 2 Kendall’s tau-b = .87). At T1, only 1 child of 65 (1.5%) spontaneously articulated change reflecting growth, and 58 youngsters (89.2%) reported a change in themselves or their situations as a result of Katrina. At T2, 8 of 52 children (15.4%) spontaneously described positive changes or growth (e.g., “Sometimes I act nice to people when I think of times when I was sad and I don’t want them to feel that way;” “More confident”), and 49 youngsters’ (94.2%) replies conveyed their understanding of the questions’ temporal component.
Table 3 summarizes associations between variables. As expected, children’s T1 PTG scores were not significantly associated with objective exposure, but related to their self-reported subjective response and their ongoing distress, as reflected by PTSS. On the other hand, higher levels of both objective exposure and subjective response were significantly associated with higher levels of PTSS. Hierarchical regression analyses examined correlates of T1 PTG (Table 4). Children’s subjective response related to PTG over and above objective exposure. However, in the final model, only PTSS related significantly to PTG. These findings support the prediction that subjective response and ongoing distress would relate positively to PTG. Similar regressions examined predictors of T2 PTG. Although T1 PTSS were associated with T2 PTG, only T1 PTG predicted T2 PTG in the final model, after accounting for T1 PTSS (β= .37, p < .05; adjusted R2 = .17, p < .05). Thus, the hypothesis that both variables would predict T2 PTG was not supported.
Table 3.
Correlations Among Key Variablesa
| 1 | 2 | 3 | 4 | 5 | 6 | |
|---|---|---|---|---|---|---|
| 1. Posttraumatic growth: Time 1 | – | |||||
| 2. Posttraumatic growth: Time 2 | .44** | – | ||||
| 3. Hurricane exposure: Objective exposure | .11 | .16 | – | |||
| 4. Hurricane exposure: Subjective response | .33** | .18 | .51*** | – | ||
| 5. Posttraumatic stress symptoms: Time 1 | .45*** | .36** | .60*** | .60*** | – | |
| 6. Posttraumatic stress symptoms: Time 2 | .27 | .32* | .38** | .27 | .49*** | – |
Time 1: n = 66–68; Time 2: n = 51–53.
p < .05.
p < .01.
p < .001.
Table 4.
Summary of Hierarchical Regression Analysis for Trauma-Related Variables Predicting Baseline Posttraumatic Growth
| Step 1 |
Step 2 |
|||||
|---|---|---|---|---|---|---|
| B | SE B | β | B | SE B | β | |
| Hurricane exposure: Objective exposure | −0.22 | 0.48 | −.06 | −0.91 | 0.49 | −.26 |
| Hurricane exposure: Subjective response | 1.54 | 0.58 | .36* | 0.72 | 0.59 | .17 |
| Time 1 PTSS | – | – | 0.21 | 0.06 | .50** | |
| Adjusted R2 | .08* | .21*** | ||||
Note. PTSS = Posttraumatic stress symptoms.
p < .05.
p < .01.
p < .001.
DISCUSSION
This study sought to demonstrate the utility of a revised measure of PTG in children and examine correlates of PTG. The measure’s items appeared “active,” with children endorsing each, and their open-ended responses were illuminating. Though few children articulated PTG-like positive change spontaneously (not an unexpected occurrence in this age group), most demonstrated the capacity to reflect and assess themselves and their situations to make the temporal comparison necessary to appreciate PTG. Consistent with hypotheses, a sizable proportion of children reported PTG at T1 and T2.
Notably, spirituality items were among those on which children reported the most absolute growth. This may reflect children’s contexts, a region widely regarded as high in religiosity. Their responses may also have been influenced by adults encouraging faith-based coping or framing faith-based explanations for their experience. This result points to a need to explore the importance of culture and context in PTG and the role of caregivers in the process.
At each time point, the revised scale’s alpha was adequate to good, and the pattern of results accords well with PTG models (Calhoun & Tedeschi, 2006), which emphasize that distress and one’s ongoing struggle with a new reality seemingly catalyze the process. Consistent with that notion, indicators of subjective response and, in particular, ongoing distress (PTSS), constituted prime correlates of PTG. At T1, the PTSS score was the lone significant predictor. Similarly, Salter and Stallard (2004) concluded that growth and distress (PTSD) may coexist, and Alisic, van der Schoot, van Ginkel, and Kleber (2008) reported a significant correlation between PTG ratings and PTSS.
The stability coefficient was .44 between T1 and T2 PTG scores. This value is not unexpected in that the construct is thought to reflect a dynamic process of growth and change, not a stable personality trait. Rather, the value provides some indication of how stable an individual’s score may be over a substantial period (10 months), particularly with young children. Indeed, analysis did not detect a difference in respondents’ T1 and T2 scores, and T1 PTG was the strongest predictor of T2 PTG.
The study’s generalizability is limited by its small, volunteer sample. Furthermore, T1 was one year postdisaster, necessitating retrospective reporting about the trauma and restricting the degree to which clear temporal inferences are possible. While the study would be strengthened by a non-traumatized control group to distinguish the change measured from maturation, two studies, using the PTGI-C-R, suggest that positive changes associated with trauma are distinct from normative maturation and growth (Alisic et al., 2008; Taku, Calhoun, Kilmer, & Tedeschi, 2008).
The PTGI-C-R provides a brief means of assessing PTG in children; its simplified format, content, and language address the developmental challenges inherent in such work (Kilmer, 2006). Overall, findings attest to the PTGI-C-R’s construct validity and suggest it is a reliable, parsimonious scale that may have utility in efforts to understand reactions and responses posttrauma.
Acknowledgments
Preparation of this paper was supported by National Institute of Mental Health Award R03 MH078197-01 (Gil-Rivas and Kilmer).
APPENDIX
Posttraumatic Growth Inventory for Children–Revised (PTGI-C-R)
Ok, now we’re going to move on to another one… Some things change over time, some things don’t. For example, some things in your life are different now than they were before Hurricane Katrina and what happened afterward, and some things are not.
I want to hear from you – what has changed since Katrina?
____________________
____________________
____________________
Some kids like you tell us that they have noticed ways in which they are different now in how they are and what they feel and think, compared to how they were before the hurricane and what happened afterward. How about you? How have you changed?
____________________
____________________
____________________
____________________
Let’s talk about some more specific questions about changes…
As we have been talking about, some kids like you tell us that they have noticed ways in which they are different now, compared to how they were before Hurricane Katrina and what happened afterward. Everybody’s different, so some kids don’t notice any change, some kids notice a lot, and some kids are in between. There are no right or wrong answers, and there’s no right or wrong way to be.
I want you to think about how you used to be before Hurricane Katrina and how you are now. I am going to ask you some questions about some different changes that might have happened from before the hurricane to now. Tell me how much you have changed. It is ok to say that these changes didn’t happen, and it is ok to say that they did. Tell me what answer is better. [SHOW THE RESPONSE CARD TO THE CHILD.]
To get the hang of it, let’s first try some for practice.
The first one is: I am a boy/girl.
Which one would you answer there? Has that changed since before the hurricane? Yes or No. No change? A little? Some? Lots? Right –whether you’re a boy or a girl hasn’t changed since then so, right, you would answer “No change”
Next one: I am bigger than I used to be.
So, has that changed? Yes or No? If it has changed, how much has that changed since the hurricane? Think back to how tall you were before the hurricane… are you taller now than you were then?
What would you say? Answer ‘no change’ if you are just as tall as you were then, ‘a little’ if you’re a little taller than you were then, ‘some’ if you’ve grown more than a little, or ‘a lot’ if you are a lot taller than you were before the hurricane.
Any questions about how this works? Ok, now let’s go on to our other questions. These aren’t for practice anymore.
For each of these, I want you to let me know how much you have changed since the hurricane.
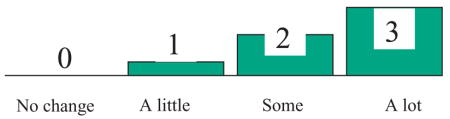
No change, a little, some, or a lot [WITH ACCOMPANYING HAND GESTURES DEMONSTRATING DIFFERENCES… Note that Don’t Know is not offered as a response, but is coded if child responds as such.]
| No Change | A Little | Some | A Lot | DK | |
| 1. I learned how nice and helpful some people can be. | 0 | 1 | 2 | 3 | −8 |
| 2. I can now handle big problems better than I used to. | 0 | 1 | 2 | 3 | −8 |
| 3. I know what is important to me better than I used to. | 0 | 1 | 2 | 3 | −8 |
| 4. I understand how God works better than I used to. | 0 | 1 | 2 | 3 | −8 |
| 5. I feel closer to other people (friends or family) than I used to. | 0 | 1 | 2 | 3 | −8 |
| 6. I appreciate (enjoy) each day more than I used to. | 0 | 1 | 2 | 3 | −8 |
| 7. I now have a chance to do some things I couldn’t do before. | 0 | 1 | 2 | 3 | −8 |
| 8. My faith (belief) in God is stronger than it was before. | 0 | 1 | 2 | 3 | −8 |
| 9. I have learned that I can deal with more things than I thought I could before. | 0 | 1 | 2 | 3 | −8 |
| 10. I have new ideas about how I want things to be when I grow up. | 0 | 1 | 2 | 3 | −8 |
Contributor Information
Ryan P. Kilmer, Department of Psychology, University of North Carolina at Charlotte, Charlotte, NC
Virginia Gil-Rivas, Department of Psychology, University of North Carolina at Charlotte, Charlotte, NC.
Richard G. Tedeschi, Department of Psychology, University of North Carolina at Charlotte, Charlotte, NC
Arnie Cann, Department of Psychology, University of North Carolina at Charlotte, Charlotte, NC.
Lawrence G. Calhoun, Department of Psychology, University of North Carolina at Charlotte, Charlotte, NC
Teresa Buchanan, Department of Educational Theory, Policy, and Practice, Louisiana State University, Baton Rouge, LA.
Kanako Taku, Department of Psychology, Oakland University, Rochester, MI.
References
- Alisic E, van der Schoot TAW, van Ginkel JR, Kleber RJ. Looking beyond posttraumatic stress disorder in children: Posttraumatic stress reactions, posttraumatic growth, and quality of life in a general population sample. Journal of Clinical Psychiatry. 2008;29:1455–1461. doi: 10.4088/jcp.v69n0913. [DOI] [PubMed] [Google Scholar]
- Calhoun LG, Tedeschi RG. The foundations of posttraumatic growth: An expanded framework. In: Calhoun LG, Tedeschi RG, editors. Handbook of posttraumatic growth: Research and practice. Mahwah, NJ: Erlbaum; 2006. pp. 1–23. [Google Scholar]
- Cryder CH, Kilmer RP, Tedeschi RG, Calhoun LG. An exploratory study of posttraumatic growth in children following a natural disaster. American Journal of Orthopsychiatry. 2006;76:65–69. doi: 10.1037/0002-9432.76.1.65. [DOI] [PubMed] [Google Scholar]
- Gil-Rivas V, Kilmer RP, Hypes AW, Roof KA. The caregiver-child relationship and children’s adjustment post-Hurricane Katrina. In: Kilmer RP, Gil-Rivas V, Tedeschi RG, Calhoun LG, editors. Helping families and communities recover from disaster: Lessons learned from Hurricane Katrina and its aftermath. Washington, DC: American Psychological Association; (in press) [Google Scholar]
- Kilmer RP. Resilience and posttraumatic growth in children. In: Calhoun LG, Tedeschi RG, editors. Handbook of posttraumatic growth: Research and practice. Mahwah, NJ: Erlbaum; 2006. pp. 264–288. [Google Scholar]
- Pynoos R, Rodriguez N, Steinberg A, Stuber M, Frederick C. The University of California at Los Angeles Posttraumatic Stress Disorder Reaction Index (UCLA-PTSD RI) for DSM-IV (Revision 1) Los Angeles, CA: UCLA Trauma Psychiatry Program; 1998. [Google Scholar]
- Salter E, Stallard P. Posttraumatic growth in child survivors of a road traffic accident. Journal of Traumatic Stress. 2004;17:335–340. doi: 10.1023/B:JOTS.0000038482.53911.01. [DOI] [PubMed] [Google Scholar]
- Steinberg AM, Brymer MJ, Decker KB, Pynoos RS. The University of California at Los Angeles Post-Traumatic Stress Disorder Reaction Index. Current Psychiatry Reports. 2004;6:96–100. doi: 10.1007/s11920-004-0048-2. [DOI] [PubMed] [Google Scholar]
- Taku K, Calhoun LG, Kilmer RP, Tedeschi RG. Posttraumatic growth and non-traumatic growth in Japanese youth. Paper presented at the 54th annual meeting of the Southeastern Psychological Association; Charlotte, NC. 2008. Mar, [Google Scholar]