Abstract
Objective:
Predictable patterns of atrophy are associated with the clinical subtypes of frontotemporal dementia (FTD): behavioral variant (bvFTD), semantic dementia (SEMD), and progressive nonfluent aphasia (PNFA). Some studies of pathologic subtypes have also suggested specific atrophy patterns; however, results are inconsistent. Our aim was to test the hypothesis that clinical, but not pathologic, classification (FTD with ubiquitin inclusions [FTD-U] and FTD with tau inclusions [FTD-T]) is associated with predictable patterns of regional atrophy.
Methods:
Magnetic resonance scans of nine FTD-U and six FTD-T patients (histologically confirmed) were compared with 25 controls using voxel-based morphometry (VBM). Analyses were conducted with the patient group classified according to histologic or clinical variant. Additionally, three Alzheimer pathology patients who had the syndrome of SEMD in life (FTD-A) were analyzed.
Results:
The VBM studies in clinical variants confirmed established patterns of atrophy (SEMD, rostral temporal; bvFTD, mesial frontal; PNFA, left insula). FTD-U and FTD-T VBM results were very similar, showing severe atrophy in the temporal poles, mesial frontal lobe, and insulae. A conjunction analysis confirmed this similarity. Subgroup analysis found that SEMD associated with either FTD-T or FTD-U was associated with similar rostral temporal atrophy; however, FTD-A had a qualitatively different pattern of left hippocampal atrophy.
Conclusions:
While there is predictable atrophy for clinical variants of frontotemporal dementia (FTD), histologic FTD variants show no noticeable differences. Reports of specific atrophy profiles are likely the result of idiosyncrasies in small groups. Semantic dementia associated with Alzheimer pathology, however, presented a distinct atrophy pattern.
GLOSSARY
- AD
= Alzheimer disease;
- bvFTD
= behavioral variant frontotemporal dementia;
- FTD
= frontotemporal dementia;
- FTD-A
= Alzheimer pathology with semantic dementia;
- FTD-T
= frontotemporal dementia with tau inclusions;
- FTD-U
= frontotemporal dementia with ubiquitin inclusions;
- FTLD
= frontotemporal lobar degeneration;
- MMSE
= Mini-Mental State Examination;
- PNFA
= progressive nonfluent aphasia;
- SEMD
= semantic dementia;
- VBM
= voxel-based morphometry.
Frontotemporal lobar degeneration (FTLD) is unique among the dementias in that it is heterogeneous in terms of both clinical syndrome and underlying histopathologic signature. Clinically, patients may present with semantic dementia (SEMD), progressive nonfluent aphasia (PNFA), or personality change with neuropsychiatric symptoms referred to as behavioral-variant frontotemporal dementia (bvFTD, or simply FTD). As the name implies, FTLD macroscopically involves degeneration of the frontal and temporal lobes but the histopathology may include cases with tau-positive inclusions (FTD-T), ubiquitin-positive inclusions (FTD-U), or neither (dementia lacking distinctive histology). Identification of biomarkers for these histologic groupings would be desirable for stratification in disease-modifying therapy trials.
Whereas a number of neuroimaging studies1–3 have identified the cerebral associations of the three clinical syndromes, the patterns of cerebral atrophy for the histologic subtypes are more elusive, with studies reporting inconsistent findings.4–7 The goal of this study was to address this issue by contrasting histologic and clinical subtype atrophy profiles, and then analyzing the differences and commonalities between each cohort. Finally, clinically diagnosed FTLD can sometimes represent a false-positive in that Alzheimer pathology rather than FTLD-associated histology is found at postmortem.8–11 Three patients in this category were available (hereafter designated as FTD-A) to examine 1) whether atrophy would be qualitatively different from FTD-U and FTD-T and 2) whether the pattern of atrophy would differ from that seen in typical clinical Alzheimer disease (AD) as this could inform understanding of how Alzheimer pathology can produce clinical FTLD look-alikes.
METHODS
Patients.
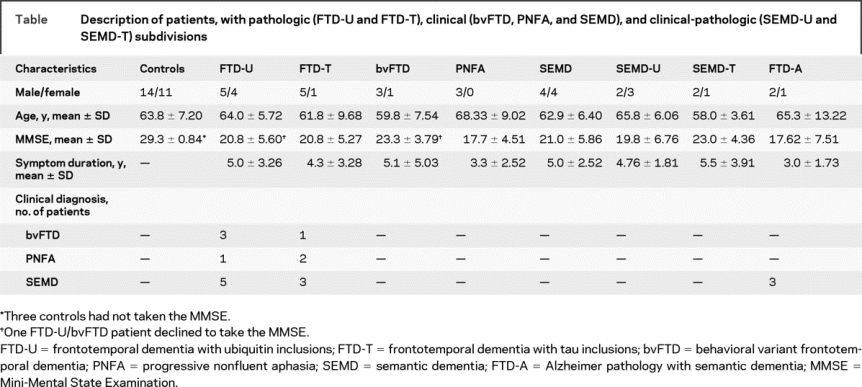
Eighteen patients (9 FTD-U, 6 FTD-T, 3 FTD-A) and 25 age- and sex-matched healthy controls participated. Patient inclusion criteria were clinical diagnosis of an FTLD syndrome, an appropriate magnetic resonance scan in life, and postmortem confirmation of histopathologic subtype. All patients were clinically diagnosed according to the current consensus criteria12 as having bvFTD, SEMD, or PNFA. Clinical syndromic diagnosis was based on the clinical profile of the patients alone (imaging findings were not considered). The FTD-A group comprised three patients with the clinical syndrome of SEMD, one of whom was reported in previous pathologic studies8,13; a second patient in this group had the neuropsychological syndrome of SEMD; however, it is worth highlighting that her advanced age (80 years when scanned) and the presence of delusional beliefs had led to an antemortem suspicion that she may have had atypical AD pathology. Additional clinical details are provided in the supplementary material on the Neurology® Web site at www.neurology.org. The breakdown of clinical syndromes in each pathologic category, together with symptom duration, Mini-Mental State Examination (MMSE) score,14 and general demographics, at the time of the magnetic resonance scan is summarized in the table. Informed consent was obtained from patients. The study was approved by the Local Regional Ethics Committee.
Table Description of patients, with pathologic (FTD-U and FTD-T), clinical (bvFTD, PNFA, and SEMD), and clinical-pathologic (SEMD-U and SEMD-T) subdivisions
Histologic examination and classification.
Either whole brain or left hemisphere was fixed in formalin within 48 hours of death. The pathology protocols followed have been described in detail previously.8,15 Alzheimer pathology in the three FTD-A cases was Braak stage ≥V. The patients in the FTD-T category comprised three with Pick pathology (one PNFA, two SEMD) and three with a Pick body–negative tauopathy with ballooned achromatic neurons suggestive of corticobasal pathology (one bvFTD, one PNFA, and one SEMD). Seven out of nine FTD-U patients were TAR DNA binding protein (TDP43) positive.
Imaging.
For imaging details, see table e-1. Scans were obtained using a 1.5 T GE MRI scanner (GE Medical Systems, Milwaukee, WI). A T1-weighted three-dimensional inversion-recovery fast spoiled gradient echo sequence with echo time of 4.2 msec, inversion time of 650 msec, and flip angle of 20° was used for acquisition. Scans were acquired coronally and had voxel dimensions of 0.86 × 0.86 × 1.5 mm3 or 0.86 × 0.86 × 1.8 mm3. Validation of the method for combining scans of different slice thickness was undertaken previously16 and is described in appendix e-1.
Statistical analysis.
All scans were optimally preprocessed as explained in appendix e-1. Data were analyzed in SPM5 to test for differences in gray matter volume. Contrasting cohorts were considered in a two-population group comparison to provide an overall indicator of atrophic regions in the diseased groups. The conjunction analysis was performed using the conjunction null hypothesis without further contrast masking.17 Total intracranial volume (details in appendix e-1) for each subject was entered as a confounding covariate. Due to the low gray matter volumes in the temporal lobe region in many of the patients, the voxel threshold for inclusion in the analysis was lowered to the heuristic value of 20% of the mean voxel value over the brain. An explicit mask was added in order to limit the interference of partial volume effects with CSF. This mask was created in SPM by averaging together the unmodulated segments of gray matter, white matter, and CSF of all 25 controls and thresholding the result at 50%.
Analyses were performed in both histopathologic and clinical subtypes: FTD-U and FTD-T were each contrasted separately to controls and a conjunction analysis was performed to examine areas of common abnormality. The patients were then recategorized according to clinical syndrome (bvFTD, SEMD, and PNFA) and each was contrasted to controls. As there were sufficient numbers with SEMD, analyses of this group divided into FTD-U and FTD-T were undertaken to control for the confound of clinical syndrome. Finally, the three FTD-A patients were contrasted with controls. As the FTD-A patients all had a diagnosis of SEMD in life, these results could also be compared to the true SEMD group (i.e., clinical SEMD with an FTLD spectrum pathology). Conjunction analyses were also undertaken to explore areas of common atrophy between clinical subgroups (PNFA, SEMD, and bvFTD) and between true SEMD and FTD-A.
The statistical threshold for significance was set at a false discovery rate of p(corrected) = 0.05.18 A more stringent family-wise error threshold of p(corrected) = 0.05 was also used for controls vs FTD-U and controls vs SEMD. For all contrasts, the extent threshold (k) was set at 200 voxels, except in the conjunction analyses in which k = 0. Given that the number of patients available differed in each contrast, the statistical power varied across contrasts and the extent of the areas of significant atrophy was likely to be influenced by this varying power. Consequently, interpretation of results focused on the qualitative profile of the SPMs (i.e., region X worse than region Y worse than region Z).
Nonparametric statistical analyses were also performed in the PNFA and FTD-A cohorts given the limited number of subjects (appendix e-1).
RESULTS
FTD-U and FTD-T.
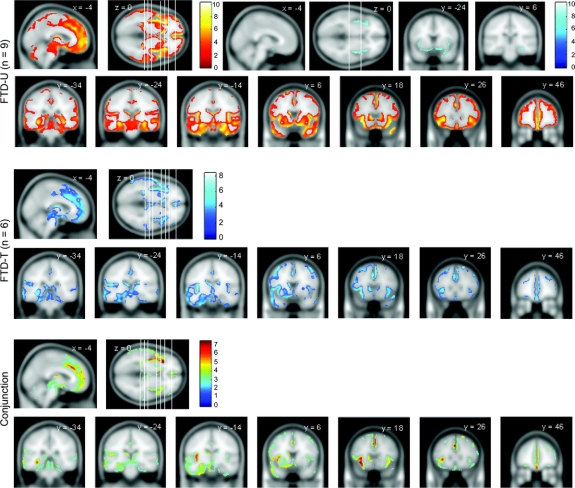
The VBM analyses are summarized in figure 1. A direct contrast between FTD-U and FTD-T yielded no significant results in either direction at p(uncorrected) = 0.001.
Figure 1 Regions of gray matter atrophy for FTD-U, FTD-T, and the conjunction of both (common regions)
The statistical threshold is false discovery rate = 0.05, except for the boxed images in FTD-U (family-wise error = 0.05). The coronal slices' location is shown in the axial slice (from left to right). FTD-T = frontotemporal dementia with tau inclusions; FTD-U = frontotemporal dementia with ubiquitin inclusions.
Contrasting either FTD-U or FTD-T groups with controls yielded similar results (figure 1), with clear involvement of the left insula (FTD-U, around the [−40, 12, −4] mm location, with t value 8.88 and z score 6.17; FTD-T [−36, 18, −8] mm, t value 7.11 and z score 5.99), right insula (FTD-U [42, −4, −4], t value 10.30 and z score 4.20; FTD-T [42, −2, −2], t value 5.02, z score 4.02), and mesial frontal lobes (FTD-U [2, 44, 2] mm, t value 8.08, z score 5.84; FTD-T [−2, 22, 38] mm, t value 7.49, z score 5.48, expanding also around [−2, 36, 22] mm, t value 6.00 and z score 5.24). The conjunction analysis confirmed the similarity of results in that everything that was abnormal in FTD-T was also abnormal in the conjunction analysis; i.e., all of the abnormalities in the FTD-T were subsumed within the more statistically powered FTD-U analysis. For this analysis, the principal significant locations included the left insula (around [−34, 22, 0] mm, t value 7.43, z score 6.22), the mesial frontal lobes ([−2, 26, 36] mm, t value 7.33, z score 6.15), and the left temporal lobe ([−54, 8, −26] mm, t value 5.34, z score 4.73). The left caudate nucleus was also observed to be significant in both groups ([−8, 14, 2] mm, t value 6.26, z score 5.48).
SEMD, bvFTD, and PNFA.
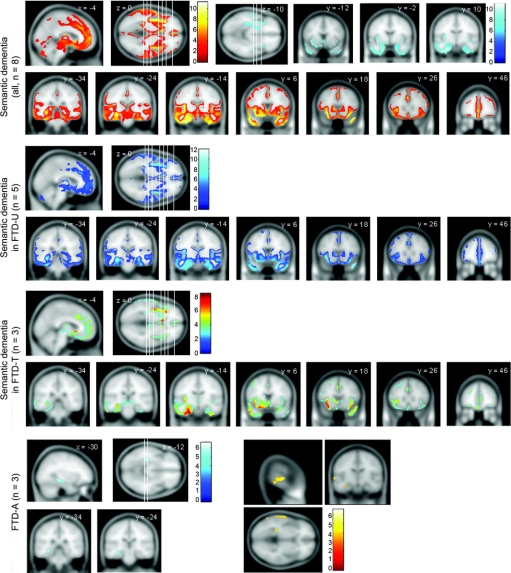
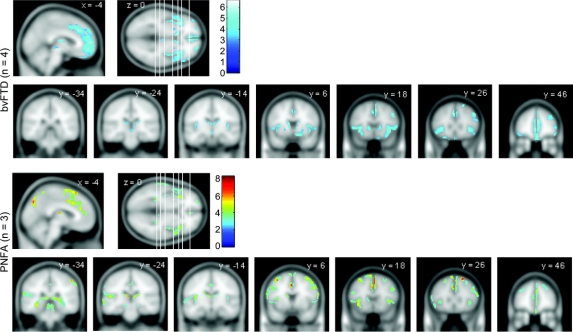
SEMD was associated with asymmetric (left worse than right) rostral temporal lobe atrophy (around [−26, −8, −30] mm, t value 11.18, z score 6.91, and around [−40, −10, −38] mm, t value 10.75, z score 6.77) with less significant involvement of the mesial frontal lobes and insulae (figure 2). In bvFTD, the most significant abnormality was mesial frontal atrophy ([4, 20, 46] mm, t value 6.65, z score 5.00, and [−2, 44, −2] mm, t value 6.26, z score 4.81), followed by insulae/frontal opercula (right worse than left) regions (figure 3). PNFA was associated with insula/frontal operculum atrophy (left worse than right, notably around locations [−38, 18, −8] mm, t value 5.18, z score 4.29, and [−40, 14, −6] mm, t value 5.01, z score 4.19) along with scattered small clusters across the dorsolateral prefrontal convexity, mesial frontal, and parietal regions (figure 3). Nonparametric statistical analysis of the PNFA group produced marked attenuation of abnormalities in these latter areas, leaving the left insula as the key remaining area of abnormality (figure e-1). All conjunction analyses detected the mesial frontal lobe as the most significant common atrophic area between each pair of clinical profiles of FTD (figure e-2).
Figure 2 Regions of gray matter atrophy for SEMD, SEMD with ubiquitin inclusions, SEMD with tau inclusions, and FTD-A
All patients had been diagnosed with SEMD in life. The statistical threshold is false discovery rate = 0.05, expect for the boxed images in SEMD (family-wise error = 0.05) and the bottom right panel for FTD-A where the threshold was lowered to p (uncorrected) = 0.001. The coronal slices' location is shown in the axial slice (from left to right). FTD-A = Alzheimer pathology with semantic dementia; FTD-T = frontotemporal dementia with tau inclusions; FTD-U = frontotemporal dementia with ubiquitin inclusions; SEMD = semantic dementia.
Figure 3 Regions of gray matter atrophy for bvFTD and PNFA groups
The coronal slices' location is shown in the axial slice (from left to right). False discovery rate = 0.05. bvFTD = behavioral variant frontotemporal dementia; PNFA = progressive nonfluent aphasia.
FTD-U and FTD-T within the SEMD group.
In SEMD with either FTD-U or FTD-T, the results were similar to that of the whole SEMD group (described above) but differed qualitatively from the whole FTD-U or FTD-T analyses (figure 2). Atrophy for FTD-U within the SEMD group included the right temporal pole (around the [40, 18, −28] mm location, t value 11.91, z score 6.91), left temporal lobe ([−26, −6, −30] mm, t value 8.84, z score 5.96), left hippocampus ([−30, −26, −14] mm, t value 10.25, z score 6.49), right insula ([42, −4, −4] mm, t value 9.19, z score 6.06), and left insula ([−36, 10, −14] mm, t value 8.90, z score 5.98). For the FTD-T pathology within the SEMD group, locations included the left inferior temporal lobe ([−22, −10, −32] mm, t value 8.52, z score 5.78), left insula ([−38, 12, −10], t value 7.75, z score 5.48, including its posterior aspect around [−38, −6, −4] mm, t value 7.14, z score 5.29), and left hippocampus ([−30, −22, −14] mm, t value 6.03, z score 4.69).
FTD-A.
The cognitive profile of the FTD-A patients, contrasted to the SEMD groups with FTD-U and FTD-T, is summarized in table e-2. Parametric analysis of the FTD-A group revealed a striking pattern of focal left hippocampal atrophy (around [−32, −32, −10] mm, t value 6.59, z score 4.97) (figure 3). The nonparametric approach confirmed this finding (figure e-1). Atrophy remained exclusively left-lateralized after reducing the statistical threshold to p < 0.001 (uncorrected) though at this level, atrophy of the left superior temporal gyrus also emerged (figure 3). In view of the qualitative differences in these results compared to FTLD/SEMD, the raw MRI scans were examined to see if this was apparent in individual patients. These images suggest that while FTD-A patients had temporal lobe atrophy compared to controls, there was absence of knife-edge atrophy and, most notably, absence of the severe thinning of the temporal lobe in the region of the collateral sulcus and fusiform gyrus that was evident in the FTLD/SEMD patients (figure 4). The conjunction analysis of SEMD and FTD-A clearly showed the left hippocampus as the main area of atrophy common to both pathologies.
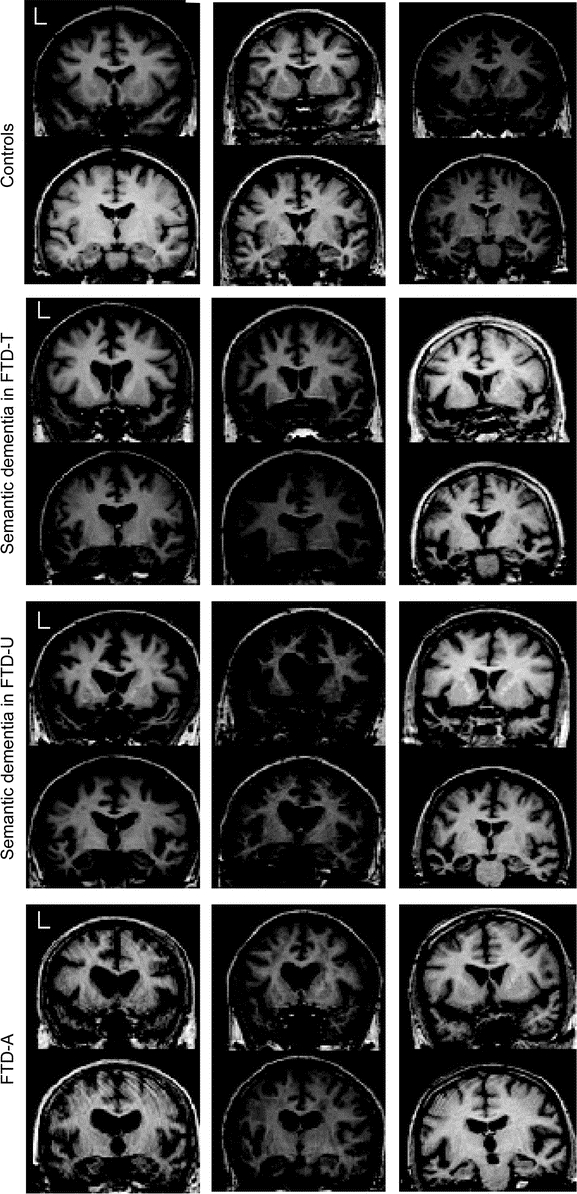
Figure 4 Coronal slices of three patients from each group
Note that although patients with Alzheimer pathology with semantic dementia have left temporal atrophy, knife-edge changes and disproportionate peri-fusiform atrophy appear absent. FTD-A = Alzheimer pathology with semantic dementia; FTD-T = frontotemporal dementia with tau inclusions; FTD-U = frontotemporal dementia with ubiquitin inclusions.
DISCUSSION
These VBM analyses found that FTD-U and FTD-T are associated with similar patterns of atrophy. When the data were reanalyzed according to clinical syndrome, qualitatively different patterns of regional atrophy were identified. Notably, SEMD with Alzheimer pathology (FTD-A) was qualitatively different both from the other pathologic groups and from SEMD with FTLD pathology.
The analyses by clinical syndrome reconfirmed the regional degeneration profiles. Consistent with previous studies, the bvFTD group had degeneration maximal in the mesial frontal regions3,19,20; SEMD was associated with maximal abnormality in the rostral temporal lobes (left worse than right in this cohort)1,20,21; PNFA was associated with maximal abnormality in the left insula.2 When analyzed in conjunction with another clinical syndrome, each group revealed the mesial frontal region as the main common atrophic area. This is consistent with the observation that neuropsychiatric features are not restricted to those with bv-FTD22 and that these behavioral changes correlate with mesial frontal atrophy.23
The analysis according to FTLD histopathologic type was also consistent with previous reports,4–6 insofar as the FTD-U and FTD-T groups were associated with frontotemporal atrophy. In the present cohorts, this was maximal in the mesial frontal, insula, and rostral temporal lobes bilaterally. The abnormalities were more extensive in the FTD-U group—probably a consequence of greater statistical power. The qualitative profile of atrophy in the FTD-U and FTD-T groups was similar as illustrated in the conjunction analysis where the results were essentially the same as those for the FTD-T analysis—in other words, everything that was abnormal in FTD-T was also abnormal in the larger FTD-U group.
The observation that clinical syndromes, but not FTLD histologic subgrouping, were associated with qualitatively different atrophy profiles was exemplified by the SEMD analyses. When SEMD-U and SEMD-T cases were analyzed separately, the results were consistent with the findings of the combined clinical SEMD group but not with the combined FTD-U or FTD-T groups. In other words, regional atrophy and clinical phenotype are linked but histologic subgroup is not. Furthermore, the results from the present analyses were unable to replicate previous positive findings such as that FTD-U was associated with greater temporal lobe atrophy5 or that FTD-T was associated with greater striatal atrophy.6 We would propose that where differences in histopathologic subgroups have been reported to date, it more likely represents the idiosyncrasies of the patients included rather than anything specific to the histopathologic type per se. For instance, it was noted in one study6 that an FTD-T group, in whom there was disproportionate striatal atrophy, also had parkinsonism. Taken together with the current results and the lack of replication of atrophy patterns in FTD-T and FTD-U across all of the studies, it would seem that the most parsimonious interpretation of this finding was the FTD-T cohort happened to have striatal atrophy and hence parkinsonism but that disproportionate striatal atrophy itself is not specific to FTD-T (note that in the current study, some striatal atrophy was detected in FTD-T and the same was seen in FTD-U).
While FTD-U and FTD-T had the same atrophy patterns, this was not the case in FTD-A, in which there was the markedly different profile of focal left hippocampal atrophy. By chance, the three FTD-A cases all had the syndrome of clinical SEMD, meaning that they could be compared with the true SEMD group (i.e., the clinical syndrome of SEMD with an FTLD histopathology). When examined from this perspective, the FTD-A cases were also qualitatively different in that they did not have significant extrahippocampal temporal lobe atrophy (and when it emerged at a lowered statistical threshold, it affected the superior temporal gyrus—the least affected part of the temporal lobe in FTLD/SEMD). A conjunction analysis of FTD-A and SEMD highlighted that left hippocampal atrophy was common to both groups (figure e-3), consistent with previous findings from manual volumetry.24 The FTD-A VBM profile was identified in only three cases, suggesting that the quality of temporal lobe atrophy in cases with apparent clinical SEMD may help differentiate those with atypical Alzheimer pathology. Translation back from VBM to examination of the raw MRI scans suggested that severe focal atrophy in the collateral sulcus and fusiform gyrus can differentiate FTLD/SEMD from those with a SEMD-like syndrome and Alzheimer pathology. This region is known to be severely atrophic in SEMD24–26; the present findings suggest that this could potentially have diagnostic utility and warrants further exploration in prospective studies.
The other interesting point about the FTD-A finding is that it offers a potential insight into how Alzheimer pathology differs in those with this atypical presentation from clinically typical AD in which memory impairment is the salient deficit. Hippocampal atrophy is a well-established feature of AD although it is typically bilateral—for instance, a recent VBM study in minimal AD using a comparable image processing algorithm to the one reported here showed unequivocal bilateral hippocampal atrophy.27 The present results suggest that the extreme left lateralization of atrophy may have been a key determinant of why these patients were not identified in life as having AD. One other study reported preferential hippocampal atrophy in three patients with an FTD phenotype but Alzheimer pathology7; although the authors reported bilateral hippocampal atrophy in their cases it should be noted that, unlike the present series, their averaged VBM data were in heterogeneous cases with respect to clinical FTD phenotype.
This study has some limitations that warrant discussion. Most notably, the numbers were not large. This is fairly typical in studies of this type and is difficult to overcome given that each patient must have had a standardized MRI scan in life and pathologic confirmation. As noted by others,4 the results do not exclude the possibility that tau- or ubiquitin-specific abnormalities might emerge with larger sample sizes. Although this might theoretically offer neurobiological insights, results from large pooled samples would almost certainly not be useful for diagnosis of individual patients. Another limitation is the pathologic stratification of patients. As with two previous reports,4,6 this study used a binary classification of tau- or ubiquitin-positive. It is conceivable that a more fine-grained stratification (e.g., progranulin mutations, sporadic FTD-U, tau mutations, Pick pathology) could offer more specific insights. The present results, however, suggest that because clinical features have a far more significant association with regional atrophy than histopathology, one would also want to stratify patients according to syndromic diagnosis (SEMD, PNFA, bvFTD) to remove this confounding effect. We propose that this confound is the likely explanation for the FTD-U findings reported previously5 which, in passing, did attempt a more detailed classification (FTD-U, Pick, and FTDP-17). The authors reported that FTD-U was associated with greater temporal lobe atrophy; in light of the present findings, we would argue that this was probably because their FTD-U sample contained a slight overrepresentation of SEMD and it was this, rather than anything specific to FTD-U, that drove the effect.
Supplementary Material
Address correspondence and reprint requests to Dr. Peter J. Nestor, University of Cambridge, Addenbrooke's Hospital, Box 83, Cambridge CB2 2QQ UK pjn23@hermes.cam.ac.uk.
Supplemental data at www.neurology.org.
Funded by Medical Research Council (UK) grants to P.J.N. and to M.G.S. G.P. is supported by Alzheimer Research Trust (UK). J.R.H. is supported by an Australian Research Council Federation Fellowship (FF0776229). J.M.S.P. is funded by Fundação para a Ciência e a Tecnologia, Portugal.
Disclosure: The authors report no disclosures.
Medical Devices: GE MRI scanner (GE Medical Systems, Milwaukee, WI).
Received November 28, 2008. Accepted in final form February 9, 2009.
REFERENCES
- 1.Nestor PJ, Fryer TD, Hodges J. Declarative memory impairments in Alzheimer's disease and semantic dementia. Neuroimage 2006;30:1010–1020. [DOI] [PubMed] [Google Scholar]
- 2.Nestor PJ, Graham NL, Fryer TD, Williams GB, Patterson K, Hodges J. Progressive non-fluent aphasia is associated with hypometabolism centered on the left anterior insula. Brain 2003;126:2406–2418. [DOI] [PubMed] [Google Scholar]
- 3.Salmon E, Garraux G, Delbeuck X, et al. Predominant ventromedial frontopolar metabolic impairment in frontotemporal dementia. Neuroimage 2003;20:435–440. [DOI] [PubMed] [Google Scholar]
- 4.Whitwell JL, Warren JD, Josephs KA, et al. Voxel-based morphometry in tau-positive and tau-negative frontotemporal lobar degenerations. Neurodegener Dis 2004:225–230. [DOI] [PubMed] [Google Scholar]
- 5.Whitwell JL, Josephs KA, Rossor MN, et al. Magnetic resonance imaging signatures of tissue pathology in frontotemporal dementia. Arch Neurol 2005;62:1402–1408. [DOI] [PubMed] [Google Scholar]
- 6.Kim EJ, Rabinovici GD, Seeley WW, et al. Patterns of MRI atrophy in tau positive and ubiquitin positive frontotemporal lobar degeneration. J Neurol Neurosurg Psychiatry 2007;78:1375–1378. [DOI] [PMC free article] [PubMed] [Google Scholar]
- 7.Grossman M, Libon D, Forman M, et al. Distinct antemortem profiles in patients with pathologically defined frontotemporal dementia. Arch Neurol 2007;64:1601–1609. [DOI] [PubMed] [Google Scholar]
- 8.Alladi S, Xuereb J, Bak T, et al. Focal cortical presentations of Alzheimer's disease. Brain 2007;130:2636–2645. [DOI] [PubMed] [Google Scholar]
- 9.Forman MS, Farmer J, Johnson JK, et al. Frontotemporal dementia: clinicopathological correlations. Ann Neurol 2006;59:952–962. [DOI] [PMC free article] [PubMed] [Google Scholar]
- 10.Gunten Av, Bouras C, Kövari E, Giannakopoulos P, Hof PR. Neural substrates of cognitive and behavioral deficits in atypical Alzheimer's disease. Brain Res Rev 2006;51:176–211. [DOI] [PubMed] [Google Scholar]
- 11.Kertesz A, McMonagle P, Blair M, Davidson W, Munoz DG. The evolution and pathology of frontotemporal dementia. Brain 1996;128:1996–2005. [DOI] [PubMed] [Google Scholar]
- 12.Neary D, Snowden JS, Gustafson L, et al. Frontotemporal lobar degeneration: a consensus on clinical diagnostic criteria. Neurology 1998;51:1546–1554. [DOI] [PubMed] [Google Scholar]
- 13.Davies R, Hodges J, Kril J, Patterson K, Halliday G, Xuereb J. The pathological basis of semantic dementia. Brain 2005;128:1984–1995. [DOI] [PubMed] [Google Scholar]
- 14.Folstein MF, Folstein SE, McHugh PR. “Mini-mental state”: a practical method for grading the cognitive state of patients for the clinician. J Psychiatr Res 1975;12:189–198. [DOI] [PubMed] [Google Scholar]
- 15.Knibb JA, Xuereb JH, Patterson K, Hodges JR. Clinical and pathological characterization of progressive aphasia. Ann Neurol 2006;63:156–165. [DOI] [PubMed] [Google Scholar]
- 16.Pereira JM, Nestor PJ, Williams GB. Impact of inconsistent resolution on VBM studies. Neuroimage 2008;40:1711–1717. [DOI] [PubMed] [Google Scholar]
- 17.Friston KJ, Penny WD, Glaser DE. Conjunction revisited. Neuroimage 2005;25:661–667. [DOI] [PubMed] [Google Scholar]
- 18.Genovese CR, Lazar NA, Nichols T. Thresholding of statistical maps in functional neuroimaging using the false discovery rate. Neuroimage 2002;15:870–878. [DOI] [PubMed] [Google Scholar]
- 19.Diehl J, Grimmer T, Drzezga A, Riemenschneider M, Förstl H, Kurz A. Cerebral metabolic patterns at early stages of frontotemporal dementia and semantic dementia: a PET study. Neurobiol Aging 2004;25:1051–1056. [DOI] [PubMed] [Google Scholar]
- 20.Rosen H, Gorno-Tempini M, Goldman W, et al. Patterns of brain atrophy in frontotemporal dementia and semantic dementia. Neurology 2002;58:198–208. [DOI] [PubMed] [Google Scholar]
- 21.Mummery C, Patterson K, Price C, Ashburner J, Frackowiak R, Hodges J. A voxel-based morphometry study of semantic dementia: relationship between temporal lobe atrophy and semantic memory. Ann Neurol 2000;47:36–45. [PubMed] [Google Scholar]
- 22.Bozeat S, Gregory CA, Ralph MA, Hodges JR. Which neuropsychiatric and behavioural features distinguish frontal and temporal variants of frontotemporal dementia from Alzheimer's disease? J Neurol Neurosurg Psychiatry 2000;69:178–186. [DOI] [PMC free article] [PubMed] [Google Scholar]
- 23.Williams GB, Nestor PJ, Hodges JR. Neural correlates of semantic and behavioural deficits in frontotemporal dementia. Neuroimage 2005;24:1042–1051. [DOI] [PubMed] [Google Scholar]
- 24.Galton CJ, Patterson K, Graham K, et al. Differing patterns of temporal atrophy in Alzheimer's disease and semantic dementia. Neurology 2001;57:216–225. [DOI] [PubMed] [Google Scholar]
- 25.Chan D, Fox NC, Scahill RI, et al. Patterns of temporal lobe atrophy in semantic dementia and Alzheimer's disease. Ann Neurol 2001;49:433–442. [PubMed] [Google Scholar]
- 26.Davies RR, Graham KS, Xuereb JH, Williams GB, Hodges JR. The human perirhinal cortex and semantic memory. Eur J Neurosci 2004;20:2441–2446. [DOI] [PubMed] [Google Scholar]
- 27.Acosta-Cabronero J, Williams GB, Pereira JMS, Pengas G, Nestor PJ. The impact of skull-stripping and radio-frequency bias correction on grey-matter segmentation for voxel-based morphometry. Neuroimage 2008;39:1654–1665. [DOI] [PubMed] [Google Scholar]
Associated Data
This section collects any data citations, data availability statements, or supplementary materials included in this article.


