

Abstract
Altered muscle coordination strategies in persons with knee osteoarthritis (OA) result in an increase in co-contraction of the quadriceps and hamstrings during walking. While this may increase intersegmental joint contact force and expedite disease progression, it is not currently known whether the magnitude of co-contraction increases with a progressive loss of joint space or whether the level of co-contraction is dependent on walking speed. The purposes of this study were to (1) determine if co-contraction increased with OA severity and (2) discern whether differences in co-contraction were a result of altered freely chosen walking speeds or rather an inherent change associated with disease progression. Forty-two subjects with and without knee osteoarthritis were included in the study. Subjects were divided into groups based on disease severity. When walking at a controlled speed of 1.0 m/s, subjects with moderate and severe knee OA showed significantly higher co-contraction when compared to a healthy control group. At freely chosen walking speeds only the moderate OA group had significantly higher co-contraction values. Increased walking speed also resulted in a significant increase in co-contraction, regardless of group. The results of this study demonstrate that persons with knee OA develop higher antagonistic muscle activity. This occurs despite differences in freely chosen walking speed. Although subjects with OA had higher co-contraction than the control group, co-contraction may not increase with disease severity.
Keywords: Osteoarthritis, Knee, Co-contraction, Gait
1. Introduction
Alterations in the loading environment can influence the degradation of articular cartilage (Griffin and Guilak, 2005; Piscoya et al., 2005). The thickness of the cartilage has been shown to change in the presence of altered loads that are commonly seen in persons with knee osteoarthritis (Koo and Andriacchi, 2007). In addition to changes in the magnitude of joint loading, changes in knee kinematics have been shown to exist in persons with knee OA (Kaufman et al., 2001; McGibbon and Krebs, 2002; Maly et al., 2006; Astephen et al., 2008a). These changes in joint angle alter the region of contact between the femur and tibial plateau, which has the potential to expedite the disease process (Andriacchi et al., 2004).
Although it is understood that higher internal forces may initiate or propagate OA at the tibio-femoral joint by causing physiological changes to cartilaginous and subchondral tissue (Setton et al., 1999; Thorp et al., 2006), determination of in vivo compressive forces at the knee is not possible without implantation of a force measuring device (Lu et al., 1998; D’Lima et al., 2005). However, with the integration of force plates and three dimensional joint kinematics, estimations of joint reaction forces and moments have been possible (Winter, 2005). It is assumed that larger external knee flexion moments would require larger knee extensor muscle forces to prevent collapse of the lower extremity during walking (Crowninshield and Brand, 1981). Large knee extensor muscle forces, in turn, would result in higher joint compression forces (Mesfar and Shirazi-Adl, 2005). In persons with knee OA, a decrease in the external flexion moment has been reported and is thought to be a compensatory method to reduce loads at the knee joint (Kaufman et al., 2001; Al-Zahrani and Bakheit, 2002; Gok et al., 2002; Astephen et al., 2008b), but it is unclear whether total joint contact force is reduced.
There is an interesting paradox in the assumption that the body alters joint positions and moments to reduce intersegmental joint forces in the presence of knee OA. Extrapolation of joint moment data to make assumptions about intersegmental contact force ignores co-contraction of antagonistic muscle groups. Multiple authors have suggested that persons with knee OA utilize a higher level of co-contraction during walking (Hortobagyi et al., 2005; Rudolph et al., 2007; Schmitt and Rudolph, 2007; Hubley-Kozey et al., 2008). Higher levels of co-contraction will result in higher levels of intersegmental force, even if net external joint forces and moments calculated from inverse dynamics remain the same (Lu et al. 1997). For this reason, analysis of co-contraction in addition to changes in net joint moments is essential in a population in which the progression of the disease may be accelerated by an increase in inter-segmental forces.
Changes in knee joint stability may necessitate increased co-contraction during dynamic activities in persons with knee pathologies (Rudolph et al., 2001; Lewek et al., 2004a; Rudolph et al., 2007). While instability is a potential source of increased antagonistic muscle activity, alterations in hip and ankle joint kinetics and kinematics have been noted in persons with knee OA (McGibbon and Krebs, 2002; Ouellet and Moffet, 2002; Mundermann et al., 2005; Astephen et al., 2008a). Since many muscles of the hip and ankle joint are bi-articular, different coordination strategies at ipsilateral lower extremity joints could affect the co-contraction at the knee (Ait-Haddou et al., 2000). Reduced walking speeds have also been reported in the OA population and it is possible that differences in walking speed will affect coordination strategies at the knee (Tseng et al., 2007). Regardless of the cause of co-contraction, quantification of antagonistic muscle activity in a progressive OA population has not been explored.
The purpose of this study was to evaluate the amount of antagonistic muscle activity in persons with moderate and severe OA when compared to a control group. We quantified the amount of co-contraction at 1.0 m/s, self-selected and fast walking speeds in order to differentiate between alterations in coordination strategies that result from differences in walking speed versus changes that are present as a result of some mechanical or physiological process associated with disease progression. We hypothesized that an increase in OA severity would result in an increase in antagonistic muscle activity during the loading response phase of gait.
2. Methods
2.1. Subjects
Forty-two subjects between the ages of 40 and 85 participated in the study. All subjects were divided into three groups based on Kellgren-Lawrence (KL) OA grades of the medial tibio-femoral compartment (Kellgren and Lawrence, 1957). The KL grading system identifies severity based on the presence of osteophytes and joint space narrowing and was determined using 30 degree flexed knee, posterior to anterior radiographs which were read by a radiologist. Control subjects (n = 18) all had no evidence of joint space narrowing or osteophytes and had no complaints of knee pain with daily activities. Subjects with KL scores 2–3 were classified as moderate (n = 16) and subjects with KL scores of 4 were classified as severe (n = 8). Subjects were excluded if they presented with KL grades in the lateral compartment greater than those in the ipsilateral medial compartment. All subjects signed an informed consent form and were given the right to withdraw from the study at any time without penalty. For the trials at 1.0 m/s, a subset of 40 subjects participated; 18, 16 and 6 subjects participated for the control, moderate and severe OA groups, respectively.
2.2. Experimental protocol
Electromyographic data were obtained during walking trials at three different speeds: 1.0 m/s, self-selected and fastest tolerable. All walking trials took place on a split-belt treadmill capable of capturing three-dimensional ground reaction forces, free moment and center of pressure data (Bertec Corp., Columbus, OH, USA). Three-dimensional kinematics was obtained through 23 retro-reflective markers using a six camera Motion Analysis system (Santa Rosa, CA, USA). The marker data were used to determine heel strike and toe off during the successive foot strikes on the treadmill. Self-selected walking speed was considered the subject’s freely chosen walking pace during a 10 m timed walk overground. Fastest tolerable speed was defined as the fastest speed at which each subject could safely walk on the treadmill without the use of handrails. Speed was increased for each subject until the fastest tolerable speed was achieved. For safety, all subjects wore an overhead harness and had access to an emergency stop button located on the handrail of the treadmill. Subjects were allowed to hold the handrails for support during the transitions between speeds, or while acclimating to each speed, but walked without any upper extremity support during the time of data acquisition. Based on previous research, subjects were given at least four minutes to acclimate to treadmill walking at the 1.0 m/s and self-selected speeds and data collection did not commence until the subjects reported they felt “comfortable” walking at the selected speed (Zeni and Higginson, 2006).
Electromyographic data were obtained from dual passive Ag/AgCl surface electrodes (Blue Sensor N, Ambu, Denmark) arranged in a bipolar configuration and placed 20 mm apart. The electrodes were positioned parallel to the muscle fibers over the center of the muscle bellies of the tibialis anterior, vastus lateralis (VL), rectus femoris, semimembranosus (SM), medial gastrocnemius, soleus, gluteus medius and gluteus maximus. A reference electrode was placed over the electrically neutral tissue anterior to the tibial shaft of the right leg. For the purposes of this paper, only the VL and SM were analyzed. Although data were collected bilaterally, only a single side was chosen for analysis. In the OA group the more painful leg was analyzed and in the control group the side alternated between the left and right for each consecutive subject.
Electrode placement was validated through assessment of specific movements against resistance aimed at isolating each muscle. Digital gains were set for each muscle to produce the maximal signal. All subjects completed a maximal voluntary isometric contraction (MVIC) for use in normalizing the data during the walking trials. Because subjects with varying degrees of OA severity and levels of mobility participated in the study, positions for MVIC were chosen that would allow all subjects to complete the testing without difficulty. For the VL, this was in a seated position with the knee flexed approximately 45 degrees. For the SM, subjects stood supported while they flexed their knee to ~60 degrees and manual resistance was applied to oppose the flexion of the knee. None of the subjects were able to overcome this resistance during the MVIC trials. During MVIC trials all subjects were provided visual feedback of the EMG signal magnitude, as well as verbal encouragement to push maximally during each trial. Raw analog EMG signals were digitally sampled at 1080 samples per second.
The VL and SM were chosen as representative muscles of the knee extensors and flexors based on magnitude and orientation of their muscle force. Since the assessment of co-contraction has been linked to increased intersegmental forces, using the muscles with the highest maximal isometric force values that would lead to the greatest compression forces was important. The VL and SM have been cited as being the muscles of the quadriceps and hamstrings, respectively, capable of producing the highest maximal isometric force and are used as such in studies that model lower extremity muscle force (Delp et al., 1990). In addition to the magnitude of force produced by these muscles, the orientation of the force is also an important consideration for choosing the VL and SM. All of the muscles of the quadriceps group act through the patellar tendon which results in a muscle orientation vector that lies anterior to the knee joint center, midway between the medial and lateral plateaus. Muscle force applied in this orientation results in an internal knee extension moment, but insignificant transverse or frontal plane moments. The hamstrings, however, are composed of multiple muscles with distinctly different attachments on the posterior aspect of the tibia. The attachment of the SM lies posterior and medial to the center of the knee joint which will result in not only an internal flexion moment, but an internal adduction moment as well. Net adduction moments have been correlated with higher medial contact forces on the tibial plateau (Zhao et al., 2007). Inclusion of the SM in the analysis of co-contraction is essential since we are analyzing the changes in persons with medial compartment knee OA.
2.3. Data processing
Raw EMG data acquired during the walking and MVIC trials were bandpass filtered at 30–400 Hz with a 4th order recursive Butterworth filter. The mean was subtracted from each point to remove any baseline offset. The data were then rectified and filtered using a low pass recursive Butterworth filter with a cutoff frequency of 25 Hz to create a linear envelope. For the purposes of normalizing the signal obtained during the walking trials, peak MVIC values were obtained using the average of 5 consecutive points surrounding the peak value during the MVIC trial. EMG values obtained during the walking trials were normalized to these peak MVIC values.
Subjects walked at their self-selected cadences, therefore the number of strides per trial varied between individuals. Taking the ensemble average could potentially alter the magnitude and shape of the signals differently for each subject. For this reason only the first 5 strides were chosen for each individual. The stride cycles began at heel strike and terminated at the subsequent ipsilateral heel strike. These 5 strides were time normalized to 250 points and averaged on a point by point basis to create a single walking trial that represented one complete gait cycle from heel strike to heel strike.
To include magnitude and temporal components in the analysis of co-contraction, a previously described method was used (Rudolph et al., 2000) Eq. (1). The equation for the co-contraction index (CCI) is given, where lowerEMG represents the signal from the less active muscle and higherEMG represents the value of the more active higher muscle.
| (1) |
This was calculated for the first 50 data points of each averaged trial and the mean was taken to represent the total amount of co-contraction for this period. This represents 20% of the gait cycle, and is a period when kinematic and kinetic events may influence the magnitude and orientation of joint loading. This period also often includes peak knee flexion, peak vertical ground reaction force and peak longitudinal knee reaction force. It is also the time in which both the quadriceps and hamstrings are most active during the gait cycle (Winter, 1983; Perry, 1992). In order to account for the neuromuscular delay, we also included the data points from the last 2% of the gait cycle (Fig. 1). This placed the beginning of the analysis an average of 22 ms prior to initial contact for the control and freely chosen walking speeds.
Fig. 1.
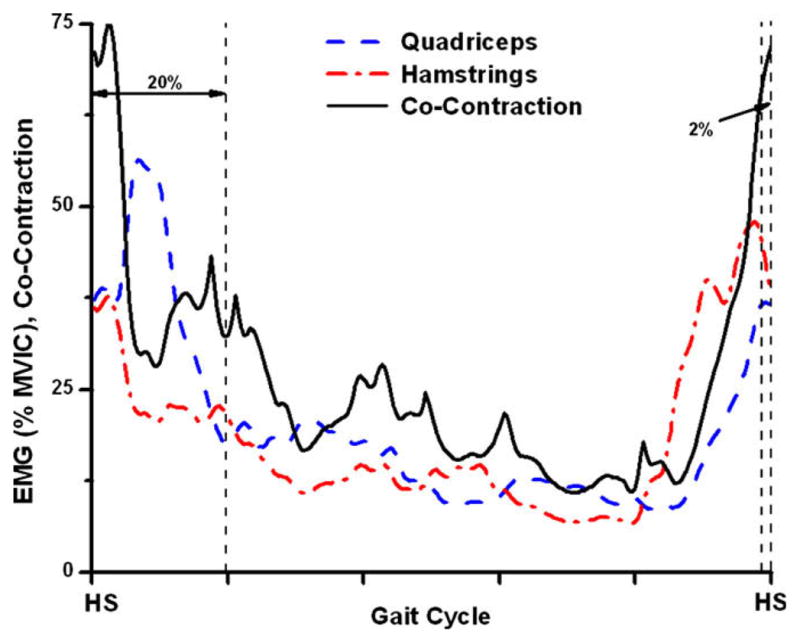
Determination of co-contraction was performed using equation 4.1. The mean of the first 20% and terminal 2% of the resultant CCI curve was defined as the single value of the CCI.
CCI was calculated for each subject and group means and standard deviations were reported for each of the speeds. Mean and peak amplitude of the EMG signal was also determined for the quadriceps and hamstrings. Individual one-way ANOVAs were conducted to determine differences between groups at each speed with Tukey post-hoc testing to compare group individual differences. In order to determine the influence of speed, as well as OA severity on the CCI values, repeated measures ANOVAs were performed between CCI values at the 1.0 m/s and self-selected speeds, as well as between the self-selected and fast walking speeds. In order to further differentiate the effects of walking speed on the CCI values, one way ANCOVAs with speed as a covariate were used at the self-selected and fast walking speeds. Components of the CCI including peak and mean EMG values for individual muscles were also reported and were analyzed using multivariate ANOVAs at each speed.
3. Results
Differences existed between groups for the self-selected and fast walking speeds (Table 1). Subjects in the moderate and severe group showed significantly lower walking speeds compared to the control group. No differences existed between the self-selected or fast walking speeds between the moderate and severe OA group (p > 0.13).
Table 1.
Demographics for each of the subjects groups. Significant differences between the OA groups and control groups are shown with the (*). Standard deviations are shown in below the mean (SD).
| Group |
|||
|---|---|---|---|
| Control | Moderate | Severe | |
| Sample size | 18 | 16 | 8 |
| Gender (males) | 8 | 6 | 3 |
| Age (years) | 61.0 | 62.8 | 62.2 |
| 11 | 10 | 8 | |
| SS speed (m/s) | 1.25 | 1.14* | 1.05* |
| 0.19 | 0.12 | 0.20 | |
| Fast speed (m/s) | 1.75 | 1.53* | 1.4* |
| 0.22 | 0.20 | 0.21 | |
| Change in speed (%) | 40 | 35 | 35 |
| 12 | 18 | 23 | |
Significant differences in the CCI between groups were seen at 1.0 m/s, self-selected and fast walking speeds (p = 0.002, 0.008, 0.008, respectively) when analyzed with the univariate ANOVAs and speed was not included as a covariate (Table 2). At 1.0 m/s, both the moderate and severe OA groups had significantly higher CCI values when compared to the control group (p = 0.002 and p = 0.049, respectively) (Fig. 2). CCI for the moderate group was 24.2 and 23.3 for the severe group which were more than twice the values of the control group that had a CCI of 11.8. There were no differences between CCI values for moderate and severe OA groups at 1.0 m/s (p = 0.98). At the self-selected walking speed, the moderate group had the highest CCI value of 25.3 and was significantly different than the control group CCI (13.6) (p = 0.005). No differences existed between the control and severe (p = 0.52) or moderate and severe (p = 0.29). There was a similar trend at the fast walking speed and the moderate group had higher CCI values than the control and severe group although this difference was only significant relative to the control group (p = 0.005). No significant differences existed for the severe group.
Table 2.
CCI and individual muscle activity values are given for all groups and conditions. For the CCI and mean and peak quadriceps and hamstring activity, the moderate and severe OA groups have higher values than the control group at all of the speeds. Values followed by the (*) were significantly different than the control group when speed was and was not included as a covariate (p ≤ 0.05).
| CCI |
Mean quads |
Peak quads |
Peak hams |
Mean hams |
|||||||||||
|---|---|---|---|---|---|---|---|---|---|---|---|---|---|---|---|
| Control | Moderate | Severe | Control | Moderate | Severe | Control | Moderate | Severe | Control | Moderate | Severe | Control | Moderate | Severe | |
| Control (SD) | 11.8 (5.5) | 24.2* (12.4) | 23.3* (12.9) | 11.4 (4.7) | 27.4* (17.7) | 21.7 (12.3) | 18.7 (8.3) | 45.5 (31.3) | 39.9 (20.8) | 19.1 (9.4) | 35.6* (22.4) | 36.6 (20.3) | 10.8 (5.7) | 19.7 (13.8) | 21.7 (15.4) |
| SS (SD) | 13.6 (6.6) | 25.3* (12.6) | 20.4 (12.7) | 13 (4.5) | 28.5 (18.8) | 21.9 (14) | 23.2 (9.4) | 46.9 (32.1) | 39.3 (24.9) | 23.8 (14.7) | 38.5 (20.6) | 42.6 (37.7) | 11.9 (6.8) | 19.9 (10.0) | 21.9 (21.2) |
| Fast (SD) | 18.8 (6.8) | 33.2* (17.5) | 25 (11.3) | 19.9 (7.0) | 38.3 (26.1) | 21.6 (9.6) | 34.8 (13.4) | 75.0 (51.3) | 36.2 (16.4) | 32.1 (16.7) | 44.8 (23.1) | 45.4 (18.5) | 15.6 (7.5) | 24.2 (12.9) | 24.4 (14.7) |
Fig. 2.

Differences between groups existed at all speeds. Subjects without arthritis had the lowest CCI values while the moderate group had significantly higher CCI values at all speeds. Significant differences between the control group and both OA groups were seen when walking at 1.0 m/s. At the self-selected and fast walking speeds only the moderate group showed significantly higher CCI values. (*) represents significant differences (p ≤ 0.05).
The multivariate analysis of individual mean and peak EMG values revealed between group differences for the 1.0 m/s walking speed (p = 0.025) (Table 2). Post-hoc testing showed significant differences in mean quadriceps (p = 0.002), peak quadriceps (p = 0.003) and peak hamstring (p = 0.022) activity between the moderate and control group at 1.0 m/s (Fig. 3). No differences were found between other groups at the 1.0 m/s speed. Although the self-selected (p = 0.062) and fast walking speed (p = 0.058) did not show statistically significant differences between groups, it should be noted that significant differences were approached at both speeds.
Fig. 3.

Subjects with moderate and severe OA showed higher peak and mean muscle activity for the quadriceps and hamstrings when compared to the control group at all of the walking speeds, although this difference was not significant at all conditions. (A) Mean quadriceps was significantly higher in persons with moderate OA, and (B) the same group showed significantly higher peak quadriceps and hamstrings activity. (*) indicates significant differences between the moderate and control groups (p ≤ 0.05).
Walking speed also affected the degree of co-contraction. Significant differences were found in CCI values using repeated measures ANOVA between self-selected and fast walking speeds (p < 0.001). The mean CCI of all groups at the self-selected speed was 19.5 ± 1.1 and this increased to 25.6 ± 1.4 at the fast walking speed. There was no speed × group interaction effect (p = 0.431), and the control, moderate OA and severe OA groups showed a similar increase in the level of co-contraction (32, 33 and 26% increase, respectively). When the CCI values were compared between 1.0 m/s and self-selected walking speed, no significant differences were found (p = 0.174). Because differences were found using the repeated measures ANOVA for the CCI between the self-selected and fast walking speeds, we wanted to further remove differences between groups that may be attributed solely to walking speed rather than OA severity. The use of a one-way ANCOVA with speed as a covariate still resulted in significant differences between groups at the self-selected (p = 0.027) and fast walking speed (p = 0.016). At the self-selected and fast walking speeds, the moderate group still had significantly higher CCI values than the control group (p = 0.008, p = 0.005) (Table 2). No differences existed between any other group pairings.
4. Discussion
This study intended to determine if persons with different severities of knee OA utilized altered muscle coordination strategies at the knee during walking that would result in higher co-contraction values. Consistent with previous literature we found higher levels of antagonistic activity in the pathological groups during walking (Hortobagyi et al., 2005; Lewek et al., 2006; Ramsey et al., 2007; Rudolph et al., 2007; Schmitt and Rudolph, 2007). However, in the current study, we analyzed subjects with varying degrees of knee OA, as well as different walking conditions. From this study we discerned that faster walking speeds resulted in higher co-contraction values for all groups. We also concluded that irrespective of speed, subjects with knee OA utilized control strategies that resulted in higher levels of antagonistic muscle activity.
The fact that differences were seen at the control speed (1.0 m/s) and differences were significant when analyzed with respect to speed, suggests that differences in co-contraction seen in individuals with OA are related to intrinsic differences, not merely artifacts of different freely chosen walking speeds. Studies evaluating kinematic and kinetic gait parameters in persons with knee OA have found that walking speed significantly influences results (Bejek et al., 2006). Similar alterations in gait parameters have also been found in persons with hip OA (Mockel et al., 2003). For this reason, it was important that we ascertain if muscle activation patterns change in response to external moments and forces that are associated with different walking speeds and not to pathology. While controlling walking speed reduces differences in joint kinematics and kinetics that may be related to freely chosen walking speed, it may still alter control strategies. In order to ensure all subjects would be able to achieve the control walking speed, we chose a value for the control speed that was closer to the self-selected speed in the severe group. This resulted in subjects in the control group reducing their normal walking speed, and subjects with severe OA potentially increasing their walking speed to achieve 1.0 m/s. While this may confound the results, using speed as a covariate at the self-selected and fast walking speeds removes the effect of different walking speeds, and highlights individual differences in co-activation strategies. Using this method, it appears that persons with knee OA utilize a coordination strategy that results in higher CCI values independent of the speed at which they walk.
Previous authors have also suggested that reduction in walking speed may be a compensatory method utilized to reduce joint loading at the knee (Mundermann et al., 2004). While reducing walking speed has been suggested as a mechanism to reduce compressive forces (Robon et al., 2000), magnitude of external reaction forces (Bejek et al., 2006) and muscle activity associated with knee motion (Chiu and Wang, 2007; Liu et al., 2008), alterations in walking speed did not account for the differences in CCI seen in this study. While mean CCI values were higher at the fast walking speed for all the groups, the fact that significant differences were found when speed was used as a covariate at the self-selected speed suggests that the reduction in self-selected walking speed in persons with OA does not effectively reduce antagonistic muscle activity to normal levels. This is a very important finding and contrasts with the suggestion that a reduction in walking speed is a mechanism to reduce joint load (Mundermann et al., 2004). Slower walking speed may reduce the reaction forces and moments at the knee joint and may reduce co-contraction within a group of persons when compared to their faster walking speed. However, the magnitude of co-contraction seems to be dependent on the presence or absence of knee OA, and not by the speed at which subjects walk.
Frequently, persons with knee OA will demonstrate an increase in joint laxity and a reduction in dynamic stability of the knee during walking (Fitzgerald et al., 2004; Rudolph et al., 2007). The increased levels of co-contraction that persons with knee OA use may reflect an internal strategy to maximize stability during walking. While this may be a method to improve joint stability, it may also result in inefficient or metabolically demanding gait patterns (Unnithan et al., 1996) that may expedite the disease process (Griffin and Guilak, 2005; Piscoya et al., 2005). Since the increased co-contraction was seen at the 1.0 m/s walking speed, it demonstrated that this may occur even at slower walking speeds.
While both OA groups showed significant differences in CCI versus the control group at 1.0 m/s, only the moderate group was significantly higher than the control group at the self-selected walking speed. Although the CCI values were higher in the severe group than the control group, it did not reach significant levels. Given that EMG signals can be affected by a multitude of external factors (such as body mass or skin movement (De Luca, 1997) and our lower sample size of subjects with severe OA, the potential for Type II statistical error exists. Although significant differences did not exist for all groups at all conditions, the fact that the OA groups had larger values for all EMG variables should not be overlooked. We think this is an important finding and we feel that, given a larger sample size and BMI matched subjects, more of the results would achieve statistical significance. Even though these limitations exist, subjects with severe OA may not utilize higher levels of co-contraction at the self-selected or fast walking speed. Previous investigations have found that while subjects with lower grades of arthritis have higher anterior/posterior and rotational joint laxity, subjects with severe OA show levels of laxity similar to control groups (Wada et al., 1996). The laxity in the moderate OA group may be the result of decreased cartilage tissue or diminished meniscal support, whereas subjects with severe OA may have increased osteophytes and higher friction at the articulating surface. This would reduce the need for extra-articular muscular support and subsequently reduce the CCI in this group.
One limitation with this methodology is that differences in voluntary contraction during MVIC may result in inflated differences in CCI or individual muscle activity during walking. Because all subjects were encouraged to maximally contract their muscles during MVIC collection we do not feel that this was an issue with our study. They were given verbal, tactile as well as visual motivation by showing them the magnitude of the EMG signal during contraction. The same investigator was responsible for conducting all of the MVIC trials for all of the subjects. In addition, previous research has shown that there is also no difference in voluntary activation of the quadriceps between persons with and without knee OA (Lewek et al., 2004b). We feel that the use of MVIC during our data collection provided a valid measure of a persons’ maximal force generating ability.
We have demonstrated that subjects with knee OA utilize different coordination strategies than persons without radiographic evidence of knee OA. Subjects with OA have higher antagonistic muscle activity during walking at control (1.0 m/s), self-selected and fast walking speeds. The fact that significant differences were seen when the effect of speed was removed suggests that coordination strategies resulting in higher CCI values are a result of the disease process and not due to differences in walking speed. While the current study advances the knowledge about differences in coordination strategies at the knee, it does not resolve whether these neuromuscular alterations will induce mechanical changes (such as joint space narrowing) or are a result of mechanical changes in the knee. Future research should address the potential of higher co-contraction to lead to degenerative changes at the knee joint by incorporating a longitudinal experimental design.
Acknowledgments
Funding support for this project was provided by NIH Grant P20-RR16458. The work was completed without any conflicts of interest.
Biographies

Joseph Zeni, Jr. graduated with his Master’s of Physical Therapy from Quinnipiac University in 2003. He received his Ph.D. from the interdisciplinary Biomechanics and Movement Science Program at the University of Delaware. His research interests include biomechanical factors that relate to the development and progression of knee osteoarthritis. He is currently working as a post-doctoral researcher with the Department of Physical Therapy at the University of Delaware.
Katherine Rudolph earned her Master of Science in Physical Therapy from Boston University in 1989 and her Ph.D. in Biomechanics and Movement Sciences from the University of Delaware in 1998. Dr. Rudolph joined the faculty of the Department of Physical Therapy and Program in Biomechanics and Movement Sciences at the University of Delaware in 1999 and is currently an Associate Professor. She has served as a manuscript reviewer for many US and International journals and has been on grant review panels for the National Institutes of Health, Shriners Hospitals, Reumafronds (Dutch Arthritis Foundation) and the Foundation for Physical Therapy. Her research interest is the control of locomotion in patient populations. She studies walking in patients with knee osteoarthritis and neurological injury and is involved in studies that develop research based physical therapy interventions.

Dr. Jill Higginson is an Assistant Professor in the Department of Mechanical Engineering and Director of the Center for Biomedical Engineering Research at the University of Delaware. She trained at Cornell University (BS ’96), Penn State University (MS ’98) and Stanford University (Ph.D. ’05). Her research applies experimental and computational techniques to study muscle coordination during walking in healthy and impaired populations. As part of an interdisciplinary study funded by the National Institutes of Health, She has been studying the relationship between joint loading and cartilage geometry during the progression of knee osteoarthritis.
References
- Ait-Haddou R, Binding P, Herzog W. Theoretical considerations on cocontraction of sets of agonistic and antagonistic muscles. J Biomech. 2000;33(9):1105–11. doi: 10.1016/s0021-9290(00)00085-3. [DOI] [PubMed] [Google Scholar]
- Al-Zahrani KS, Bakheit AM. A study of the gait characteristics of patients with chronic osteoarthritis of the knee. Disabil Rehabil. 2002;24(5):275–80. doi: 10.1080/09638280110087098. [DOI] [PubMed] [Google Scholar]
- Andriacchi TP, Mundermann A, Smith RL, Alexander EJ, Dyrby CO, Koo SA. Framework for the in vivo pathomechanics of osteoarthritis at the knee. Ann Biomed Eng. 2004;32(3):447–57. doi: 10.1023/b:abme.0000017541.82498.37. [DOI] [PubMed] [Google Scholar]
- Astephen JL, Deluzio KJ, Caldwell GE, Dunbar MJ. Biomechanical changes at the hip, knee, and ankle joints during gait are associated with knee osteoarthritis severity. J Orthop Res. 2008a;26(3):332–41. doi: 10.1002/jor.20496. [DOI] [PubMed] [Google Scholar]
- Astephen JL, Deluzio KJ, Caldwell GE, Dunbar MJ, Hubley-Kozey CL. Gait and neuromuscular pattern changes are associated with differences in knee osteoarthritis severity levels. J Biomech. 2008b;41(4):868–76. doi: 10.1016/j.jbiomech.2007.10.016. [DOI] [PubMed] [Google Scholar]
- Bejek Z, Paroczai R, Illyes A, Kiss RM. The influence of walking speed on gait parameters in healthy people and in patients with osteoarthritis. Knee Surg Sports Traumatol Arthrosc. 2006;14(7):612–22. doi: 10.1007/s00167-005-0005-6. [DOI] [PubMed] [Google Scholar]
- Chiu MC, Wang MJ. The effect of gait speed and gender on perceived exertion, muscle activity, joint motion of lower extremity, ground reaction force and heart rate during normal walking. Gait Posture. 2007;25(3):385–92. doi: 10.1016/j.gaitpost.2006.05.008. [DOI] [PubMed] [Google Scholar]
- Crowninshield RD, Brand RA. A physiologically based criterion of muscle force prediction in locomotion. J Biomech. 1981;14(11):793–801. doi: 10.1016/0021-9290(81)90035-x. [DOI] [PubMed] [Google Scholar]
- De Luca C. The use of surface electromyography in biomechanics. J Appl Biomech. 1997;12(2):135–63. [Google Scholar]
- Delp SL, Loan JP, Hoy MG, Zajac FE, Topp EL, Rosen JM. An interactive graphics-based model of the lower extremity to study orthopaedic surgical procedures. IEEE Trans Biomed Eng. 1990;37(8):757–67. doi: 10.1109/10.102791. [DOI] [PubMed] [Google Scholar]
- D’Lima DD, Townsend CP, Arms SW, Morris BA, Colwell CW., Jr An implantable telemetry device to measure intra-articular tibial forces. J Biomech. 2005;38(2):299–304. doi: 10.1016/j.jbiomech.2004.02.011. [DOI] [PubMed] [Google Scholar]
- Fitzgerald GK, Piva SR, Irrgang JJ. Reports of joint instability in knee osteoarthritis: its prevalence and relationship to physical function. Arthritis Rheum. 2004;51(6):941–6. doi: 10.1002/art.20825. [DOI] [PubMed] [Google Scholar]
- Gok H, Ergin S, Yavuzer G. Kinetic and kinematic characteristics of gait in patients with medial knee arthrosis. Acta Orthop Scand. 2002;73(6):647–52. doi: 10.1080/000164702321039606. [DOI] [PubMed] [Google Scholar]
- Griffin TM, Guilak F. The role of mechanical loading in the onset and progression of osteoarthritis. Exerc Sport Sci Rev. 2005;33(4):195–200. doi: 10.1097/00003677-200510000-00008. [DOI] [PubMed] [Google Scholar]
- Hortobagyi T, Westerkamp L, Beam S, Moody J, Garry J, Holbert D, et al. Altered hamstring-quadriceps muscle balance in patients with knee osteoarthritis. Clin Biomech (Bristol, Avon) 2005;20(1):97–104. doi: 10.1016/j.clinbiomech.2004.08.004. [DOI] [PubMed] [Google Scholar]
- Hubley-Kozey C, Deluzio K, Dunbar M. Muscle co-activation patterns during walking in those with severe knee osteoarthritis. Clin Biomech (Bristol, Avon) 2008;23(1):71–80. doi: 10.1016/j.clinbiomech.2007.08.019. [DOI] [PubMed] [Google Scholar]
- Kaufman KR, Hughes C, Morrey BF, Morrey M, An KN. Gait characteristics of patients with knee osteoarthritis. J Biomech. 2001;34(7):907–15. doi: 10.1016/s0021-9290(01)00036-7. [DOI] [PubMed] [Google Scholar]
- Kellgren JH, Lawrence JS. Radiological assessment of osteoarthrosis. Ann Rheum Dis. 1957;16(4):494–502. doi: 10.1136/ard.16.4.494. [DOI] [PMC free article] [PubMed] [Google Scholar]
- Koo S, Andriacchi TP. A comparison of the influence of global functional loads vs. local contact anatomy on articular cartilage thickness at the knee. J Biomech. 2007;40(13):2961–6. doi: 10.1016/j.jbiomech.2007.02.005. [DOI] [PMC free article] [PubMed] [Google Scholar]
- Lewek MD, Rudolph KS, Snyder-Mackler L. Control of frontal plane knee laxity during gait in patients with medial compartment knee osteoarthritis. Osteoarthr Cartilage. 2004a;12(9):745–51. doi: 10.1016/j.joca.2004.05.005. [DOI] [PMC free article] [PubMed] [Google Scholar]
- Lewek MD, Rudolph KS, Snyder-Mackler L. Quadriceps femoris muscle weakness and activation failure in patients with symptomatic knee osteoarthritis. J Orthop Res. 2004b;22(1):110–5. doi: 10.1016/S0736-0266(03)00154-2. [DOI] [PMC free article] [PubMed] [Google Scholar]
- Lewek MD, Scholz J, Rudolph KS, Snyder-Mackler L. Stride-to-stride variability of knee motion in patients with knee osteoarthritis. Gait Posture. 2006;23(4):505–11. doi: 10.1016/j.gaitpost.2005.06.003. [DOI] [PMC free article] [PubMed] [Google Scholar]
- Liu MQ, Anderson FC, Schwartz MH, Delp SL. Muscle contributions to support and progression over a range of walking speeds. J Biomech. 2008;41(15):3243–52. doi: 10.1016/j.jbiomech.2008.07.031. [DOI] [PMC free article] [PubMed] [Google Scholar]
- Lu TW, Taylor SJ, O’Connor JJ, Walker PS. Influence of muscle activity on the forces in the femur: an in vivo study. J Biomech. 1997;30(11–12):1101–6. doi: 10.1016/s0021-9290(97)00090-0. [DOI] [PubMed] [Google Scholar]
- Lu TW, O’Connor JJ, Taylor SJ, Walker PS. Validation of a lower limb model with in vivo femoral forces telemetered from two subjects. J Biomech. 1998;31(1):63–9. doi: 10.1016/s0021-9290(97)00102-4. [DOI] [PubMed] [Google Scholar]
- Maly MR, Costigan PA, Olney SJ. Role of knee kinematics and kinetics on performance and disability in people with medial compartment knee osteoarthritis. Clin Biomech (Bristol, Avon) 2006;21(10):1051–9. doi: 10.1016/j.clinbiomech.2006.06.010. [DOI] [PubMed] [Google Scholar]
- McGibbon CA, Krebs DE. Compensatory gait mechanics in patients with unilateral knee arthritis. J Rheumatol. 2002;29(11):2410–9. [PubMed] [Google Scholar]
- Mesfar W, Shirazi-Adl A. Biomechanics of the knee joint in flexion under various quadriceps forces. Knee. 2005;12(6):424–34. doi: 10.1016/j.knee.2005.03.004. [DOI] [PubMed] [Google Scholar]
- Mockel G, Perka C, Labs K, Duda G. The influence of walking speed on kinetic and kinematic parameters in patients with osteoarthritis of the hip using a force-instrumented treadmill and standardised gait speeds. Arch Orthop Trauma Surg. 2003;123(6):278–82. doi: 10.1007/s00402-003-0513-0. [DOI] [PubMed] [Google Scholar]
- Mundermann A, Dyrby CO, Hurwitz DE, Sharma L, Andriacchi TP. Potential strategies to reduce medial compartment loading in patients with knee osteoarthritis of varying severity: reduced walking speed. Arthritis Rheum. 2004;50(4):1172–8. doi: 10.1002/art.20132. [DOI] [PubMed] [Google Scholar]
- Mundermann A, Dyrby CO, Andriacchi TP. Secondary gait changes in patients with medial compartment knee osteoarthritis: increased load at the ankle, knee, and hip during walking. Arthritis Rheum. 2005;52(9):2835–44. doi: 10.1002/art.21262. [DOI] [PubMed] [Google Scholar]
- Ouellet D, Moffet H. Locomotor deficits before and two months after knee arthroplasty. Arthritis Rheum. 2002;47(5):484–93. doi: 10.1002/art.10652. [DOI] [PubMed] [Google Scholar]
- Perry J. Gait analysis: normal and pathological function. Thorofare, NJ: SLACK Inc; 1992. [Google Scholar]
- Piscoya JL, Fermor B, Kraus VB, Stabler TV, Guilak F. The influence of mechanical compression on the induction of osteoarthritis-related biomarkers in articular cartilage explants. Osteoarthr Cartilage. 2005;13(12):1092–9. doi: 10.1016/j.joca.2005.07.003. [DOI] [PubMed] [Google Scholar]
- Ramsey DK, Snyder-Mackler L, Lewek M, Newcomb W, Rudolph KS. Effect of anatomic realignment on muscle function during gait in patients with medial compartment knee osteoarthritis. Arthritis Rheum. 2007;57(3):389–97. doi: 10.1002/art.22608. [DOI] [PMC free article] [PubMed] [Google Scholar]
- Robon MJ, Perell KL, Fang M, Guererro E. The relationship between ankle plantar flexor muscle moments and knee compressive forces in subjects with and without pain. Clin Biomech (Bristol, Avon) 2000;15(7):522–7. doi: 10.1016/s0268-0033(00)00007-3. [DOI] [PubMed] [Google Scholar]
- Rudolph KS, Axe MJ, Snyder-Mackler L. Dynamic stability after ACL injury: who can hop? Knee Surg Sports Traumatol Arthrosc. 2000;8(5):262–9. doi: 10.1007/s001670000130. [DOI] [PubMed] [Google Scholar]
- Rudolph KS, Axe MJ, Buchanan TS, Scholz JP, Snyder-Mackler L. Dynamic stability in the anterior cruciate ligament deficient knee. Knee Surg Sports Traumatol Arthrosc. 2001;9(2):62–71. doi: 10.1007/s001670000166. [DOI] [PubMed] [Google Scholar]
- Rudolph KS, Schmitt LC, Lewek MD. Age-related changes in strength, joint laxity, and walking patterns: are they related to knee osteoarthritis? Phys Ther. 2007;87(11):1422–32. doi: 10.2522/ptj.20060137. [DOI] [PMC free article] [PubMed] [Google Scholar]
- Schmitt LC, Rudolph KS. Influences on knee movement strategies during walking in persons with medial knee osteoarthritis. Arthritis Rheum. 2007;57(6):1018–26. doi: 10.1002/art.22889. [DOI] [PMC free article] [PubMed] [Google Scholar]
- Setton LA, Elliott DM, Mow VC. Altered mechanics of cartilage with osteoarthritis: human osteoarthritis and an experimental model of joint degeneration. Osteoarthr Cartilage. 1999;7(1):2–14. doi: 10.1053/joca.1998.0170. [DOI] [PubMed] [Google Scholar]
- Thorp LE, Wimmer MA, Block JA, Moisio KC, Shott S, Goker B, et al. Bone mineral density in the proximal tibia varies as a function of static alignment and knee adduction angular momentum in individuals with medial knee osteoarthritis. Bone. 2006;39(5):1116–22. doi: 10.1016/j.bone.2006.05.001. [DOI] [PubMed] [Google Scholar]
- Tseng SC, Liu W, Finley M, McQuade K. Muscle activation profiles about the knee during Tai-Chi stepping movement compared to the normal gait step. J Electromyogr Kinesiol. 2007;17(3):372–80. doi: 10.1016/j.jelekin.2005.12.005. [DOI] [PubMed] [Google Scholar]
- Unnithan VB, Dowling JJ, Frost G, Bar-Or O. Role of cocontraction in the O2 cost of walking in children with cerebral palsy. Med Sci Sports Exerc. 1996;28(12):1498–504. doi: 10.1097/00005768-199612000-00009. [DOI] [PubMed] [Google Scholar]
- Wada M, Imura S, Baba H, Shimada S. Knee laxity in patients with osteoarthritis and rheumatoid arthritis. Br J Rheumatol. 1996;35(6):560–3. doi: 10.1093/rheumatology/35.6.560. [DOI] [PubMed] [Google Scholar]
- Winter DA. Biomechanical motor patterns in normal walking. J Mot Behav. 1983;15(4):302–30. doi: 10.1080/00222895.1983.10735302. [DOI] [PubMed] [Google Scholar]
- Winter D. Biomechanics and motor control of human movement. Hoboken, NJ: John Wiley and Sons; 2005. [Google Scholar]
- Zeni J, Higginson J. Familiarization to walking on a split belt treadmill. Blacksburg, VA: American Society of Biomechanics; 2006. [Google Scholar]
- Zhao D, Banks SA, Mitchell KH, D’Lima DD, Colwell CW, Jr, Fregly BJ. Correlation between the knee adduction torque and medial contact force for a variety of gait patterns. J Orthop Res. 2007;25(6):789–97. doi: 10.1002/jor.20379. [DOI] [PubMed] [Google Scholar]