

Abstract
Bioluminescence resonance energy transfer (BRET) systems to date have been dominated by use of blue-green Renilla luciferase (Rluc) as the light donor. While effective in many cases, the expense and unfavorable biochemical attributes of the substrate (phenylcoelenterazine) limit utility of Rluc-based BRET systems. Herein we report a series of novel BRET pairs based on luciferases that utilize D-luciferin, resulting in red-shifted photonic outputs, favorable biochemical attributes and increased efficacy. We developed a modified Förster equation to predict optimal BRET luciferase donor-fluorophore pairs and identified tdTomato as the optimal red fluorophore acceptor for click beetle green luciferase (CBG). A prototypical single-chain protease biosensor, capable of reporting on executioner caspase activity in live cells and in real-time, was generated by inserting a DEVD linker between CBG and tdTomato and validated in vitro with recombinant caspases and in cellulo with apoptosis-sensitive and -resistant cell lines. High signal-to-noise ratios (~33) and Z′ factors (0.85) were observed in live cell longitudinal studies, sufficient for high-throughput screening. Thus, we illustrate a general methodology for the rational design of new BRET systems and provide a novel single chain BRET protease biosensor that is long lived, red-shifted, and utilizes D-luciferin.
1. Introduction
Proteases represent important regulatory nodes in a wide variety of biochemical and pathological pathways. Calpains,1 caspases,2, 3 coagulation proteases,4 matrix metallo-proteases,5 viral proteases,6 and bacterial proteases,7 are representative of clinically relevant proteases and potential targets for therapeutics. Determination of consensus sequences and natural substrates for these enzymes continues to be actively studied.8, 9 The current state of the art for detection of protease activities includes immunoblotting for known protease substrates,10 immunolabeling of activated forms of the protease,11 colorometric or fluorescent readouts of enzyme activity,12–14 and Förster (or fluorescence) resonance energy transfer (FRET) as well as bioluminescence resonance energy transfer (BRET) assays for target cleavage.15, 16 Each methodology has its own set of strengths and limitations; however, BRET biosensors have the potential for rapid, high-throughput readouts as well as time-resolved imaging of cell populations in vitro and in vivo due to their reversible nature, lack of incident light requirement and use of color change ratios as a sensitive reporter irrespective of total light output.
As a biosensor, BRET was first successfully demonstrated from Renilla luciferase (Rluc) to yellow fluorescent protein (YFP).17 A commercial BRET system (BRET2, Perkin Elmer, Wellesley, MA) has since been developed that pairs Rluc, utilizing a highly blue-shifted substrate phenylcoelenterazine (DeepBlueC ®), to a mutant green fluorescent protein (GFP), representing the current state of the art in optical sensors.18 Utilizing this system, Bertrand and co-workers demonstrated both high signal to noise ratios and signal separation of component BRET emissions by measuring the deep blue to green color ratio, although the photon output was much less than the original Rluc-based BRET system. These decreases in output occurred due to the inherent biochemical properties of the substrate as compared to native coelenterazine, including severely depressed light output and decreased solubility in aqueous environments. Of note, phenylcoelenterazine is greater than 10-fold more costly than native coelenterazine and almost 3,000-fold more expensive than D-luciferin on a gram/gram basis. Importantly, BRET2 assays have been limited to lysates or end point assays because of the bursting kinetics and rapid non-linear decrease of bioluminescence emission from Rluc. While esterification of coelenterazines increases assay duration, the advantages of a large Stokes shift and signal separation of the BRET2 system are lost.19 Finally, because these BRET systems measure blue to green color ratios, in vivo imaging is confined to superficial structures due to the strong light absorbance and scattering properties of tissues at these wavelengths.20
To circumvent these problems, utilizing beetle luciferases such as Fluc rather than Renilla or Aequorin luciferases would be advantageous due to the low cost and favorable pharmacokinetics of the substrate, D-luciferin. Early BRET pairs utilizing D-luciferin were coupled to DsRed or organic dyes,21, 22 but these reports did not define signal to noise ratios or the utility of the pairs in living cells. Because DsRed forms tetramers,23 the Fluc-DsRed pair results in a complex platform for detecting protein-protein interactions. Furthermore, it is unclear how tetramerization of DsRed might impact either BRET efficiency or substrate recognition if the pair were to be used as an enzyme biosensor. Another concern is that firefly luciferase shifts its emission spectrum when exposed to different temperatures and ion concentrations.24, 25 Upon increases in temperature, the Fluc emission spectrum will shift to the red and directly overlap with the re-emitted light from DsRed. Thus, shifts in the native bioluminescence emission spectrum could be misconstrued as changes in BRET, eliminating any utility of Fluc as a BRET donor. Thus, there are currently no satisfactory BRET pairs available that utilize D-luciferin-based luciferases as the donor.
Herein, we describe an approach that exploits the advantageous properties of newly-available beetle luciferases and fluorescent proteins which may mitigate shortcomings of current BRET biosensors. Rather than cloning new constructs by trial and error, generation of an empirical BRET equation allowed for accurate prediction of optimal luciferase-fluorophore pairs. A single-chain protease biosensor that utilized D-luciferin as its substrate was designed and constructed based upon the predicted optimal luciferase-fluorophore pairing. The BRET biosensor was constructed with a DEVD linker (caspase-3, -7 consensus sequence) between the thermal-stable donor, click beetle green (CBG), and the optimal acceptor, tdTomato.26 This construct allowed for the facile imaging of executioner caspase activity by detecting changes in BRET efficiency in cellulo. This novel strategy and BRET pair enabled precise, longitudinal studies of protease activity on both short (minutes) and long (days) time scales.
2. Materials and Methods
Detailed methods are available in S5 in the online Supplemental Materials.
2.1. Plasmid construction
Plasmids were constructed by standard TOPO and PCR methods and confirmed by restriction digest. Directionality was reconfirmed by sequencing. The strategies are outlined below and detailed information is contained in the supplemental information.
LuxA fluorophore fusions were constructed in the lux operon from Photorhabdus luminescence found in the pT7-3 plasmid (gift of Edward Meighen). NHE I cloning sites were engineered into the C-terminus of the lux operon by Quickchange kit reactions (Stratagene, La Jolla, CA). Fluorophores were amplified by PCR (Herculase Polymerase, Clontech, Mountain View, CA) from their parental plasmids, and both NHE I sites and linkers were added to each end with primers (IDT, Coralville, IA). Amplified DNA was either cloned directly into the modified lux operon or into a TOPO vector for sequencing and subsequent NHE I restriction and ligation into the modified lux operon. Directionality was confirmed by BsrGI digestions and by sequencing into the C-terminus of LuxA.
Click beetle green 68 luciferase (CBG, Promega) was cloned using PCR with primers of differing linker lengths into a TOPO vector for sequencing. PCR cloning was also used to create increasing linker lengths as well as a DEVD insertion between the CBG and any of three acceptor fluorophores (mRFP1, mPlum, and tdTomato).
The plasmid pCEP4-Rluc-DEVD-eYFP was a gift of Michel Bouvier.27
2.2. Tissue culture
HeLa, HEK 293T, HepG2, MCF7 pBabe, and MCF7 pCASP3 cells were cultured in vented flasks (Fisher Scientific, Pittsburg, PA) in an incubator maintained at 37 °C in a 5% CO2, 20% O2, 75% N2, water saturated atmosphere. HeLa, HEK 293T, and HepG2 cells were cultured in media consisting of DMEM (Invitrogen) supplemented with 10% heat-inactivated calf serum (Washington University Tissue Culture Support Center, St. Louis, MO) and 2 mM L-glutamine (Washington University Tissue Culture Support Center). HeLa imaging media refers to DMEM lacking phenol red (Washington University Tissue Culture Support Center) supplemented with 10% heat-inactivated fetal bovine serum, 2 mM L-glutamine, and 500 μM D-luciferin (Biosynth, Naperville, IL). MCF7 pBabe and MCF7 pCASP3 cells were cultured in RPMI supplemented with 5% fetal bovine serum and 2 mM L-glutamine. MCF7 imaging media refers to RPMI without phenol red (Sigma, St. Louis, MO) supplemented with 5% fetal bovine serum and 500 μM D-luciferin.
Cells were transiently transfected with expression plasmids according to standard protocols utilizing Fugene 6 (Roche, Basel, Switzerland). All DNA utilized in transient transfections was prepared from Hi-Speed maxiprep kits with a final concentration of DNA between 400 to 700 ng/μL (Qiagen). Unless otherwise noted, cells were batch transfected and then plated into the appropriate plate 24 hours before initiation of the study.
2.3. Bioluminescence imaging
Plates of cells or lysates were imaged in an IVIS 100 (Caliper, Cranbury, NJ). The stage temperature was set to 37 °C, and plates were pre-warmed for at least five minutes after being placed into the IVIS 100. Images were acquired with FOV, time, binning, and filtering as indicated and displayed as radiant power (photons/sec/cm2/sr). Regions of interest (ROI) were drawn on the images, quantified using Living Image 2.50 software, and data expressed as photon flux (photons/sec).
2.4. Analysis of LuxA BRET in E. coli
BL21DE3STAR E. coli (Stratagene) were made electro-competent by standard procedures prior to testing BRET constructs in bacteria. Bacteria were electroporated with pLux CDABE (parental lux operon in pT7-3), pLux CDA-mRFP BE, pLux CDA-mCherry BE, pLux CDA-eGFP BE, pLuxA-mPlum BE, and pLux CDA-tdTomato BE, and plated onto 10 cm Luria Broth (LB) plates with ampicillin selection. After overnight growth at 37 °C, plates were imaged with the following settings: FOV, 23 cm; time, 5 sec; binning, 2 × 2 pixels (X × Y); sequential filters: open, <510 nm SP, 540AF20 nm, >590 nm long pass, and >650 nm long pass. Photon fluxes from isolated colonies were quantified by region of interest (ROI) analysis. BRET was calculated by applying the photon fluxes (photons/sec) to Eq. 1.
| Eq. 1 |
Some plates were returned to 4 °C, and imaging was repeated at subsequent time points as indicated.
2.5. Analysis of caspase mediated cleavage of CBG-DEVD-tdTomato in vitro
HEK 293Ts were transiently transfected with pCBG, pCBG-GGSS-tdTomato, or pCBG-DEVD-tdTomato. After 48 hours of transfection, cells were harvested and lysed in Reporter Lysis Buffer (Promega). Samples of cell lystate were added to buffer containing recombinant human caspases (-3, -6, -7, and -9; Calbiochem) and incubated at 37 °C for one hour. Concentrated Mg.ATP and D-luciferin were added at the end of the reaction time to a final concentration of 5 mM and 500 μM, respectively, and plates were imaged in an IVIS 100 with no filter, 540AF20 nm filter, and >590 nm filter. BRET was calculated as per Eq. 2.
| Eq. 2 |
Fluorescence emitted from the wells was quantified on a Kodak 4000MM Imager (Kodak). Caspase inhibitor experiments were performed similarly in the presence of three independent dilutions of Ac-DEVD-CHO (Calbiochem) as indicated.
2.6. Small molecule induction of DEVDase activity in live cells
CBG fusion constructs were transiently transfected into the appropriate cell lines as indicated. Twenty four hours after transfection, cytotoxic agents (e.g., doxorubicin and C6 ceramide) were dissolved in HeLa imaging media to the appropriate concentrations. Media was removed from the cells and replaced with HeLa imaging media, and then cells were imaged at the appropriate times in an IVIS 100. BRET was calculated as in Eq. 2.
HeLa cells were similarly transiently transfected with pCEP4-Rluc-DEVD-eYFP and pCMV-Rluc, exposed to cytotoxic agents, imaged and BRET calculated using Eq. 2, modified for use with the appropriate filters for Renilla and YFP (<510 nm filter and 500–570 nm band pass filter, respectively).
2.7. Statistical methods
Error was propagated through equations using standard methodologies.28 Data were analyzed utilizing GraphPad Prism 4.0. All data sets measuring multiple variables such as time and concentration were analyzed using two-way ANOVA with Bonferonni correction for multiple comparisons, and when possible, samples were tested using two-way ANOVA with repeated measures.
3. Results
3.1. Predicting Optimal Luciferase-Fluorophore Pairs for BRET
BRET phenomena have not been studied as thoroughly as FRET,29 but they share several general properties. In BRET, a luciferase constitutes the energy donor and a fluorophore constitutes the acceptor. When residing in sufficiently close proximity, distance-dependant energy transfer occurs. Empirically, BRET has been calculated as the quotient of light detected within a spectral window (X) centered on the luciferase emission, divided by light detected within a spectral window (Y) centered on the fluorophore emission, minus the quotient of light detected in filters X and Y from the luciferase alone (Eq. 3):17, 30
| Eq. 3 |
Since BRET signals are analogous to FRET, it is likely that BRET signals are proportional to the Förster equation. This relationship, however, has not been applied to BRET nor has it been used for predicting luciferase-fluorophore pairs. Investigators are restricted to empirical determination of the best luciferase-fluorophore pairs for each respective application.31–33
To match optimal luciferase-fluorophore pairs, we derived an equation from first principles for predicting observable relative BRET efficiency. Based upon these predicted efficiencies, one can determine the best fluorophore to pair with a given luciferase.
| Eq. 4 |
The overlap integral from the Förster equation was utilized as the starting point: ξFP × ∫AFP (λ) × ELuc(λ) ×λ4 dλ. AFP(λ) is the absorption spectrum of the fluorescent protein or the excitation spectrum when the absorption spectrum was not available from the public database PubSpectra34. ELuc(λ) is the emission spectrum of the cognate luciferase which was either available from the supplier of the luciferase or collected empirically. ζFP is the molar extinction coefficient of the fluorescent protein found either in the literature or public databases. It was hypothesized that several other terms were required to predict the optimal pair. First, observation of BRET requires the re-emission of a photon from the fluorophore once the energy has been transferred to the fluorophore, so a term for the quantum yield (QFP) of the fluorophore was included. Second, BRET experiments require detection of photons through an optical filter (X) that is red-shifted relative to the maximal emission of the luciferase. The filter is provided with an optical window ranging from a nm to b nm. Therefore, the fraction of light emitted by a fluorophore from a nm to b nm must also be included ( ), where EFP(λ) represents the normalized emission spectrum for the fluorescent protein. Finally, it was assumed that for relative BRET from a given luciferase combined with a monomeric fluorophore, the geometric terms in the Förster equation, κ and r6, would remain constant, and therefore these terms would drop from the equation. Thus, relative observable BRET was calculated using Eq. 4 using an MS Excel file format. (All BRET coefficients calculated for this study are included in supplementary Table S1.)
The validity of the equation was empirically tested by generating fusions to the C-terminus of luxA in the lux operon, an expression cassette that encodes both for a bacterial luciferase and for proteins to produce its cognate substrate. Eq. 4 was able to predict the relative BRET>590 from LuxA fusions with the exception that the BRET>590 of mPlum was consistently overestimated (Figure 1a, R2 = 0.99). To demonstrate that Eq. 4 was generalizable, fluorophores were fused to the C-terminus of click beetle green 68 (CBG), a beetle luciferase biochemically and genetically unrelated to the bacterial luciferase. The measured BRET>590 for CBG fusion constructs was determined in both live cells and cell lysates. Again, Eq. 4 was able to accurately predict the relative observed BRET>590 (Figure 1b, R2 = 0.99). CBG luciferase paired with tdTomato fluorophore produced the highest BRET signal. The robustness of the equation is indicated by the fact that even with two evolutionarily independent luciferases (firefly and bacterial), each with completely different tertiary and quaternary structures (one monomeric, the other heterodimeric), the optimal fluorophore to pair with each luciferase could still be predicted by Eq. 4. Besides characterizing two independently evolved luciferases, dissimilar fluorescent proteins also were utilized in the dataset. The protein sequence identity between eGFP and one half of tdTomato is only 26%, with just under 50% of the sequence conserved between the two. Similar divergence also is observed between mPlum and eGFP. In addition, the underlying chemical structure of the fluorophore in these two fluorescent proteins is different. Thus, given the divergent nature of luciferases and fluorophores tested, this equation appears to be robust for predicting optimal luciferase-fluorophore pairs.
Figure 1.
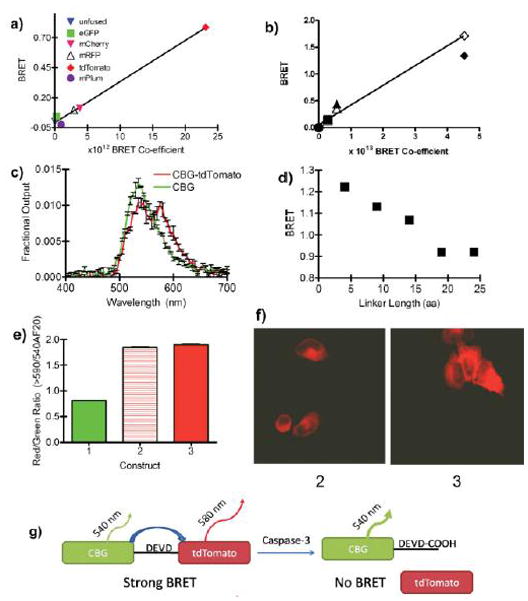
Validation of BRET equations and characterization of BRET biosensors. a) BRET signals (as calculated by Eq. 1) observed from colonies of bacteria expressing luxA fusion proteins [luxA unfused control (blue triangle), luxA-eGFP (green square), luxA-mCherry (pink triangle), luxA-mRFP (open triangle), luxA-tdTomato (red diamond), or luxA-mPlum (purple circle)] are plotted against the relative BRET coefficient (nm4 M−1 cm−1) predicted by Eq. 4. Bacteria were incubated at 4 °C for 4 days to allow for full maturation of the fluorescent proteins. b) BRET signals observed (as calculated by Eq. 3) from HEK293T cells expressing click beetle green (CBG) fusion constructs. BRET signals observed from CBG unfused control (circle), CBG-mPlum (square), CBG-mRFP (triangle), and CBG-tdTomato (diamond) in either live cells (SOLID) or lysates from those same cells incubated for 6 days at 4 °C (OPEN) plotted against the relative BRET co-efficient (nm4 M−1 cm−1) predicted by Eq. 4. Error bars are within symbol size. c) Bioluminescence emission spectra from live HEK293T cells normalized to total emission. d) Determination of the dependence of BRET upon amino acid linker length for CBG-(G/S)n-tdTomato fusions when expressed in live HeLa cells. e) Red/green ratio for CBG (1), CBG-DEVD-tdTomato (2), and CBG-GGSS-tdTomato (3) when expressed in HeLa cells for 24 hours. f) Confocal fluorescence microscopy images (ex: 543 nm; em: 560–615 nm band pass) of HeLa cells were taken 24 hours after transfection with pCBG-DEVD-tdTomato (2) or pCBG-GGSS-tdTomato (3). Autofluorescence background was set to 0 by imaging HeLa cells transfected with pCBG alone. g) Graphical representation of the output of CBG-DEVD-tdTomato single-chain protease biosensor. When tdTomato is fused to CBG, some of the energy from the luciferase is transferred to the tdTomato and re-emitted as photons centered at 580 nm and detected through a long pass filter > 590 nm. Upon caspase-3 activation, the DEVD sequence is cleaved and the tdTomato diffuses away from the luciferase. Subsequently, all of the light is emitted at the peak of the luciferase emission (540 nm). In contrast, the GGSS linker is not cleaved in the presence of active caspase-3, and BRET is maintained. All error bars represent standard error of mean (SEM) with n = 3 for a-e; error bars are within the symbol size for a, b, and d.
Other properties of the CBG-tdTomato pair were consistent with resonance energy transfer. For example, the bioluminescence emission spectra of CBG and the CBG-tdTomato fusion were collected in living cells (Figure 1c). As would be expected from a BRET fusion protein, there was a decrease in emission at 540 nm, the peak of CBG bioluminescence, and an appearance of a peak at 580 nm, the emission peak of tdTomato. The BRET constructs also demonstrate a chain length dependence of BRET signal similar to those seen for flexible linkers between FRET protein pairs, supporting the hypothesis that this represents a resonance energy transfer phenomenon (Figure 1d; see also S2).35
3.2. Effect of Fluorophore Maturation on BRET Signal
Maturation of the fluorophore, a well known limitation of fluorescent proteins36, significantly impacted measured BRET. In rapidly dividing bacteria, such as E. coli growing in liquid culture (~20 min cell division cycle), the fluorophores tested did not have sufficient time to mature (data not shown) as evidenced both by a lack of BRET as well as a lack of observable fluorescence. When plates of E. coli were stored at 4 °C for several days, however, the fluorophore matured, and BRET was detected (see S3). In contrast, when expressed in mammalian cells, BRET was readily detected by 48 hours post transfection, but small increases in BRET could still be observed when cell lysates were allowed to mature for several days at 4 °C (Figure 1b). This incomplete fluorophore maturation must be normalized during experiments by comparison to either a vehicle control, a non-cleavable control BRET pair, or both.
3.3. Monitoring DEVDase Activity with BRET
A single chain biosensor for detecting executioner caspases was designed around the optimal BRET pair, CBG-tdTomato, by inserting a DEVD linker sequence between the luciferase and fluorophore (see S4). Upon caspase-3 mediated cleavage, BRET from this construct should be lost. In contrast, as a control BRET pair, a non-cleavable GGSS linker sequence was inserted between the CBG and tdTomato components. Under steady state conditions, BRET was experimentally observed in untreated cells transfected with the DEVD biosensor as well as the GGSS linked control (Figure 1e). Furthermore, confocal fluorescence microscopy confirmed proper compartmentalization of the biosensor to the cytosol (Figure 1f).
Once confirmed, plasmids encoding CBG, CBG-GGSS-tdTomato, and CBG-DEVD-tdTomato were transfected into HeLa cells that were then treated with increasing concentrations of doxorubicin or C6 ceramide, known inducers of caspase activity and cell death.37,38 Initially, little change in BRET was observed following treatment with doxorubicin (Figure 2a). After 12 hours of doxorubicin treatment, concentration-depended decreases in BRET were readily detectable (Figure 2b). In contrast, BRET signal from the CBG-GGSS-tdTomato control did not decrease and in fact, increased with time at the largest doxorubicin concentrated. This indicated that the decrease in BRET from cells transfected with the DEVD biosensor was due to specific cleavage at the targeted sequence and not elsewhere in the fusion protein.
Figure 2.
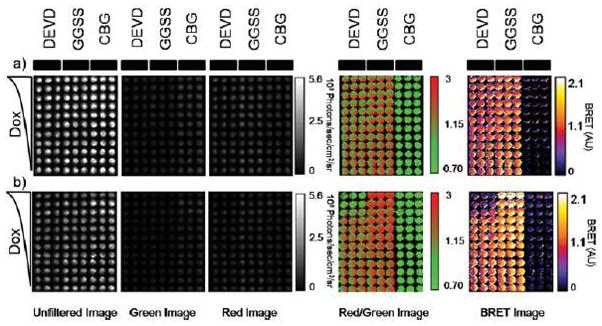
Utilization of single-chain protease BRET biosensor to report on doxorubicin-induced caspase activation. a, b) HeLa cells were transiently transfected with either pCBG-DEVD-tdTomato, pCBG-GGSS-tdTomato, or pCBG alone and then plated into triplicate columns in two black-walled 96-well plates. After 24 hours, decreasing concentrations of doxorubicin, 10 μM to 0 from the top of the plate to the bottom of the plate, were added to the cells and then imaged at 5 time points in an IVIS100. The times displayed are 1.5 hr (a) or 12 hr (b) (peak induction). The displayed images are, from left to right, the average radiance acquired from an unfiltered acquisition, a green filter (540AF20 nm), or a red filter (>590 nm long pass). After thresholding out the detector noise, the ratio of the red filtered image to the green filtered image was calculated and false colored. Finally, a BRET image was calculated by subtracting from each pixel in the red/green ratio imagine the average value of the red/green ratio from CBG wells that were not treated with doxorubicin. Note that images were cropped to remove blank wells to improve clarity and presentation of the figure panel.
Data also were quantified on a per-well basis and plotted to reveal the concentration- and time-dependent change in BRET for HeLa cells treated with either doxorubicin (Figure 3a) or C6 ceramide (Figure 3b). At the peak activation of DEVDase activity by doxorubicin (12 hours), this assay was able to detect changes in BRET with a signal to noise ratio of 33 and a Z′ value (a statistical description of signal variance for high-throughput screening)39 of 0.85.
Figure 3.
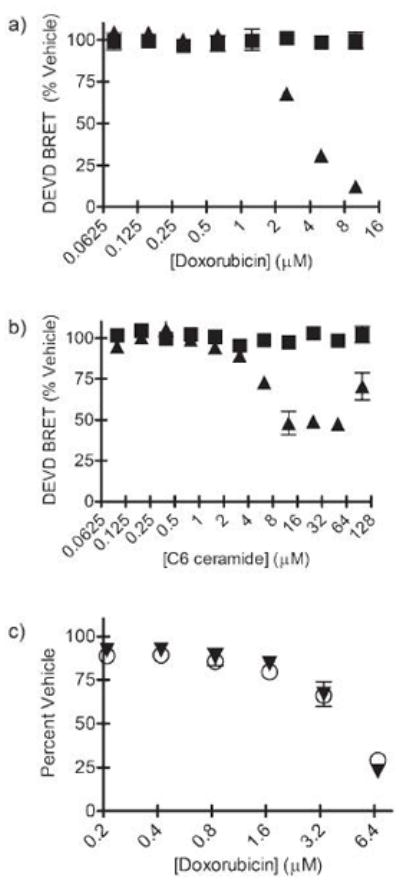
Concentration-response of doxorubicin and C6 ceramide in HeLa cells. a) Quantification of BRET on a well by well basis from the doxorubicin experiment in Fig. 2 at time 1.5 hr (squares) and 12 hr (triangles). Error bars are SEM; n = 3. b) The same experiment as in (a), except the pro-apoptotic agent is C6 ceramide (100 μM to 0). c) In an independent experiment, comparing the BRET at 12 hours (squares) to the cell viability at 24 hr (triangles). Decrease in BRET at 12 hours strongly predicted (R2 = 0.96) cell viability at 24 hr.
The CBG-DEVD-tdTomato assay was compared to standard assays for cell death and caspase activation. When doxorubicin-treated HeLa cells were compared with an MTS assay, a determinant of active cell metabolism and cell viability, the decrease in BRET signal after 12 hrs of doxorubicin correlated strongly (R2 = 0.96; p < 0.001) with cell viability 24 hours post doxorubicin (Figure 3c). Thus, the loss of BRET signal predicted cell death 12 hours in advance. Furthermore, near the LD50 (3.2 μM doxorubicin), there was a spike of luciferase activity. This increase in luciferase activity during apoptosis has been observed previously with multiple inducers of apoptosis and is reported to be caused by increased levels of intracellular ATP during apoptosis, although doxorubicin-mediated stress response on the CMV promoter cannot be ruled out.40 These data validated the hypothesis that the BRET biosensor could detect cells undergoing apoptosis leading to cell death, and indicated that LD50 curves generated from raw bioluminescence data may be right-shifted relative to LD50 curves calculated from other cell death metrics such as MTS assays.
Finally, DEVDase activity was detected by independent methods and correlated with decreases in BRET. Active caspase-3 is thought to be a significant contributor to the DEVDase activity in cells. HeLa cells were treated with doxorubicin in a 24-well plate format, imaged for BRET, and then lysed for further analysis. A concentration-dependent increase in active caspase-3 was detected by immunoblotting as predicted by the BRET signal. When the bands were quantified and normalized either to total protein or to a structural gene (tubulin), active caspase-3 was inversely proportionate to the BRET signal (r = −0.73 or r = −0.82, respectively; p < 0.05) (Figure 4). We obtained a similar inverse correlation when the same lysates were assayed with Ac-DEVD-pNA (a colorimetric readout for active caspase-3; p = 0.11).
Figure 4.
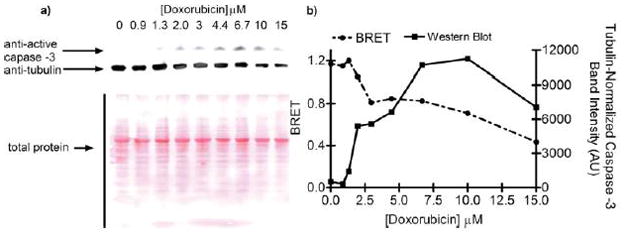
Independent validation of caspase-3 activation. a) HeLa cells were transfected with either pCBG or pCBG-DEVD-tdTomato and plated into 9 wells of a black 24-well plate. After 24 hours, the cells were treated with a gradient of doxorubicin for 24 hours and imaged. BRET from each well was then calculated. Cell lysates were then prepared for SDS-PAGE analysis and immunoblotting. Total protein was determined by Ponceau S staining. Active caspase-3 was determined by probing with anti-active caspase-3 antibody. b) BRET and tubulin-normalized intensity of the active caspase-3 band (p20) are plotted as a function of doxorubicin concentration; the correlation coefficient was r = −0.8, p< 0.05; n = 9.
The specificity of the probe was further tested in cells that do not readily undergo caspase-mediated apoptosis. MCF7 pBabe cells, lacking caspase-3 and stably expressing an empty vector, were transfected with the above constructs. When compared with HeLa cells, there was less chemotherapy-induce loss of BRET (p < 0.001), and this loss of responsiveness was rescued when CBG-DEVD-tdTomato was tested in MCF7 pCASP3, MCF7 cells that stably express procaspase-3 (p < 0.01) (Figure 5a).41 Interestingly, a steady decrease in BRET was observed over time in the MCF7 pBabe control cells, suggesting that DEVDase activity from caspase-7 was still detectable. Furthermore, in 293T cells (Figure 5b), a cell line that is resistant to chemotherapy-induced apoptosis, no decrease in BRET was observed at either 12 or 24 hours, at a concentration of doxorubicin lethal to HeLa cells.42 To demonstrate that the BRET biosensors otherwise functioned in HEK293T cells, active recombinant caspases were added to lysates of 293T cells which contained either control CBG or a BRET biosensor. When incubated with caspase-7 overnight, all BRET was lost from lysates of CBG-DEVD-tdTomato transformed 293T cells. As expected, when active caspase-3, -6, -7, or -9 were added to lysates of either non-cleavable pCBG-GGSS-tdTomato or pCBG transfected cells, no change in BRET was observed. Initial rates of cleavage by the caspases were also experimentally determined in 293T cell lysates (Figure 5c). Importantly, there was no detected decrease in fluorescence from the lysates during these initial rate experiments, and thus, the loss of BRET could not be attributed to fluorophore degradation or changes in fluorophore output. The rank order of caspase cleavage of the CBG-DEVD-tdTomato was 3 > 7 > 6 ≫> 9 as would be predicted for the DEVD consensus sequence.12,13 The decrease in BRET when CBG-DEVD-tdTomato was incubated with caspase-3 was competitively inhibited by Ac-DEVD-CHO, a known reversible inhibitor. Quantification of the titration curve revealed an IC50 of 360 pM (R2 = 0.91; 95% CI = 228 – 579 pM) (Figure 5d) consistent with literature values.43 The inhibition curve was clearly consistent with a single competitive binding site. Collectively, these data indicated that the CBG-DEVD-tdTomato BRET reporter could be used to monitor caspase activity with a specificity similar to other DEVD-based probes.
Figure 5.
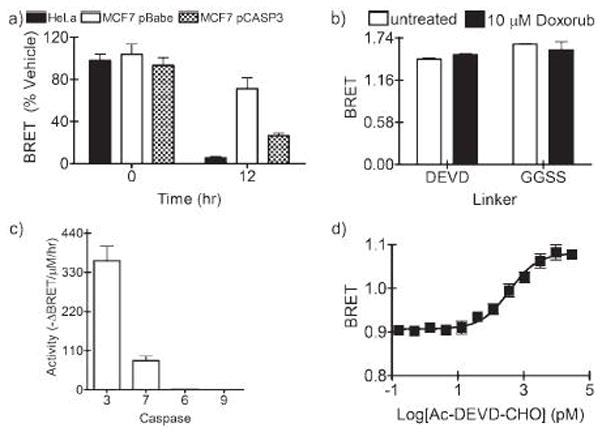
Demonstration of specificity of DEVD BRET biosensor for executioner caspase activity. a) HeLa cells, MCF7 pBabe, and MCF7 pCASP3 cell lines were transiently transfected with pCBG, pCBG-DEVD-tdTomato, or pCBG-GGSS-tdTomato. After 24 hours, 10 μM doxorubicin was added to the cells. Cells were imaged immediately and 12 hours after addition of doxorubicin for calculation of BRET. b) HEK 293T cells were transiently transfected with the three constructs and treated for 24 hours with 10 μM doxorubicin and imaged for BRET. c) HEK 293T cells were transfected with pCBG-DEVD-tdTomato and lysates prepared. Lysates were then treated with caspases-3, -7, -6, or -9 in caspase buffer. After 1 hour, D-luciferin and Mg.ATP were added to the wells, plates imaged, and BRET calculated. From the BRET calculation, initial rates of cleavage were calculated for each enzyme. d) Lysates from HEK293T cells that were transfected with pCBG-DEVD-tdTomato were incubated with active caspase-3 along with various concentrations of the reversible caspase-3 inhibitor Ac-DEVD-CHO. BRET was calculated and displayed as a function of inhibitor concentration (IC50 = 360 pM).
3.4. Monitoring Apoptosis Induced by Bortezomib in HepG2 Cells
To demonstrate the utility of the BRET DEVDase biosensor, we studied the kinetics of caspase-3 activation in a hepatocellular carcinoma line (HepG2). The FDA-approved proteasome inhibitor bortezomib (PS-341, Millenium Pharmaceuticals, Boston, MA), has been shown to be toxic to HepG2 cells and an estimate of the concentration-and time-dependent activation of caspase 3 was previously determined by Western blotting, an expensive and time consuming task.44 While the NF-κB pathway, known to be dependent upon proteasome function, has been shown to be constitutively active in HepG2 cells,45, 46 IKK activity is not constitutively upregulated.46 Therefore, IKK inhibitors, PS-1145 and Bay 11-7085, would be not be predicted to have cytotoxic effects. Experimentally, we also found that bortezomib was toxic to HepG2, while the two IKK inhibitors had no cytotoxic effects (Figure 6a). By utilizing the CBG-DEVD-tdTomato biosensor, concentration- and time-dependent activation of executioner caspases in HepG2 cells was quickly determined (Figure 6b). The power of repetitive imaging of caspase activation in a multi-well plate format was revealed in two ways. First, six cell-based time points, each with eleven concentrations of bortezomib and one vehicle control were collected in triplicate in one experiment. This would have been burdensome by conventional Western blot, FACS analysis or FRET microscopy. Secondly, one can apply two-way ANOVA with repeated measures to tease out the concentration × time affects. This analysis is not possible with traditional immunoblotting techniques because these assays are destructive, and thus, repeated measures cannot be performed. There was, as expected, significant (p < 0.002) effect of bortezomib, time, and a bortezomib × time interaction on the BRET signal in HepG2 cells. By 38 hours, one could detect a significant decrease (p < 0.001) for all concentrations of bortezomib greater than 0.061 nM. However, by 57 hours, those cells that remained alive near the LD50 have significantly increased BRET, indicating little to no activity of executioner caspases. Perhaps this represents a resistant subpopulation of HepG2 cells, or the surviving cells have started to actively divide. Analysis indicated that the ability to use repeated measures significantly (p = 0.0001) increased the sensitivity of the assay. This demonstrated the power of utilizing a D-luciferin-based protease biosensor that can be imaged repetitively over both short (minutes) and long (days) times to more fully characterize the pharmacological response of compounds in living cells.
Figure 6.
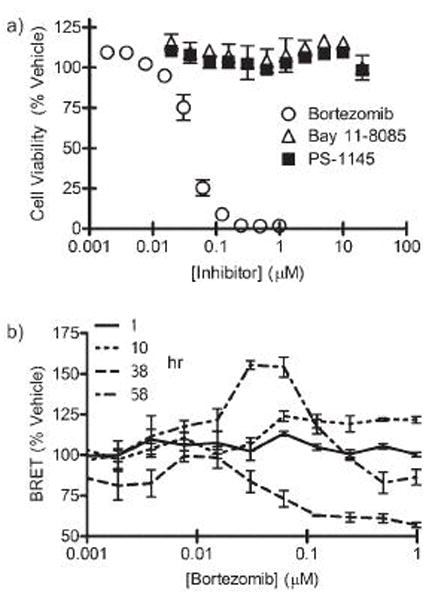
Utilizing the BRET protease biosensor to characterize executioner caspase induction in HepG2. HepG2 cells were transiently transfected with pCBG-DEVD-tdTomato or pCBG. After 24 hours, cells were treated with various concentrations of bortezomib (open circle), Bay 11-7085 (open triangle), or PS-1145 (filled square). Cells were then periodically imaged up to 82 hours after addition of drug. a) Media was removed and cell viability was assessed by the MTS assay. b) Caspase-mediated change in BRET was calculated at various times and concentrations of treatment with bortezomib.
4. Discussion
Given the continued generation and discovery of new flourophores and luciferases, it is important to discover rational methodologies for designing novel BRET protease biosensors.47 Herein we derived Eq. 4 to guide the discovery process. By utilizing published spectra and biochemical properties, Eq. 4 enabled the selection of the optimal fluorophore to pair with a given luciferase. An important caveat to the analysis became apparent, i.e., the R2 of the overall best fit of the actual BRET signal to the predicted BRET was strongly influenced by the tdTomato biosensor data point (Figure 1a). Unfortunately, none of the other monomeric fluorescent protein pairs available in pubspectra databases were predicted to be of intermediate value for use with either LuxA or CBG. Nonetheless, the equation performed well, readily predicting the optimal fluorophore to pair with a given luciferase as well as the correct rank order with the exception of mPlum when paired with the bacterial luciferase from the lux operon. Our studies also indicated that one should choose a linker length that is as short as can be allowed by available cloning strategies or consensus sequences to maintain maximal change in BRET signal upon protease cleavage. Because BRET is proportional to 1/r6, it is important to keep the fluorescent protein as close to the active site of the luciferase as possible.
4.1. Validation of DEVD Single Chain Biosensor
To illustrate the general utility of a D-luciferin-based BRET biosensor, CBG and tdTomato were linked by the sequence DEVD. This sequence was chosen both because DEVD-based biosensors have been well-studied as imaging substrates for executioner caspase activity and because new apoptosis biosensors are still desirable. Our BRET biosensor readily detected caspase activity in vitro. Caspases-3 and -7 strongly activated the biosensor, caspase-6 weakly activated the biosensor, and the initiator caspase, caspase-9, could not activate the biosensor. Specificity was further confirmed by complete inhibition of caspase-3-mediated cleavage by DEVD-CHO, a known reversible inhibitor of caspase-3. Finally, specificity was confirmed in live cells by lack of response in cell lines that do not readily undergo apoptosis such as 293T and MCF7 cells.
Many sensors of caspase activity or phosphatidyl serine externalization require a second probe to confirm general membrane integrity, but our BRET biosensor does not. Since CBG luciferase requires ATP, the luciferase will cease to emit light once a cell dies or loses membrane integrity.48 Thus, in dead cells the reporter will be optically silent, and therefore, no counter stain is required to test for necrosis or membrane integrity. Only in live cells or in cells undergoing apoptosis will the reporter be visible and report on the state of executioner caspase activity. The utility of the CBG-DEVD-tdTomato biosensor was demonstrated by full characterization of the HepG2 response to multiple concentrations of bortezomib in a single experiment. This study concurred with previous findings, but avoided laborious, time-consuming, and expensive Western blot analysis and quantification.
4.2. Direct Comparison of CBG BRET Biosensors to Renilla BRET Biosensors
Use of the CBG-tdTomato BRET pair as a general protease biosensor may provide selected advantages over other reporters. Importantly, these assays were performed with: a) transient transfection, b) live cells, and c) in a 96-well plate format. Due to variations in transfection efficiency and cell proliferation, stable cell lines often need to be generated when utilizing other genetically-encoded reporters. Because BRET quantification depended solely on ratiometric analysis, not on absolute photon output, generating stable cell lines was not required for collecting high quality data, thereby saving significant time and eliminating artifacts from clonal selection. This is a potential advantage of all BRET systems, including the previously published BRET systems that utilize coelenterazine as a substrate.
The construct described in this manuscript represents a significant departure from Renilla-based luciferases due to simultaneous gains in the precision of the assay and in the simplicity of the experimental protocol. Note that the absolute value of BRET from any system is dependent not only upon the factors discussed earlier, but also upon the choice of optical filters used to interrogate the signal. Since, the filter sets for a Renilla BRET pair and a CBG-tdTomato BRET pair cannot be the same, direct comparison of their dynamic ranges is not possible. Instead, we focus on comparative S/N and Z′ values that account for dynamic range relative to the noise in the system. This allows for a fair comparison across multiple platforms. As indicated in the results section, the CBG-tdTomato BRET biosensor showed a highly sensitivity S/N of ~33 and was well suited for high-throughput screening assays with a Z′ value of 0.85. In Table 1, the dynamic range, S/N, and Z′ values of our CBG-tdTomato construct were compared with values of the various Renilla-based BRET systems as derived from the literature. Given the best efforts of each investigative group, the CBG-tdTomato BRET reporter yielded highly favorable S/N and Z′ values. In addition, by inspection of the Z′ values, only the CBG-tdTomato construct would be particularly useful in high-throughput screening applications. One possibility is that the gain in S/N or Z′ is inherent to either the cell lines or instrumentation utilized in this report. Thus, Renilla-DEVD-eYFP (BRET1) was graciously provided to us to allow us to test this hypothesis. Indeed, our experimental design changed the observed S/N and Z′ values of the Renilla-DEVD-eYFP pair compared to prior literature values (Table 1). Nonetheless, even when compared directly within the same experimental design, the S/N and Z′ values from the CBG-tdTomato construct were greater than those of the BRET1 system. Again, when compared head-to-head, only the CBG-tdTomato BRET construct was suitable for high-throughput screening applications as indicated by the Z′ value.
Table 1.
Mean BRET values in fused and unfused states, number of observations (n), standard deviation (S.D.), S/N, and Z′ were calculated both from literature values as well as from constructs tested in this work. The calculated fold-gain in S/N with the CBG-tdTomato system relative to published BRET systems is shown (minimally 3.7-fold enhanced S/N over other systems); the CBG-tdTomato system is most suitable for high-throughput screening (highest Z′).
Comparative BRET values.
| System | Mean BRET Fused (Associated) | Mean BRET Unfused (Dissociated) | n | S.D. Fused | S.D. Unfused | S/N | Z′ | Fold-gain in S/N with CBG-tdTomato | Source (ref) |
|---|---|---|---|---|---|---|---|---|---|
| BRET2 | 0.35 | 0.05 | 5 | 0.03 | 0.06 | 8.94 | 0.11 | 3.73 | 16 |
| BRET1 | 0.45 | 0.35 | 4 | 0.02 | 0.03 | 6.67 | −0.45 | 5.01 | 27 |
| BRET1* | 83.25 | 5.00 | 3 | 8.66 | 4.33 | 9.04 | 0.50 | 3.69 | 50 |
| eBRET1 | 0.23 | −0.03 | 3 | 0.04 | 0.02 | 6.00 | 0.30 | 5.56 | 19 |
| BRET1 | 0.36 | 0.21 | 3 | 0.03 | 0.04 | 4.59 | −0.46 | 7.3 | This work |
| CBG-tdTomato | 1.07 | 0.13 | 3 | 0.03 | 0.02 | 33.38 | 0.85 | - | This work |
Another advance lies in the simplicity of collecting longitudinal data from the CBG-tdTomato BRET system. Critically, D-luciferin-based biosensors enable assays in live cells on time scales spanning from minutes to days within a single assay. BRET2 systems are only compatible with short-term lysate assays. Thus, for each time point in a BRET2 assay, a set of nine wells must be included, three wells for unfused Renilla luciferase, three for fused Renilla luciferase but vehicle treatment, and three for fused Renilla luciferase and experimental treatment. eBRET, which utilizes an esterified coelenterazine, allows for longitudinal assays, but loses the Stokes shift-mediated signal separation offered by BRET2.19 By comparison, for the doxorubicin assay indicated in Figure 3a, only 72 wells were required for the CBG-based system, although a total of 108 wells were utilized for also studying effects on the CBG-GGSS-tdTomato control. For a similar BRET2 assay, 360 wells would be required, and if a GGSS control was included, 540 wells would be required. Because a BRET2 assay would not be a longitudinal study, ANOVA analysis with repeated measures also would not be possible. The eBRET systems eliminate this problem, but as indicated above, they do not appear to be as sensitive as the CBG-tdTomato BRET biosensor. The bursting kinetics of enzymes utilizing coelenterazine require careful timing of substrate addition and image acquisition. In contrast to BRET1, with CBG-tdTomato, substrate can be added once at the beginning of an assay and then imaged days later with no media changes and with little dependence of the signal on image acquisition timing. Finally, D-luciferin sodium salt is water soluble, thus avoiding the need for solvents, such as ethanol, methanol, or DMSO, thereby increasing the reproducibility of assays and eliminating the chance of solvent-related artifacts. Thus, the CBG-tdTomato biosensor may enable a wide variety of applications that are currently not approachable by conventional BRET systems.
4.3. Limitations
There are, however, disadvantages to this and other BRET biosensors relating to the color of the emission and the maturation of the fluorescent proteins. In vivo imaging in mice and other small animals is a standard practice in molecular imaging.49 While Rluc-based BRET has been putatively observed in vivo,20 this remains debated and, nonetheless, its utility is severely limited by the strong absorption and scattering of photons in the blue region. While the CBG-tdTomato fusion emits photons in the red (>600 nm), the BRET signal is still dependent on measuring green photons (540 nm). While we were able to detect true BRET in vivo from deep tissues such as liver (data not shown), the detected green signal is not only dependent on BRET efficiency, but also on local hemoglobin concentration and source depth.24 This complicates the interpretation of in vivo BRET signals from this or any other colorimetric reporter that is currently available. Thus, utilizing our biosensor construct in deep tissue in vivo should be pursued with caution. Another caveat is that the tdTomato fluorophore is not fully matured after 24 hours in mammalian cells. Signal variability arising from the slow maturation can be normalized either to an untreated well of CBG-DEVD-tdTomato, or to a well where the linker sequence is mutated to a sequence not cleavable by the protease, such as GGSS. Use of more rapidly maturing fluorescence proteins will minimize this minor artifact in the future.
5. Conclusions
The BRET technology described herein should not only significantly advance the field of BRET biosensors, but also should advance protease biosensors in general, especially for live cell assays. Our theory and rational methodology for designing BRET pairs is generalizable, potentially eliminating the need to generate random combinations of luciferases and fluorophores. Since new fluorophores and luciferases are constantly being designed and discovered, this time savings should impact the pace of discovery. Furthermore, the precision of the CBG-DEVD-tdTomato biosensor for monitoring executioner caspase activity will aid in high-throughput screening for both activators and inhibitors of caspases, depending on the desired therapeutic effects. While we have highlighted a target sequence for executioner caspases in the linker, this construct should be amenable to sequence substitution for many well-validated, clinically relevant, and biochemically interesting intracellular proteases.
Acknowledgments
We would like to thank Dr. Roger Tsien, Dr. Edward Meighen, and Dr. Michel Bouvier for graciously supplying plasmids. We also thank Dr. John Pink for supplying MCF7 pCASP3 and MCF7 pBabe stable cell lines. Finally, we thank Dr. Tim West for immunoblotting for active caspase 3. This work was supported by NIH P50 CA94056.
Footnotes
Author Contributions
ST Gammon wrote and edited the manuscript, performed half of the experimentation, and spearheaded data analysis. V Villalobos performed half of the experimentation. M Roshal helped design and analyze LuxA-fluorophore fusion proteins. M Samrakandi performed the Renilla-DEVD-eYFP experiments. D Piwnica-Worms guided the project, analyzed data, and edited the manuscript.
References
- 1.Carragher NO. Calpain inhibition: a therapeutic strategy targeting multiple disease states. Curr Pharm Des. 2006;12(5):615–38. doi: 10.2174/138161206775474314. [DOI] [PubMed] [Google Scholar]
- 2.Meng XW, Lee SH, Kaufmann SH. Apoptosis in the treatment of cancer: a promise kept? Curr Opin Cell Biol. 2006;18(6):668–76. doi: 10.1016/j.ceb.2006.10.008. [DOI] [PubMed] [Google Scholar]
- 3.Budd RC. Activation-induced cell death. Curr Opin Immunol. 2001;13(3):356–62. doi: 10.1016/s0952-7915(00)00227-2. [DOI] [PubMed] [Google Scholar]
- 4.Bates SM, Weitz JI. The status of new anticoagulants. Br J Haematol. 2006;134(1):3–19. doi: 10.1111/j.1365-2141.2006.06134.x. [DOI] [PubMed] [Google Scholar]
- 5.Fingleton B. Matrix metalloproteinases as valid clinical targets. Curr Pharm Des. 2007;13(3):333–46. doi: 10.2174/138161207779313551. [DOI] [PubMed] [Google Scholar]
- 6.Hsu JT, Wang HC, Chen GW, Shih SR. Antiviral drug discovery targeting to viral proteases. Curr Pharm Des. 2006;12(11):1301–14. doi: 10.2174/138161206776361110. [DOI] [PubMed] [Google Scholar]
- 7.Rossetto O, de Bernard M, Pellizzari R, Vitale G, Caccin P, Schiavo G, Montecucco C. Bacterial toxins with intracellular protease activity. Clin Chim Acta. 2000;291(2):189–99. doi: 10.1016/s0009-8981(99)00228-4. [DOI] [PubMed] [Google Scholar]
- 8.Timmer JC, Salvesen GS. Caspase substrates. Cell Death Differ. 2007;14(1):66–72. doi: 10.1038/sj.cdd.4402059. [DOI] [PubMed] [Google Scholar]
- 9.Cuerrier D, Moldoveanu T, Davies PL. Determination of peptide substrate specificity for mu-calpain by a peptide library-based approach: the importance of primed side interactions. J Biol Chem. 2005;280(49):40632–41. doi: 10.1074/jbc.M506870200. [DOI] [PubMed] [Google Scholar]
- 10.Dutta S, Chiu YC, Probert AW, Wang KK. Selective release of calpain produced alphalI-spectrin (alpha-fodrin) breakdown products by acute neuronal cell death. Biol Chem. 2002;383(5):785–91. doi: 10.1515/BC.2002.082. [DOI] [PubMed] [Google Scholar]
- 11.Belloc F, Belaud-Rotureau MA, Lavignolle V, Bascans E, Braz-Pereira E, Durrieu F, Lacombe F. Flow cytometry detection of caspase 3 activation in preapoptotic leukemic cells. Cytometry. 2000;40(2):151–60. doi: 10.1002/(sici)1097-0320(20000601)40:2<151::aid-cyto9>3.0.co;2-9. [DOI] [PubMed] [Google Scholar]
- 12.Bullok KE, Maxwell D, Kesarwala AH, Gammon S, Prior JL, Snow M, Stanley S, Piwnica-Worms D. Biochemical and in vivo characterization of a small, membrane-permeant, caspase-activatable far-red fluorescent peptide for imaging apoptosis. Biochemistry. 2007;46:4055–4065. doi: 10.1021/bi061959n. [DOI] [PubMed] [Google Scholar]
- 13.Thornberry NA, Rano TA, Peterson EP, Rasperi DM, Timkey T, Garcia-Calvo M, Houtzageri VM, Nordstromi PA, Royi S, Vaillancourti JP, Chapman KT, Nicholsoni DW. A combinatorial approach defines specificities of members of the caspase family and granzyme B: functional relationships established for key mediators of apoptosis. J Biol Chem. 1997;272(29):17907–17911. doi: 10.1074/jbc.272.29.17907. [DOI] [PubMed] [Google Scholar]
- 14.Jiang T, Olson E, Nguyen Q, Roy M, Jennings P, Tsien R. Tumor imaging by means of proteolytic activation of cell-penetrating peptides. Proc Nat’l Acad Sci USA. 2004;101:17867–17872. doi: 10.1073/pnas.0408191101. [DOI] [PMC free article] [PubMed] [Google Scholar]
- 15.Ward MW, Rehm M, Duessmann H, Kacmar S, Concannon CG, Prehn JH. Real time single cell analysis of Bid cleavage and Bid translocation during caspase-dependent and neuronal caspase-independent apoptosis. J Biol Chem. 2006;281(9):5837–44. doi: 10.1074/jbc.M511562200. [DOI] [PubMed] [Google Scholar]
- 16.Hu K, Clement JF, Abrahamyan L, Strebel K, Bouvier M, Kleiman L, Mouland AJ. A human immunodeficiency virus type 1 protease biosensor assay using bioluminescence resonance energy transfer. J Virol Methods. 2005;128(1–2):93–103. doi: 10.1016/j.jviromet.2005.04.012. [DOI] [PMC free article] [PubMed] [Google Scholar]
- 17.Xu Y, Piston DW, Johnson CH. A bioluminescence resonance energy transfer (BRET) system: application to interacting circadian clock proteins. Proc Natl Acad Sci U S A. 1999;96(1):151–6. doi: 10.1073/pnas.96.1.151. [DOI] [PMC free article] [PubMed] [Google Scholar]
- 18.Bertrand L, Parent S, Caron M, Legault M, Joly E, Angers S, Bouvier M, Brown M, Houle B, Menard L. The BRET2/arrestin assay in stable recombinant cells: a platform to screen for compounds that interact with G protein-coupled receptors (GPCRS) J Recept Signal Transduct Res. 2002;22(1–4):533–41. doi: 10.1081/rrs-120014619. [DOI] [PubMed] [Google Scholar]
- 19.Pfleger KD, Dromey JR, Dalrymple MB, Lim EM, Thomas WG, Eidne KA. Extended bioluminescence resonance energy transfer (eBRET) for monitoring prolonged protein-protein interactions in live cells. Cell Signal. 2006;18(10):1664–70. doi: 10.1016/j.cellsig.2006.01.004. [DOI] [PubMed] [Google Scholar]
- 20.De A, Gambhir SS. Noninvasive imaging of protein-protein interactions from live cells and living subjects using bioluminescence resonance energy transfer. FASEB J. 2005;19(14):2017–9. doi: 10.1096/fj.05-4628fje. [DOI] [PubMed] [Google Scholar]
- 21.Arai R, Nakagawa H, Kitayama A, Ueda H, Nagamune T. Detection of protein-protein interaction by bioluminescence resonance energy transfer from firefly luciferase to red fluorescent protein. J Biosci Bioeng. 2002;94(4):362–4. doi: 10.1263/jbb.94.362. [DOI] [PubMed] [Google Scholar]
- 22.Arai R, Nakagawa H, Tsumoto K, Mahoney W, Kumagai I, Ueda H, Nagamune T. Demonstration of a homogeneous noncompetitive immunoassay based on bioluminescence resonance energy transfer. Anal Biochem. 2001;289(1):77–81. doi: 10.1006/abio.2000.4924. [DOI] [PubMed] [Google Scholar]
- 23.Baird GS, Zacharias DA, Tsien RY. Biochemistry, mutagenesis, and oligomerization of DsRed, a red fluorescent protein from coral. Proc Natl Acad Sci U S A. 2000;97(22):11984–9. doi: 10.1073/pnas.97.22.11984. [DOI] [PMC free article] [PubMed] [Google Scholar]
- 24.Zhao H, Doyle TC, Coquoz O, Kalish F, Rice BW, Contag CH. Emission spectra of bioluminescent reporters and interaction with mammalian tissue determine the sensitivity of detection in vivo. J Biomed Opt. 2005;10(4):41210. doi: 10.1117/1.2032388. [DOI] [PubMed] [Google Scholar]
- 25.Seliger H, McElroy W. The colors of firefly bioluminescence: enzyme configuration and species specificity. Proc Nat’l Acad Sci USA. 1964;52(1):75–81. doi: 10.1073/pnas.52.1.75. [DOI] [PMC free article] [PubMed] [Google Scholar]
- 26.Shaner NC, Campbell RE, Steinbach PA, Giepmans BN, Palmer AE, Tsien RY. Improved monomeric red, orange and yellow fluorescent proteins derived from Discosoma sp. red fluorescent protein. Nat Biotechnol. 2004;22(12):1567–1572. doi: 10.1038/nbt1037. [DOI] [PubMed] [Google Scholar]
- 27.Angers S, Salahpour A, Joly E, Hilairet S, Chelsky D, Dennis M, Bouvier M. Detection of beta 2-adrenergic receptor dimerization in living cells using bioluminescence resonance energy transfer (BRET) Proc Natl Acad Sci U S A. 2000;97(7):3684–9. doi: 10.1073/pnas.060590697. [DOI] [PMC free article] [PubMed] [Google Scholar]
- 28.Bevington PR, Robinson DK. Data Reduction and Error Analysis for the Physical Sciences. McGraw-Hill Science/Engineering/Math; Jul 23, 2002. [Google Scholar]
- 29.Jares-Erijman EA, Jovin TM. FRET imaging. Nat Biotechnol. 2003;21(11):1387–95. doi: 10.1038/nbt896. [DOI] [PubMed] [Google Scholar]
- 30.Ramsay D, Kellett E, McVey M, Rees S, Milligan G. Homo- and hetero-oligomeric interactions between G-protein-coupled receptors in living cells monitored by two variants of bioluminescence resonance energy transfer (BRET): hetero-oligomers between receptor subtypes form more efficiently than between less closely related sequences. Biochem J. 2002;365(Pt 2):429–40. doi: 10.1042/BJ20020251. [DOI] [PMC free article] [PubMed] [Google Scholar]
- 31.Boute N, Jockers R, Issad T. The use of resonance energy transfer in high-throughput screening: BRET versus FRET. Trends Pharmacol Sci. 2002;23(8):351–4. doi: 10.1016/s0165-6147(02)02062-x. [DOI] [PubMed] [Google Scholar]
- 32.Pfleger KD, Eidne KA. Illuminating insights into protein-protein interactions using bioluminescence resonance energy transfer (BRET) Nat Methods. 2006;3(3):165–74. doi: 10.1038/nmeth841. [DOI] [PubMed] [Google Scholar]
- 33.Curie T, Rogers KL, Colasante C, Brulet P. Red-shifted aequorin-based bioluminescent reporters for in vivo imaging of ca(2+) signaling. Mol Imaging. 2007;6(1):30–42. [PubMed] [Google Scholar]
- 34.McNamara G, Gupta A, Reynaert J, Coates TD, Boswell C. Spectral imaging microscopy web sites and data. Cytometry A. 2006;69(8):863–71. doi: 10.1002/cyto.a.20304. [DOI] [PubMed] [Google Scholar]
- 35.Evers TH, van Dongen EM, Faesen AC, Meijer EW, Merkx M. Quantitative understanding of the energy transfer between fluorescent proteins connected via flexible peptide linkers. Biochemistry. 2006;45(44):13183–92. doi: 10.1021/bi061288t. [DOI] [PubMed] [Google Scholar]
- 36.Bevis BJ, Glick BS. Rapidly maturing variants of the Discosoma red fluorescent protein (DsRed) Nat Biotechnol. 2002;20(1):83–7. doi: 10.1038/nbt0102-83. [DOI] [PubMed] [Google Scholar]
- 37.Lambert JC, Wang GW, Kang YJ. Zinc inhibition of caspase-3 activation does not protect HeLa cells from apoptotic cell death. Toxicol Appl Pharmacol. 2001;175(1):89–93. doi: 10.1006/taap.2001.9239. [DOI] [PubMed] [Google Scholar]
- 38.Pinton P, Ferrari D, Rapizzi E, Di Virgilio F, Pozzan T, Rizzuto R. The Ca2+ concentration of the endoplasmic reticulum is a key determinant of ceramide-induced apoptosis: significance for the molecular mechanism of Bcl-2 action. Embo J. 2001;20(11):2690–701. doi: 10.1093/emboj/20.11.2690. [DOI] [PMC free article] [PubMed] [Google Scholar]
- 39.Zhang JH, Chung TD, Oldenburg KR. A simple statistical parameter for use in evaluation and validation of high throughput screening assays. J Biomol Screen. 1999;4(2):67–73. doi: 10.1177/108705719900400206. [DOI] [PubMed] [Google Scholar]
- 40.Zamaraeva MV, Sabirov RZ, Maeno E, Ando-Akatsuka Y, Bessonova SV, Okada Y. Cells die with increased cytosolic ATP during apoptosis: a bioluminescence study with intracellular luciferase. Cell Death Differ. 2005;12(11):1390–7. doi: 10.1038/sj.cdd.4401661. [DOI] [PubMed] [Google Scholar]
- 41.Pink JJ, Wuerzberger-Davis S, Tagliarino C, Planchon SM, Yang X, Froelich CJ, Boothman DA. Activation of a cysteine protease in MCF-7 and T47D breast cancer cells during beta-lapachone-mediated apoptosis. Exp Cell Res. 2000;255(2):144–55. doi: 10.1006/excr.1999.4790. [DOI] [PubMed] [Google Scholar]
- 42.Albayrak T, Scherhammer V, Schoenfeld N, Braziulis E, Mund T, Bauer MK, Scheffler IE, Grimm S. The tumor suppressor cybL, a component of the respiratory chain, mediates apoptosis induction. Mol Biol Cell. 2003;14(8):3082–96. doi: 10.1091/mbc.E02-10-0631. [DOI] [PMC free article] [PubMed] [Google Scholar]
- 43.Nicholson DW, Ali A, Thornberry NA, Vaillancourt JP, Ding CK, Gallant M, Gareau Y, Griffin PR, Labelle M, Lazebnik YA, et al. Identification and inhibition of the ICE/CED-3 protease necessary for mammalian apoptosis. Nature. 1995;376(6535):37–43. doi: 10.1038/376037a0. [DOI] [PubMed] [Google Scholar]
- 44.Calvaruso G, Giuliano M, Portanova P, De Blasio A, Vento R, Tesoriere G. Bortezomib induces in HepG2 cells IkappaBalpha degradation mediated by caspase-8. Mol Cell Biochem. 2006;287(1–2):13–9. doi: 10.1007/s11010-005-9016-3. [DOI] [PubMed] [Google Scholar]
- 45.Betts JC, Cheshire JK, Akira S, Kishimoto T, Woo P. The role of NF-kappa B and NF-IL6 transactivating factors in the synergistic activation of human serum amyloid A gene expression by interleukin-1 and interleukin-6. J Biol Chem. 1993;268(34):25624–31. [PubMed] [Google Scholar]
- 46.Park SG, Lee T, Kang HY, Park K, Cho KH, Jung G. The influence of the signal dynamics of activated form of IKK on NF-kappaB and anti-apoptotic gene expressions: a systems biology approach. FEBS Lett. 2006;580(3):822–30. doi: 10.1016/j.febslet.2006.01.004. [DOI] [PubMed] [Google Scholar]
- 47.Shaner NC, Steinbach PA, Tsien RY. A guide to choosing fluorescent proteins. Nat Meth. 2005;2(12):905–909. doi: 10.1038/nmeth819. [DOI] [PubMed] [Google Scholar]
- 48.Sala-Newby GB, Taylor KM, Badminton MN, Rembold CM, Campbell AK. Imaging bioluminescent indicators shows Ca2+ and ATP permeability thresholds in live cells attacked by complement. Immunology. 1998;93(4):601–9. doi: 10.1046/j.1365-2567.1998.00004.x. [DOI] [PMC free article] [PubMed] [Google Scholar]
- 49.Gross S, Piwnica-Worms D. Spying on cancer: molecular imaging in vivo with genetically encoded reporters. Cancer Cell. 2005;7(1):5–15. doi: 10.1016/j.ccr.2004.12.011. [DOI] [PubMed] [Google Scholar]
- 50.Ayoub MA, Maurel D, Binet V, Fink M, Prezeau L, Ansanay H, Pin JP. Real-time analysis of agonist-induced activation of protease-activated receptor 1/Galphai1 protein complex measured by bioluminescence resonance energy transfer in living cells. Mol Pharmacol. 2007;71(5):1329–40. doi: 10.1124/mol.106.030304. [DOI] [PubMed] [Google Scholar]