Aptamers are nucleic acid ligands that bind with high affinity to their target molecules and have been shown to be particularly useful for the detection of protein analytes.[1,2] As a result of their high selectivity, stability, target versatility, and convenient regeneration and modification, aptamers hold great promise for various diagnostic applications. Coupling the attractive properties of aptamers with the distinct advantages of bioelectronic transducers has received considerable recent attention.[3,4] Electrochemistry offers innovative routes for interfacing aptamer interactions with the signal-generating element and for obtaining protein diagnostics in a simple, fast, and inexpensive manner. Modern electronic aptamer biosensors commonly rely on enzyme tracers, redox tags with conformational changes, or impedance detection to offer convenient measurements of nanomolar concentrations of target proteins.[3–6] Further enhancement of the sensitivity of such devices is urgently needed for measuring ultralow levels of disease markers or infectious agents. Recent efforts to improve the sensitivity of aptamer-based biosensors and bioassays have lowered their detection limits to the picomolar level through the use of nanoparticle tags,[7] binding-induced conformational changes,[8] and label-free impedance detection.[9]
Here we describe a new label-free bioelectronic strategy for measuring target proteins down to the femtomolar (fM) level. This protocol is based on the ultrasensitive electrochemical measurement of a guanine-rich secondary aptamer, with or without amplification by the polymerase chain reaction (PCR). The bioelectronic detection of purine bases, in particular adsorptive chronopotentiometric measurements of guanine bases,[10] has been shown to be extremely useful for the sensitive monitoring of DNA hybridization[11] and of antibody-recognition events.[12] While PCR amplification has been used for amplifying protein detection in immuno-PCR protocols,[13] the similar amplification of aptamer recognition events has rarely been reported.[14] Coupling the intrinsic electroactivity and PCR amplification of the secondary thrombin-binding aptamer is shown below to dramatically lower the detection limits of electronic aptamer biosensors.
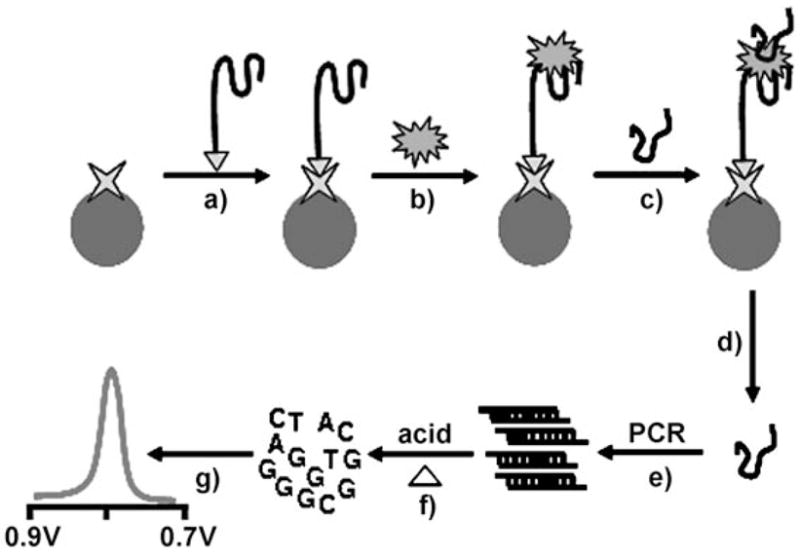
The new bioelectronic protocol (Figure 1) involves a sandwich assay based on the selective binding of the thrombin analyte by the aptamer-functionalized magnetic beads (step b), followed by binding of a secondary thrombin-binding aptamer (TBA-2) to the captured thrombin (step c), and a release of this secondary aptamer under acidic conditions (step d). Next, a PCR amplification of TBA-2 is carried out (step e), followed by purification and acidic depurination of the amplified product (step f), and adsorptive stripping measurements of the free guanine bases at a graphite electrode (step g). The two aptamers bind the target protein at two different sites in a manner analogous to the enzyme-based sandwich aptamer assay of Mascini and co-workers.[5] The secondary aptamer was designed to retain the specific thrombin binding while providing numerous guanine bases essential for the electronic detection and the necessary length for PCR amplification. This was accomplished by extending the 5′ end of the original 29-mer thrombin-binding aptamer with a 21-mer G/C-rich sequence (42% G and 24% C) for PCR primer annealing. After PCR amplification, the guanine-rich DNA product was analyzed by electronic detection. The resulting amplification strategy results in a sensitivity that is approximately four orders of magnitude greater than that observed without the PCR step, hence lowering the detection limits to the femtomolar level.
Figure 1.

PCR-amplified label-free electronic detection of thrombin. A) Binding of the biotinylated primary thrombin aptamer 1 (TBA-1) to the streptavidin-coated magnetic beads. B) Capture of the thrombin analyte. C) Binding of the secondary thrombin-binding aptamer 2 (TBA-2). D) Release of the TBA-2 under acidic conditions. E) PCR amplification of TBA-2. F) Depurination of the amplified product under acidic conditions. G) Electrochemical detection of acid-generated guanine nucleobases.
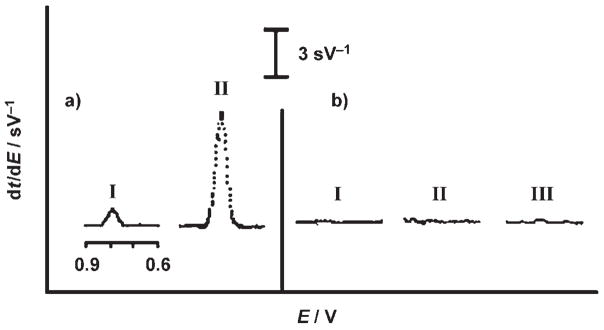
Figure 2a compares the stripping chronopotentiograms for thrombin at 1 μg mL−1 (27 nM, I) and 1 ng mL−1 (27 pM, II) which were obtained by measuring the secondary aptamer TBA-2 without and with PCR amplification, respectively. Well-defined guanine oxidation peaks are observed in both cases. Despite the substantially (1000-fold) lower concentration, the amplified scheme displays a significantly (ca. 15-fold) larger guanine signal (II versus I). The dramatic amplification of the signal is combined with excellent selectivity. This is indicated (in Figure 1b) by the lack of signals from a large (100-fold) excess of myoglobin (II) and lysozyme (III), as well as in a control experiment without the thrombin (I). As expected, the secondary aptamer is not captured in the absence of the target thrombin. Such high selectivity reflects the specific recognition of the aptamer, the two aptamer binding events, and the effective magnetic separation. The absence of guanine response in the control experiments also indicates that the primary aptamer is not removed from the magnetic spheres during the release of TBA-2 under mildly acidic conditions. The data of Figure 2a (I) indicates that it is possible to use the guanine-based electronic detection of the secondary aptamer without the time-consuming PCR step and still measure nanomolar concentrations of target proteins, a sensitivity comparable with that of modern aptamer electronic sensors.[3,5,6]
Figure 2.
a) Chronopotentiometric signals for 1 μg mL−1 (I) and 1 ng mL−1 thrombin (II) obtained by measuring the secondary aptamer TBA-2 without and with PCR amplification, respectively. b) Responses of the blank solution (without thrombin; I), and of solutions containing 0.1 μg mL−1 myoglobin (II) and 0.1 μg mL−1 lysozyme (III). Binding times for the target protein and secondary aptamer, 30 min each. After acid digestion and purification, 1 mL of acetate buffer (0.5M, pH 5.8) containing 2 ppm Cu2+ was added to the detection cell. Accumulation: 2 min at −0.05 V; stripping current, +3 μA.
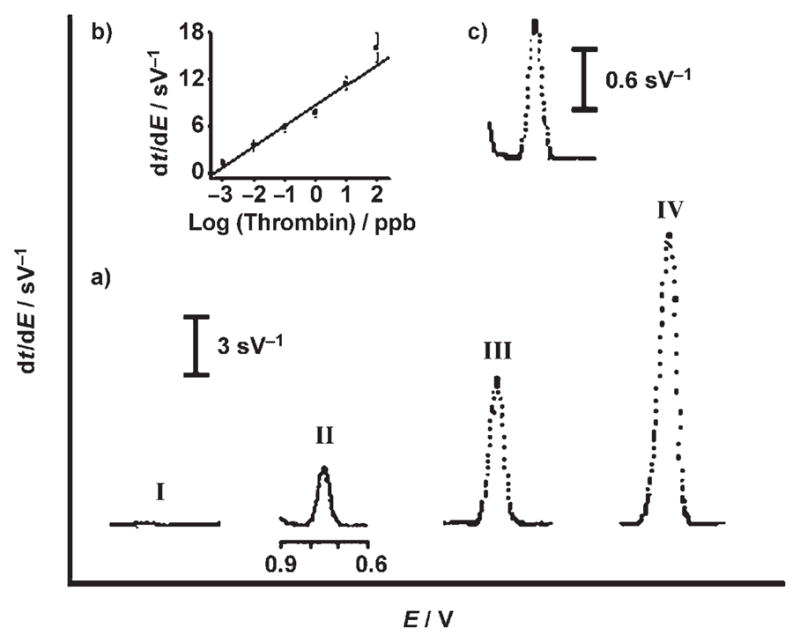
Quantitation is based on the concentration dependence of the guanine oxidation peak that arises from aptamer binding. Figure 3 displays typical post-PCR chronopotentiograms for increasing levels of thrombin (0.01–100 ng mL−1; II–IV). Well-defined guanine signals are observed. The corresponding calibration plot of response versus log[protein] (Figure 3b) is linear over the 0.001–100 ng mL−1 range. The coupling of the ultrasensitive electrochemical stripping detection with the amplification feature of the PCR step leads to extremely low detection limits. The favorable response for a 1 pg mL−1 thrombin solution (Figure 3c) indicates a detection limit of around 0.2 pg mL−1 (5.4 fM), that is, 0.28 amol or 168560 protein molecules in the 50 μL sample. Hence, our PCR-based detection results in a dramatic lowering of the detection limits (by ca. 3 orders of magnitude) compared to the most sensitive electronic aptasensors based on nanocrystal tracers[7] or binding-induced conformational changes.[8] The ultrasensitive response is combined with good reproducibility. A series of six parallel measurements with 0.1 ng mL−1 thrombin yielded a relative standard deviation of 9.2%. A detection limit of 8 nM (0.4 pmol) has been estimated for analogous guanine measurements of 27 nM thrombin without a PCR step (Figure 2a (I)).
Figure 3.

a) Chronopotentiometric signals for increasing thrombin concentrations: 0 ng mL−1 (I), 0.01 ng mL−1 (II), 1 ng mL−1 (III), and 100 ng mL−1 (IV). b) The resulting calibration plot for thrombin over the 0.001 to 100 ng mL−1 range. c) Response for 1 pg mL−1 thrombin. Other conditions, as in Figure 2.
In summary, we have described a method for the extremely sensitive bioelectronic detection of thrombin at a low femtomolar level by coupling the intrinsic electroactivity of the second aptamer with its PCR amplification. This new strategy is expected to open up new opportunities for clinical diagnostics, but requires the availability of two aptamers per analyte. We are currently exploring a multiprotein detection based on different secondary aptamer sequences (serving as distinct electrical bar codes) and a label-free guanine detection based on binding-induced conformational changes of the primary aptamer.
Experimental Section
Measurements were performed with a potentiometric stripping unit PSU20 (Radiometer) using the TAP2 software (Radiometer). The microsphere preparation and assay reactions were performed on a MCB 1200 Biomagnetic Processing Platform (Dexter Magnetic Technologies, Fremont, CA).
A pencil (Model P205, Pentel Ltd, Japan) was used as a holder for the graphite lead. The pencil graphite leads (Hi-polymer super C505-HB, 0.5 mm diameter) were obtained from the same source. Electrical contact was made by soldering a copper wire to the metal part holding the lead inside the pencil. The pencil was fixed vertically with 11 mm of the graphite lead extruding outside (with 10 mm immersed in the detection solution).
Tris(hydroxymethyl)aminomethane hydrochloride (Tris-HCl), sulfuric acid, NaCl, LiCl, MgCl2, CH3COONa · 3H2O, glacial CH3COOH, copper AAS standard solution, tween 20, and bovine serum albumin (BSA) were purchased from Sigma (St. Louis, MO). The streptavidin-coated magnetic beads (0.83 μm in diameter) were obtained from Bangs Laboratories (Fishers, IN). Thrombin-binding aptamer 1 (TBA-1) DNA oligomer with a 5′-biotin modification, thrombin-binding-aptamer 2 (TBA-2) DNA oligomer, PCR primer 1 and PCR primer 2 were purchased from IDT Technologies (Corabille, IA). The sequences of the oligonucleotides were as follows: TBA-1: 5′-biotinylated-TTTTTTTTTTGGTTGGTGTGGTTGG-3′ TBA-2: 5′-GCCTCGCGATGGTGGACGTAGAGT-CCGTGGTAGGGCAGGTTGGGGTGACT-3′ primer 1: 5′-GCCTCGCGATGGTGGACG-3′ primer 2: 5′-AGTCACCCCAACCTGCCCTA-3′
All reagents were analytical grade. Solutions were prepared using nanopure water (specific resistance 18 ohmcm−1) and autoclaved water.
The compositions of the buffers are: TTL buffer: 100 mM Tris-HCl (pH 8.0), 1M LiCl, and 0.1% tween 20; TT buffer: 250 mM Tris-HCl (pH 8.0), and 0.1% tween 20; binding buffer: 50 mM Tris-HCl (pH 7.4), 140 mM NaCl, 1 mM MgCl2, and 1% BSA; acetate buffer: 0.5M sodium acetate buffer (pH 5.8) containing 2 ppm Cu2+.
TBA-1 was immobilized on the streptavidin-coated magnetic beads by using a modified procedure recommended by the manufacture.[15] In brief, coated magnetic beads (100 μg) were transferred into a 1.5-mL microcentrifuge tube and washed with TTL buffer (100 μL). The beads were then incubated with TBA-1 (5 μg, in 25 μL TTL buffer) for 15 min under gentle mixing. The TBA-1-modified beads were separated magnetically and washed twice with TT buffer (100 μL). A 1 mM biotin solution (50 μL) was used to saturate the free streptavidin sites on the bead surface. The beads were then washed twice with TT buffer and were mixed for 30 min in the thrombin sample (50 μL, in the Tris-HCl binding buffer). Following the thrombin binding, the beads were washed twice with binding buffer. An aliquot of a 50 nM TBA-2 solution (50 μL) was added to the beads and the solution was mixed for 30 min. The beads were washed once with the binding buffer and transferred to a new tube, followed by two more washing steps with the binding buffer.
An aliquot of 10 mM HCl (20 μL) was added to the tube and mixed for 10 min to release TBA-2. The beads were separated magnetically and the supernatant was transferred into a 200-μL PCR tube. An aliquot of 10 mM NaOH (20 μL) was added to this PCR tube, and the solution was mixed gently before PCR. For the non-PCR assay, the supernatant was transferred directly to the electrochemical cell and 3M H2SO4 solution (3 μL) was added directly to the sample for digestion.
PCR amplification of TBA-2 was performed in a final volume of 50 μL containing 10 mM Tris-HCl (pH 8.8), 50 mM KCl, 1.5 mM MgCl2, 0.1% TritonX-100, 200 μM dNTP mix, 100 nM of each of the primers, and 0.3U Phusion polymerase (Finnzyme, Finland). The PCR tubes were loaded into a Mastercycler epgradient (Eppendorf) and the amplification was carried out over 30 cycles under the following conditions: 98° C for 30 s, 65° C for 15 s, and 72° C for 10 s, along with final extension at 72° C for 30 s.
The PCR product was purified on a G50 column (GE Healthcare Inc., Buckinghamshire, UK) and transferred to the 1.5-mL electrochemical cell. An aliquot of the 3M H2SO4 solution (10 μL) was added to the purified product. The mixture was heated to dryness on a hot plate. Acetate buffer solution (1 mL, containing 2 ppm Cu2+) was then added to the electrochemical cell.
Stripping measurements of the released guanine bases were performed in a three-electrode system (Pt wire counter electrode, Ag/AgCl (3M KCl) as reference electrode, and a “fresh” 10-mm-long graphite pencil lead as working electrode) following a 1 min preconditioning at 1.4 V and a 2 min accumulation at −0.05 V in stirred acetate buffer (pH 5.8). Subsequent stripping was carried out after 10 s (without stirring) using an anodic current of +3 μA. The data were filtered and the baselines were corrected using the TAP2 software.
Footnotes
This research was supported by the National Institutes of Health (Award Numbers EB002189 and R01A 1056047-04) and the National Science Foundation (Grants CHE 0506529 and MCB 0642857).
References
- 1.Hermann T, Patel DJ. Science. 2000;287:820. doi: 10.1126/science.287.5454.820. [DOI] [PubMed] [Google Scholar]
- 2.Mukhopadhyay R. Anal Chem. 2005;77:115A. doi: 10.1021/ac0415410. [DOI] [PubMed] [Google Scholar]
- 3.Willner I, Zayats M. Angew Chem. 2007;119:6528. doi: 10.1002/anie.200604524. [DOI] [PubMed] [Google Scholar]; Angew Chem Int Ed. 2007;46:6408. [Google Scholar]
- 4.Xiao Y, Lubin AA, Heeger AJ, Plaxco KW. Angew Chem. 2005;117:5592. doi: 10.1002/anie.200500989. [DOI] [PubMed] [Google Scholar]; Angew Chem Int Ed. 2005;44:5456. [Google Scholar]
- 5.Centi S, Tombelli S, Minunni M, Mascini M. Anal Chem. 2007;79:14466. doi: 10.1021/ac061879p. [DOI] [PubMed] [Google Scholar]
- 6.Radi AE, Sánchez JLA, Baldrich E, O’Sullivan CK. Anal Chem. 2005;77:6320. doi: 10.1021/ac0505775. [DOI] [PubMed] [Google Scholar]
- 7.Hansen JA, Wang J, Kawde A, Xiang Y, Gothelf KV, Collins G. J Am Chem Soc. 2006;128:2228. doi: 10.1021/ja060005h. [DOI] [PubMed] [Google Scholar]
- 8.Lai RY, Plaxco KW, Heeger AJ. Anal Chem. 2007;79:229. doi: 10.1021/ac061592s. [DOI] [PubMed] [Google Scholar]
- 9.Xu D, Yu X, Liu Z, He W, Ma Z. Anal Chem. 2005;77:5107. doi: 10.1021/ac050192m. [DOI] [PubMed] [Google Scholar]
- 10.Wang J, Cai X, Jonsson C, Palecek E. Anal Chem. 1995;67:4065. [Google Scholar]
- 11.Wang J, Kawde AB. Analyst. 2002;127:383. doi: 10.1039/b110821m. [DOI] [PubMed] [Google Scholar]
- 12.Wang J, Liu G, Munge B, Lin L, Zhu Q. Angew Chem. 2004;116:2210. doi: 10.1002/anie.200453832. [DOI] [PubMed] [Google Scholar]; Angew Chem Int Ed. 2004;43:2158. [Google Scholar]
- 13.Sano T, Smith CL, Cantor CR. Science. 1992;258:120. doi: 10.1126/science.1439758. [DOI] [PubMed] [Google Scholar]
- 14.Wang XL, Li F, Su YH, Sun X, Li XB, Schluesener HJ, Tang F, Xu SQ. Anal Chem. 2004;76:5605. doi: 10.1021/ac0494228. [DOI] [PubMed] [Google Scholar]
- 15.TechNote no. 101 ProActive Microspheres. Bangs Laboratories, Inc; [Google Scholar]


