Summary
The structure of the IgE-Fc3-4 has been solved in three new crystal forms, providing 13 snapshots of the Fc conformation and revealing a diverse range of open-closed motions among subunit chains and dimers. A more detailed analysis of the open-to-closed motion of the IgE-Fc3-4 was possible with so many structures, and the new structures allow a more thorough examination of the flexibility of the IgE-Fc and its implications for receptor binding. The existence of hydrophobic pocket at the elbow region of the Fc appears to be conformation-dependent and suggests a means of regulating the IgE Fc conformation (and potentially receptor binding) with small molecules.
Keywords: IgE-Fc, crystal structure, flexibility, hydrophobic pocket
Introduction
During an immune response, soluble antibodies belonging to different classes (IgM, IgG, IgA and IgE) can be produced, depending on environmental cues that trigger isotype switching in activated B cells. Class switching to IgE antibodies is stimulated by the presence of Th2 cytokines, such as IL-4, and is inhibited by Th1 cytokines, such as interferon-γ. IgE is typically found at very low concentration in serum, orders of magnitude below that of the predominant IgG antibody class. Unlike IgG, secreted IgE is primarily bound to its high affinity receptor (FcεRI), expressed constitutively on mast cells resident in epithelial layers or on circulating basophils. Thus IgE antibodies are bound to effector cell surfaces prior to antigen engagement. The binding of IgE to FcεRI is of very high affinity (0.1 – 1 nM)1 and exhibits a very slow dissociation rate.
Once produced, IgE antibodies are thought to provide protection against parasitic infections2, 3. However, elevated IgE levels in serum are associated with an increased incidence of allergy and asthma. Given the steady rise in the incidence of allergies and asthma in the developed world, there is significant concern about the causes of these diseases and considerable interest in their prevention and treatment.
Over the past two decades, significant effort has gone into developing inhibitors of the IgE:FcεRI interaction and recent therapeutic efforts have focused on IgE as a target for intervention in these potentially lethal immune responses. In particular, monoclonal antibody strategies have demonstrated good success in treating severe forms of allergic disease4, 5. For example, in the anti-IgE antibody therapy currently in use for the treatment of severe cases of allergic asthma (and other allergies), the protective monoclonal antibody is administered prophylactically, and reduction in the levels of both free IgE and FcεRI expressed on cells is observed, potentially enhancing the benefits of this therapeutic approach6. However, during an acute allergic episode, disruption of preformed IgE-receptor complexes by antibody is unlikely to occur efficiently, and therapeutic strategies to block this interaction are generally more likely to interfere with the binding of new IgE antibodies to effector cell surfaces.
We have previously solved the crystal structures of the FcεRIα chain7 that binds IgE, the IgE-Fc3-4 alone8 and the IgE-Fc3-4:FcεRIα complex9. These studies revealed the mode of binding of the dimeric antibody heavy chain to two distinct binding sites on the surface of FcεRIα. The receptor binding residues are located at the ‘top’ of the IgE C3 domains. The conformation of the receptor-bound IgE-Fc3-4 is very similar to that of IgG-Fc crystallized in the presence or absence of its receptor, demonstrating conserved features of both the antibody structures and their interactions with their respective Fc receptors. However, we also observed that in the absence of receptor, the IgE-Fc3-4 adopted a distinct conformational state in which the C3 domains collapsed towards the C4 domains, disrupting the three-dimensional arrangement of C3 domains required for receptor binding. The flexibility of the IgE-Fc appears distinct from that observed in IgG-Fc's. The conformational changes in the IgE-Fc are of particular interest as they may represent a unique structural feature that could be the target of exogenous conformational modulators that might interfere with FcεRI binding through allosteric mechanisms.
In order to better understand the nature of the IgE-Fc conformational flexibility and its potential diversity, we have determined the structure of the IgE-Fc3-4 in multiple crystal forms, providing 13 independent views of IgE-Fc3-4 chains. The ensemble of these crystal structures reveals clustering of IgE-Fc subunits into two conformational states, both of which are more closed than the receptor-bound form. The discovery of a conformation-dependent hydrophobic pocket at the elbow region of the Fc suggests a means of locking the Fc in a closed or partially closed conformation. Modulation of these IgE conformational states might not only enable inhibition of receptor binding but also stimulate the dissociation of pre-formed, receptor-bound complexes.
Results and Discussion
A carbohydrate mutant (N371Q, N383Q) of the IgE-Fc3-4 was expressed in insect cells, purified, and crystallized in three new forms. Each was solved by molecular replacement and refined (Table 1). Crystal form C2, with unit cell dimensions a= 153.7 Å, b= 105.0, c= 49.2 and β= 101.6°, diffracted to 2.3 Å resolution and has 1.5 dimers (3 chains) in the asymmetric unit (Figure 1a). The chains will be referred to as CA, CB and CE. Crystal form P21, with unit cell dimensions a= 65.7 Å, b= 99.4 Å, c= 77.6 Å, and β= 97.4°, diffracted to 2.45 Å resolution and has 2 dimers (4 chains) in the asymmetric unit. The P21 chains will be referred to as PA, PB, PC and PD (Figure 1b). The larger P21 crystal form, referred to here as P21 ‘big’, with unit cell dimensions a= 48.9 Å, b= 104.9 Å, c= 150.0 Å and β= 96.2°, diffracted to 2.8 Å resolution and has three dimers (6 chains) in the asymmetric unit. Its chains will be referred to as PBA, PBB, PBC, PBD, PBE and PBF (Figure 1c). The 13 new chains described here were analyzed and compared to the previously solved IgE-Fc structures: the closed Fc3-4 (called FCA)8, the Fc3-4 in complex with the alpha chain of FcεRI (chains called FCB and FCD)9, and the Fc2-4 (chains referred to as 24C and 24O for the more closed and the more open chains, respectively)10.
Table 1.
Crystallographic, data collection and refinement statistics
| Space Group (Crystal) | C2 | P21 | P21 ‘big’ |
|---|---|---|---|
| Unit cell dimensions | |||
| a (Å) | 153.7 | 65.7 | 48.9 |
| b (Å) | 105.0 | 99.4 | 104.9 |
| c (Å) | 49.2 | 77.6 | 150.0 |
| β (°) | 101.6 | 97.4 | 96.2 |
| Molecules/asymmetric unit | 1.5 | 2 | 3 |
| Resolution* (Å) | 30–2.30 (2.38–2.30) | 30–2.45 (2.54–2.45) | 30–2.80 (2.90–2.80) |
| Completeness* | 98.8% (89.8%) | 98.2% (82.3%) | 99.9% (100%) |
| Reflections, unique (total) | 36,675 (139,507) | 36,017 (128,258) | 37,208 (139,248) |
| Average redundancy | 3.8 | 3.6 | 3.7 |
| <I/σI> | 15.4 | 22.4 | 16.7 |
| Rsym† (%)* | 6.1 (51.3) | 5.9 (24.1) | 7.3 (54.1) |
| Number of reflections (free) | 36,675 (1,755) | 35,947 (1,824) | 36,906 (1,860) |
| Rcryst / Rfree‡ (%) | 23.1 / 26.2 | 22.9 / 27.7 | 24.1 / 28.0 |
| Atoms, Total | 5,413 | 7,019 | 10,282 |
| Protein | 4,971 | 6,628 | 9,916 |
| Water | 247 | 146 | 0 |
| Carbohydrate | 194 | 244 | 366 |
| Ion (ammonium) | 1 | 1 | 0 |
| Average B factor (Å2) | |||
| Protein | 44.4 | 33.7 | 72.3 |
| Water | 46.5 | 31.7 | – |
| Carbohydrate | 80.5 | 64.7 | 100 |
| RMS Deviations from ideality | |||
| Bond angles | 1.23 ° | 1.45 ° | 0.91 ° |
| Bond lengths | 0.009 Å | 0.010 Å | 0.006 Å |
| Ramachandran plot | |||
| Most favored regions (%) | 91.6 | 90.5 | 86.8 |
| Allowed regions (%) | 8.1 | 9.3 | 12.9 |
| Generous regions (%) | 0.4 | 0.1 | 0.3 |
| Disallowed (%) | 0 | 0 | 0 |
Values for the highest resolution shell are shown in parentheses.
Rsym = ΣhΣi(|Ii(h)| − |<I(h)>|)/ΣhΣiIi(h) where Ii(h) = the observed intensity and <I(h)> = the mean intensity for multiple measurements.
Rcryst and Rfree = Σh‖F(h)obs| − |F(h)calc‖/Σh|F(h)obs| for the working and test set reflections, respectively.
Figure 1.
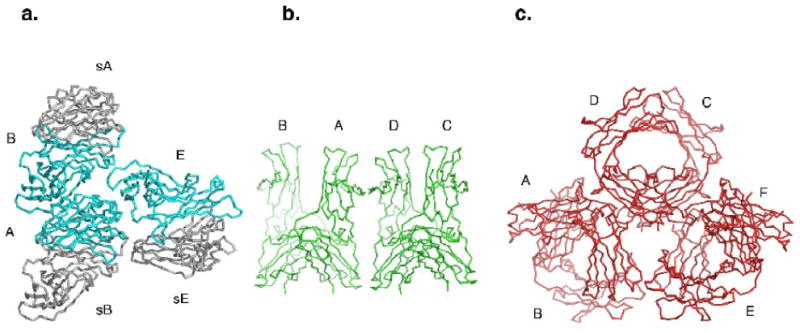
The asymmetric units of the new crystal forms. (a) The three chains of the C2 asymmetric unit (A, B and E) are shown in cyan, and the symmetry-related chains that form the biological dimers are shown in gray (sB, sA and sE). (b) The four chains of the P21 asymmetric unit (A, B, C and D) are shown in green. (c) The six chains of the P21 ‘big’ asymmetric unit (A, B, C, D, E and F) are shown in red.
Open-closed conformational states of the IgE-Fc
The structures of the IgE-Fc3-4 alone8 and in complex with the soluble alpha chain of its high affinity receptor9 revealed a large conformational difference between the two forms that could be described as an open-closed motion about an axis approximately perpendicular to the Fc dimer axis. That is, the upper C3 domains were much closer to each other and to the lower C4 domains in the closed structure than they were in the complex structure. The complex form Fc was more open, with the C3 domains far apart from each other and pointing upward, away from the C4 domains. The proximity of the C3 domains in the closed form suggested that a conformational change (opening) would be necessary in order to bind to the receptor. The structure of the intact IgE-Fc2-410 revealed the location of the C2 domains relative to the C3-4 domains, with one of the subunits having a C3-4 conformation similar to that of the open chains of the complex, while the other subunit conformation was more like that of the closed Fc structure.
We compared the conformations of all of the IgE-Fc subunit structures, including the new structures reported here, by overlaying the C4 domains (residues 441-541) and analyzing the C3 domain positions (Figure 2). Based on the position of the C3 domain, there were at least three groups – closed, intermediate and open. The closed group was the largest, and subtle but visible differences in the C3 domain overlay suggested splitting the group into a very closed subgroup (a) and a slightly less closed subgroup (b). The closed group was similar to the first closed Fc structure in that the C3 domains were close to each other and to the C4 domains. The open group had a large vertical displacement of the C3 domains away from the C4 domains, like the complex form Fc. The intermediate group had elements of both the closed and open groups - their C3 domains were significantly open vertically (C3 domains far from the C4 domains), similar to those of the open Fc, but their C3 domains remained close to each other as in the closed Fc structure.
Figure 2.
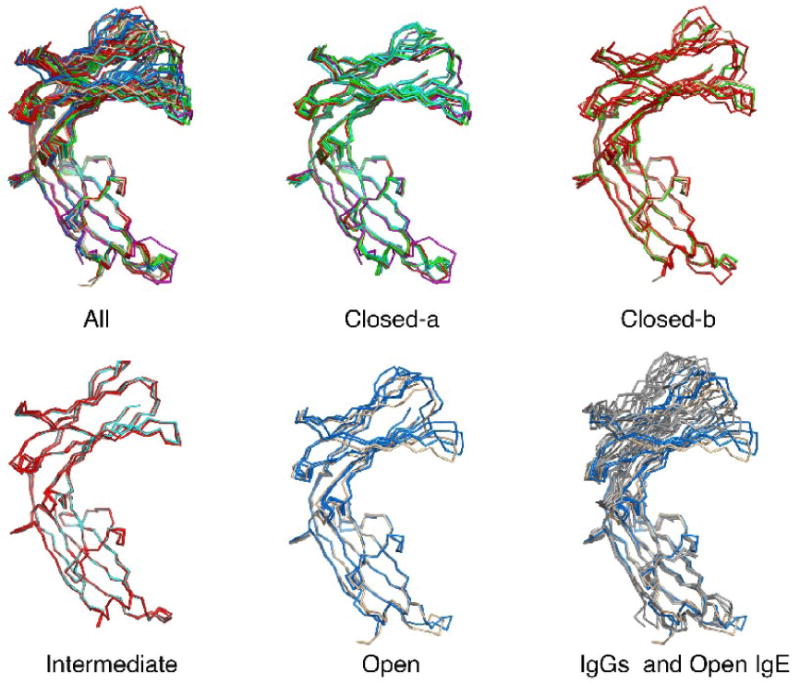
An overlay of the Fc3-4 subunit chains, aligned on C4 domain residues 441-541. New chains from crystal forms C2 (cyan), P21 (green) and P21 ‘big’ (red) are shown with the Fc3-4 from the closed Fc (magenta), the open Fc bound to FcεRI alpha chain (blue), and the intact Fc2-4 (beige). IgG-Fc chains (from IGT1 and 1DN2) are shown in gray for comparison. The Fcs can be sorted into ‘closed-a’ (FCA, CA, CE, PA, PC, PD, PBD), ‘closed-b’ (PB, PBB, PBC, PBE, 24C), ‘intermediate’ (CB, PBA, PBF) and ‘open’ (FCB, FCD, 24O) forms.
It became apparent that in addition to the open-closed motion8, a swinging movement of the C3 domains closer to and further away from each other was another component of the conformations observed. The ‘swing’ of the structures was measured as the distance between residues 336 in the Fc dimers was measured (Figure 3a). Necessarily, each of the chains in the dimer will have the same ‘swing’ by this measurement. The open-closed motion was measured as the distance between the Cα of residue 394 in one chain of a dimer, and the Cα of residue 497 in the lower C4 domain of the other chain of the dimer. This is approximately the projection of residue 394 onto the lower C4 domains. These two measurements, the ‘swing’ of the chains and the vertical ‘open-closed’ movement, were plotted against each other for each IgE-Fc chain (Figure 3b). By these measurements, the different forms can be approximated as follows: ‘closed’ is < 22 Å open with < 17 Å swing, ‘intermediate’ is > 22 Å open with ≤ 17 Å swing, and ‘open’ is > 24 Å open with swing ≥ 16 Å.
Figure 3.
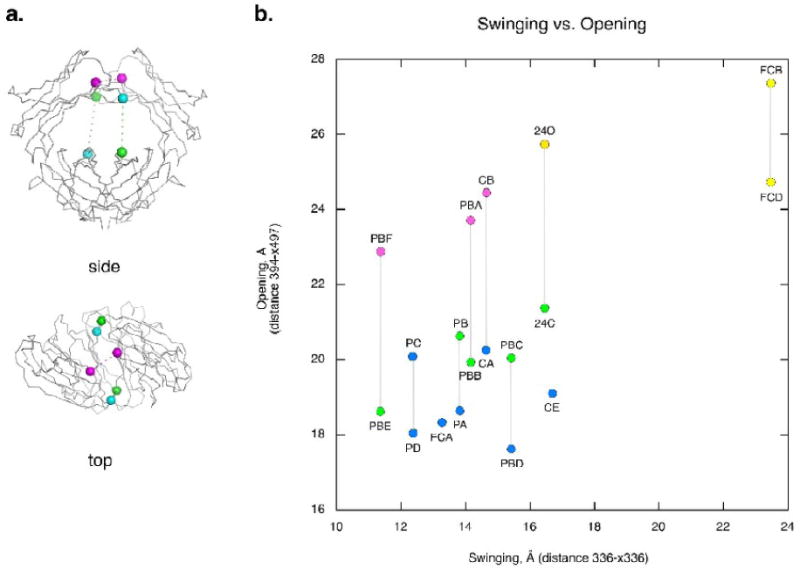
The open-to-closed and swing motions of the C3 domains. (a) A schematic showing how the swing (horizontal) and open-closed (vertical) motions of the IgE-Fc subunits are measured. The swing distance is measured between the Cαs of residue 336 in each dimer (336-x336). The vertical open-to-closed distance is measured from the Cα of residue 394 of one chain to the Cα of residue 497 of the other chain in the dimer pair (394-x497). (b) A plot of the swing vs. the open/closed motion of the IgE-Fc chains. All distances are given in Å. Chain conformation is indicated by color: open (yellow), intermediate (pink), closed-b (green) and closed-a (blue). Gray vertical lines indicate members of the dimer pair except for FCA and CE which are symmetric dimers. Subunits from the different crystals are named by their crystal form and their chain letter. Subunits from new crystal forms include C2's CA, CB, and CE chains, P21's PA, PB, PC and PD chains and P21 big's PBA, PBB, PBC, PBD, PBE and PBF chains. Previously published crystal structures include the closed Fc (FCA), the Fc bound to the soluble FcεRI alpha chain (FCB and FCD), and the intact Fc2-4 structure closed (24C) and open (24O) chains
The Fc bound to its high affinity receptor (chains FCB and FCD), is by far the most open dimer observed. These chains exhibit the largest swing of all the chains (23.5 Å) and are among the most vertically open as well. Only two other chains, 24O and CB, are as open as these. All of the uncomplexed Fc chains have a swing distance of less than 17 Å, compared to 23.5 Å for the receptor-bound chains. Three of the new chains (CB, PBA, and PBF) fall within in the intermediate group (open > 22 Å but swing < 17 Å). The rest of the chains are in the closed group. Only PD is both more closed and less swung than the original closed Fc structure (FCA). Other very closed chains include PA, PBD, CE and PBE.
A conformational phylogram
Attempts at a simple ranking of the Fc chains from closed to open were confounded by conformational differences caused by the open/closed versus swing motions, making the ranking somewhat subjective. To obtain a more objective insight into the conformational relationships among the subunits, the positional Rmsd's for each C3 domain pair were calculated as follows. The individual chains were aligned on the C4 domain (residues 441-541) and variable loop residues from the C3 domains were deleted (residues 362-369, 392-396, and 423-428 inclusive) since the Rmsd values for flexible loops would obscure the domain Rmsd's. All of the pairwise Rmsd's for the loop-deleted C3 domains were calculated using the program ALIGN11. The program MEGA12 version 4 was then used to generate a conformational phylogram using the neighbor joining method with the normalized, calculated Rmsd's.
The first division of clades in the phylogram separates the vertically-open from the closed forms of the Fc (Figure 4). The open node then splits into two clades, the ‘open’ and ‘intermediate’ branches, confirming the relationships among the Fc's within and between these clades. The closed Fc clade is the largest. The C24 chain is split off on its own branch and the remaining Fc's are divided into many smaller clades. Most of the chains that seem most closely related by eye are found near each other in the phylogram. While the phylogram does not reveal a pathway from the closed to open form Fcs, it does suggest that (a) the intermediate-form Fcs are more closely related to the open than to the closed forms, and (b) that of the closed chains, C24 from the IgE-Fc2-4 is more closely related to the ‘open’ clade than all the other closed Fc chains, perhaps because of the influence of the C2 domains.
Figure 4.
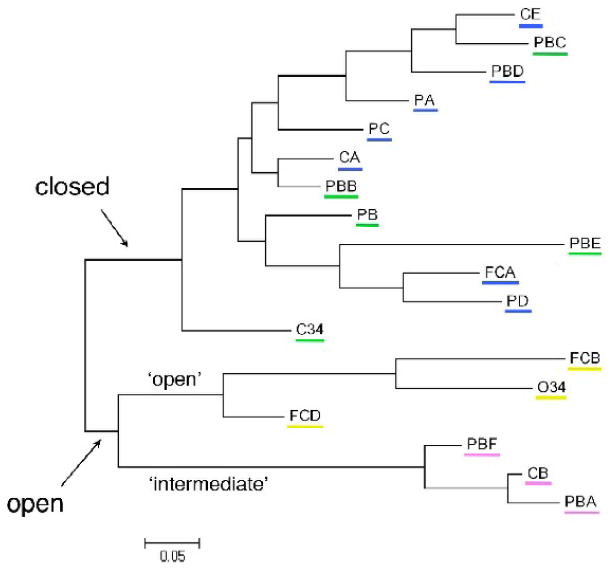
A structural phylogram of the chains, showing the relationships among the various IgE-Fc's. The first division splits the clades by their open-closed status. The more open clade is further divided by the swinging motion of the subunits into two clades – the ‘open’ and the ‘intermediate’ clades. The ‘closed’ clade is much larger and the relationships among the chains are more complex. The ‘open’ forms are underlined in yellow, the ‘intermediate’ forms in pink, the ‘closed-b’ in green, and the ‘closed-a’ in blue.
Structural variability within the C3 and C4 domains
To assess the intrinsic structural variability within the domains, individual domains (C3 to C3, C4 to C4) were superimposed on each other. As expected, the major differences among the C3 domains are in the high affinity receptor binding loops BC, DE and FG (Figure 5a, b). Slight positional differences in the AB helix, located at the interface of the C3 and C4 domains, are also noted. The C4 domain shows considerable variability in the AB loop, the C′ strand, the FG and DE turns, and the EF helix (Figure 5c). The AB loop is the most variable element of the C4 domain and its structure is occasionally influenced by crystal contacts. The DE and FG turns show considerable variability among the different structures as does the N-terminus of the C′ strand. The EF helix is more uniform than these other elements, with the major outlier of the group being from the original closed Fc3-4 structure.
Figure 5.
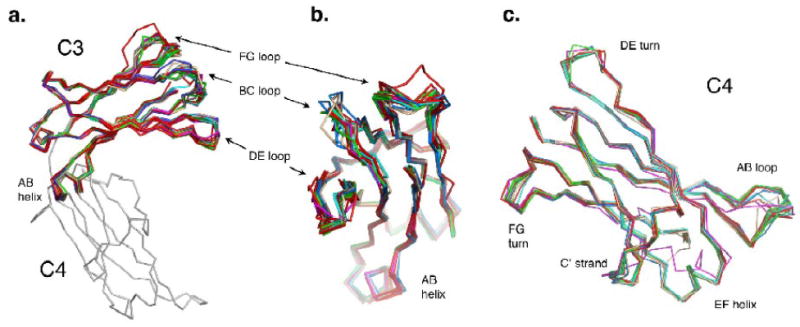
(a) Side view of an overlay of the C3 domains aligned on each other, showing the variable FcεRIα-binding loops: BC, DE and FG. (b) C3 domain overlay rotated 90° from the view in (a). (c) An overlay of the C4 domains aligned on each other, showing the variable AB loop, the DE and FG turns, the C′ strand and EF helix.
Each C4 domain contributes four prominent aromatic residues to the C4-C4 dimer interface: Y446, F448, F504 and F506. Residues F506 and F448 are centrally located at the interface. A comparison of the positions of these residues in the first closed Fc3-4 with that of the open receptor-complexed Fc3-4 reveals that rotamers for F506, F448 and Y446 change such that the packing of the aromatic rings against each other is very different. The closed Fc3-4 is the most closed dimer while the complexed Fc3-4 is the most open. All of the other dimer structures lie between these two extremes. However, the Fc2-4 dimer and all of the new C2, P21 and P21 ‘big’ dimers share the same conformation at the C4 aromatic residue interface, similar to that of the open Fc. Together, these aromatic residues form a ‘greasy’ pivot point at the C4 domain interface.
The C3-C4 elbow/hinge region
One of the structural differences between IgE-Fc and IgG-Fc is the nature of the linker/elbow region connecting the C3-C4 and C2-C3 domains in IgE and IgG, respectively. In IgG, residues in the elbow region are significantly hydrophobic and unusually exposed13, providing a binding site for several proteins that bind to the IgG: protein A14, protein G15, neonatal Fc receptor16, and rheumatoid factor17. By contrast, many of the residues in the linker/elbow region of IgE are charged or polar (R431, K435, R440, S432, T433, T434, T436, S437, D473, E529). The program ESBRI (S. Constantini, G. Colonna & A.M. Facchiano “ESBRI: a web server for evaluating salt bridges in proteins.” http://bioinformatica.isa.cnr.it/ESBRI/) was used to evaluate the salt bridges at the elbow region.
In the IgE-Fc, there are two potential salt bridges that can link the elbow region to the upper and lower domains: R440:E529 on the exterior face links one end of the elbow to the C4 FG turn, while R342:D473 on the dimer interface side links the C3 AB turn to the C4 BC turn. Most of the subunits contain the R342:D473 salt bridge linking the C3 and C4 domains – only FCB and PBE do not – while slightly more than half contain the R440:E529 salt bridge. Only PBE has neither salt bridge but instead uses K435 to form a salt bridge to E529. Each of the structures that is missing one of the salt bridges has a strong (distance ≤ 3.5 Å) salt bridge at the other site.
There are two additional charged residues near the elbow - E472 on the interior face and K435 on the outer face of the elbow. In chains PBA, PBB and FCB, E472 participates in a networked salt bridge with R342 (this salt bridge exists as a weak, isolated bond in CB). Similarly, in FCB and PD, K435 participates in a networked salt bridge with E529. Three of the five networked salt bridges occur in structures that lack one of the two elbow salt bridges, and so they may act to further stabilize the structure at the elbow.
A conformationally sensitive pocket at the C3-C4 elbow
Intriguingly, the elbow region of IgE has a hydrophobic pocket shielded by the linker that varies in size and accessibility depending on the conformation of the Fc. The pocket is lined by residues W410, I411, L348, F349, P471 and the aliphatic portion of R342. Residues K435 and E529 shield the exterior face of the pocket, while R342 and D473 cover the dimer-side opening (Figure 6a). In some of the structures, the pocket extends and forms a tunnel under the linker. Residues lining the extended tunnel tend to be hydrophilic and charged (in PD they include T434, T436, D473, E472, R342, F503, M470 and P439). The program MOLE18 was used to explore the size and accessibility of this pocket. In the most closed structures, the pocket is clearly visible and accessible from the outer face of the Fc (Figure 6b). As the Fc opens, the size of the pocket diminishes and the accessibility decreases until it essentially vanishes in the open form. This pocket was not observed in ten IgG subunits from human and mouse IgGs (pdb accession codes 1IGT, 1DN2, 1ADQ, 1E4K, 1L6X, 1FC1). The size of this pocket in the closed forms is sufficient to accommodate small molecules, and the program DOCK Blaster19 was able to place a number of molecules in the site (molecular weight range 150-349). If a small molecule bound tightly to this site, it might block the opening of the Fc or disfavor the open conformation of the Fc sufficiently to block Fc binding to its high affinity receptor.
Figure 6.
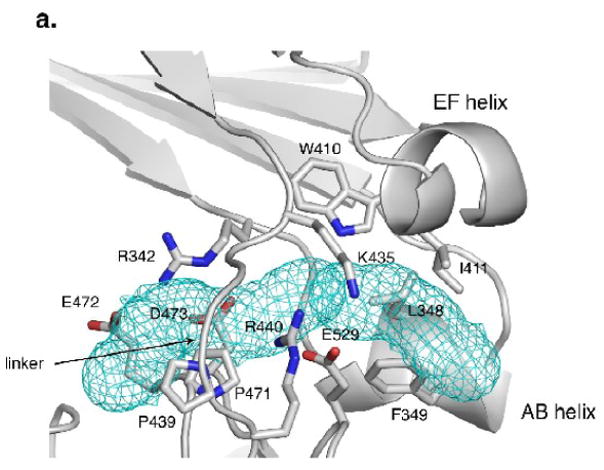
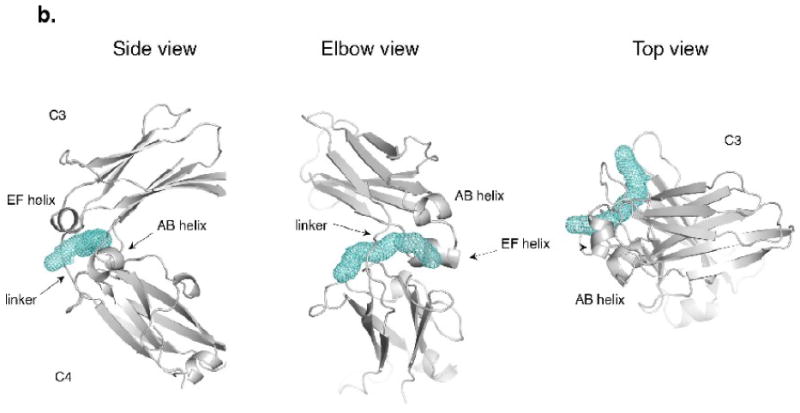
The elbow region at the linker between the C3 and C4 domains. (a) The hydrophobic pocket at the elbow region in the P21 chain D (PD). Hydrophobic residues W410, I411, L348, and F349 are joined by the ring of P471 as well as the aliphatic portion of R342 in forming the pocket. The entry to the pocket is partially covered by charged and polar residues, including K435 and E529 on the exterior face and R342 and D473 at the dimer interface side. The pocket continues into a tunnel that opens on to the dimer interface side. (b) The tunnel found by MOLE18 in the PD chain (side, elbow and top views). Additional residues contacting the tunnel in PD include T434, T436, D473, E472, R342, F503, M470 and P439.
Carbohydrate
In contrast to IgG, the presence of carbohydrate at the conserved attachment site in the IgE C3 domain (residue 394) is not required for receptor binding20, 21. Good electron density was observed at the conserved N394 carbohydrate attachment site in all of the new crystal forms. The carbohydrate lies along the inner face of the C3 domain, in an approximate diagonal from N394 in the upper left to Y339/Q494 at the lower right. Five to six carbohydrate residues were modeled at each site, compared to none in the closed form Fc3-4, seven in the Fc2-4, and three to six in the open, complexed Fc3-4. The residues within 4 Å contact distance to the carbohydrate vary from subunit to subunit but usually include Y339, L359, V361, D362 or L363, Q392, N394, T396 and T398. Frequently S337 and Q494 (of the C4 domain) also contact the carbohydrate. No carbohydrate-to-carbohydrate contacts were observed across the Fc dimers in any of these structures.
Antibody dynamics & receptor binding
The observed range of IgE-Fc conformations invite a closer examination of the potential coupling of antibody dynamics to receptor binding and dissociation. IgE-Fc hinge flexibility could influence high affinity receptor binding in two ways – conformational changes within a single Fc chain could affect the binding of that chain to the receptor (intrachain), or conformational changes in one chain might be propagated across the Fc dimer interface to influence binding interactions of the second chain of the dimer (interchain).
Intrachain conformational dynamics can be approximated by overlaying all the available Fc subunits on their C4 domains and superimposing the overlays onto the two chains of the receptor-bound complex (FCB and FCD). The complex form of the IgE-Fc contains the most open Fc chain (FCB) and the two most swung Fc chains (FCB and FCD) to date. Not surprisingly, superposition onto the FCB chain in the complex structure results in clashes of the overlaid subunits with the receptor (Figure 7a). Overlaying all of the subunits on FCD, the less open chain of the complex, still results in clashes with the receptor (Figure 7b), though there are far fewer. This holds true even for the superposition of the more open FCB chain onto the less open FCD chain. Two of the uncomplexed Fc chains (24O, CB) are as open as the FCD subunit and yet they clash with the receptor when overlaid on FCD, illustrating that the swinging motion of the Fc chains away from each other is necessary to accommodate the high affinity receptor binding.
Figure 7.
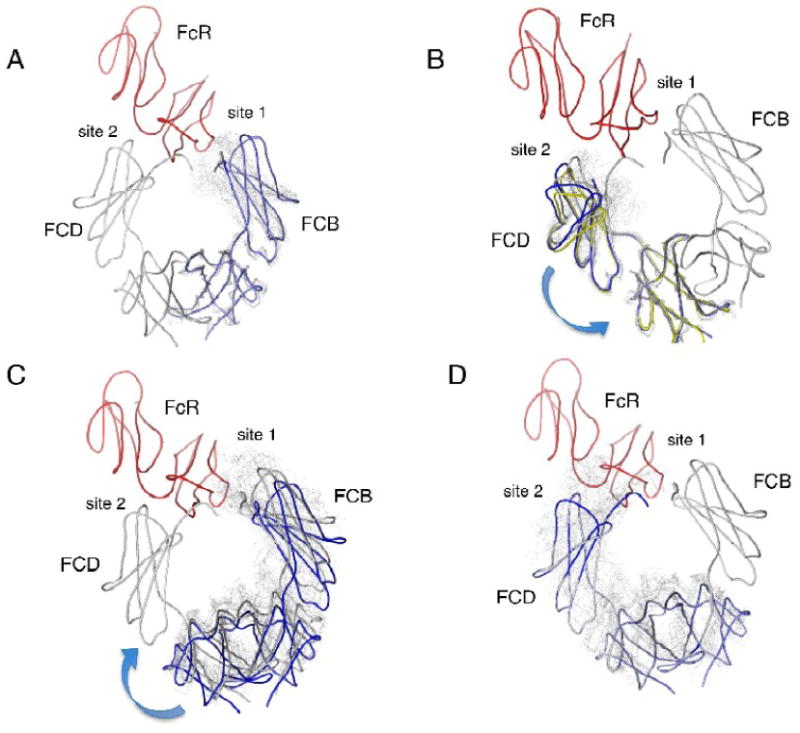
Effects of hinge motions in the IgE-Fc on receptor binding interactions. The structure of the complex between IgE-Fc3-4 and the FcεRIα chain is shown with the IgE-Fc in gray and the α chain in red. The complex Fc subunit FCB will be referred to as chain 1 and the complex Fc subunit FCD as chain 2. Overlaid domains are shown in light gray except as otherwise indicated. Intrachain flexibility is shown in panels (a) and (b) where all chains are overlaid based on their C4 domains and the effect on the subunit's C3 domain is observed. (a) The overlay onto the C4 domain of chain 1. Subunit FCB (chain 1) is shown in light blue. All overlays result in clashes with the α chain. (b) The overlay onto the C4 domain of chain 2 (FCD). All overlays result in clashes with the receptor. Subunits FCB (blue) and O24 (yellow) are more open than FCD and result in few clashes with the receptor, suggesting a possible pathway for dissociation from binding site 2. Interchain flexibility is shown in panels (c) and (d). All chains are overlaid based on their C3 domains, and the resulting new position of the C4 domains is used as the basis for overlaying the rest of the receptor-bound Fc model. The effect on the other C3 domain across the dimer at the other binding site can then be observed. (c) The overlay onto the C3 domain of chain 2 (FCD) at binding site 2. The model shown in blue corresponds to the overlay of FCB, which results in the complete dissociation of chain 1 from site 1. (d) The overlay onto the C3 domain of chain 1 (FCB) at binding site 1. All of the superpositions lead to major steric clashes of chain 2 with site 2.
To visualize the effects of interchain conformational changes, we can consider the propagation of the hinge motion in one Fc chain to the other chain and examine whether this could affect dissociation of the Fc from the receptor. In this case, the C3 domains of the individual chains are overlaid on either the FCB (binding site 1) or the FCD (binding site 2) C3 domain in the complex structure. The hinge motion at the C3-C4 interface of one chain changes the position of the C4 domain, and this is propagated through the C4:C4 dimer interface to the C3 domain of the second chain. When the C3 domains are overlaid on the FCD (site 2) chain, the only conformation that allows for an opening or ‘lifting off’ of the receptor is FCB, the most open chain, suggesting that further opening of the FCD chain in the complex could initiate dissociation from the receptor (Figure 7c). By contrast, the alignment on the C3 domain of FCB (site 1) resulted in the propagation of a closing motion and would not allow the dissociation of the Fc from the receptor at site 2 (Figure 7d).
Conclusions
In the current work, we describe Fc dimers containing 13 new chains that range in conformation from ‘closed’ to ‘intermediate’ forms. In addition to the open-closed motion observed previously, the new chains allowed us to recognize a swinging motion of the subunits towards and away from each other as an integral part of the flexibility of the IgE-Fc. The free Fc structures include dimers in which both subunits are closed and dimers with one subunit open and one closed. However, all of the new structures are significantly swung towards each other compared to the receptor-bound Fc. The opening motion is easily accommodated in one chain of the free Fc dimers but has not been observed crystallographically in both chains of a free Fc. The more open chain might be the first to engage the receptor, while further binding would require both an opening of the second chain and a swinging motion of the two chains away from each other. There is one structure of the intact 3-domain IgE-Fc2-410 and it has the most open ‘closed’ Fc monomer and a very ‘open’ Fc monomer. The presence of the C2 domains appears to influence the opening and swinging of the free Fc. The C2 domains fold back to contact the C3-4 domains, possibly influencing the motions of the C3 domains necessary for receptor binding and dissociation. In fact, the presence of the C2 domains has been shown to slow both the on- and off-rates of IgE binding to its receptor31.
The structures presented here emphasize the importance of the elbow region between the C3 and C4 domains, particularly in terms of potential drug design routes. This region was first identified as being important for the flexibility observed in IgE8 but not in IgG. Unlike IgG-Fc, the AB and EF helices in the C3 domain of the IgE-Fc are not closely associated, allowing the two helices to move independently. Residues at either end of the AB helix and in the linker were identified as forming the ‘hinge’ for the open-to-closed motion. The closing of the IgE-Fc moves the EF helix away from the AB helix. The structures presented here show that this closing creates a hydrophobic pocket between the helices and the linker. Residues that line this pocket come from the AB and EF helices (L348, F349, W410, I411), the aliphatic portion of R342 (just before the AB helix) and P471 (BC loop in the lower C4 domain) (Figure 8). Salt bridges that can form on either face of the elbow are also located here (R342:E472, R440: E529). Because the hydrophobic pocket exists in the more closed forms of the Fc, and because it is large enough to accommodate small molecules, it is possible that filling the pocket would prevent the C3 domains from opening. Since both C3 domains of the Fc have to be in an open conformation to bind to the high affinity receptor, blocking even one C3 domain from opening might prevent receptor binding.
Figure 8.
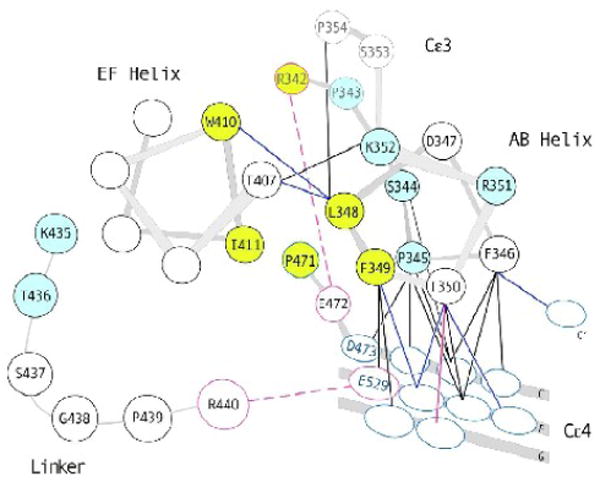
A schematic showing residues of the ‘elbow’ region of the IgE-Fc3-4. Hinge residues are shown in blue (P343, S344, P345, R351, K352, K435 and T436). Residues that line the hydrophobic pocket observed in closed-form IgE-Fcs are shown in yellow (L348, F349, W410, I411, R342 and P471). Residues that can form salt bridges are outlined in red and shown connected by dashed red lines (R342 and E472 at the dimer interface side, R440 and E529 on the outer face). Most of the contacts made by AB helix residues are to residues in the C4 domain. Contacts made by helix residues in both open and closed forms are shown with black lines, contacts made only in the open form are shown in blue lines, and the contact made only in the closed form is shown in a solid red line.
Materials and Methods
carbohydrate mutations
Cloning, Protein Expression and Purification
Mutations (N371Q, N383Q) were introduced into the wild-type IgE-Fc gene to eliminate two potential N-linked carbohydrate attachment sites. The 5′ gene fragment encoding the N371Q mutation was generated by PCR using primers “5-SnaB I” 5′ TAGGGCTACGTAGATTCCAACCCGAGAGG 3′ and “N371Q” 5′ ACTGGCTCGAGACCAGGTCAGCTGCACGGTCCCCTTGCTGGGT 3′ and the PCR product digested with SnaB I and Xho I. The 3′ gene fragment encoding the N383Q mutation was generated using primers “N383Q” 5′ CCTGGTCTCGAGCCAGTGGGAAGCCTGTGCAACACTCCACCAGAAAGGAGGAG 3′ and “3-Not I” 5′ TCTAGGCAGCGGCCGCTTATCATTTACCGGGATTTACAG 3′ and digested with Xho I and Not I. The gene fragments were ligated into the SnaB I and Not I doubly-digested pPIC9K vector. The gene was then amplified by PCR using a forward primer containing a BamH I site 5′ TAGGGCGGATCCCTGTGCAGATTCGAACCCGAGAGGGGTGAGCG 3′ and a reverse primer 5′ TCTAGGCAGCGGCCGCTTATCATTTACCGGGATTTACAG 3′ containing a Not I site. The PCR product and insect cell expression vector pAcGP67A (Pharmingen) were digested with BamH I and Not I and ligated. The construct was confirmed by sequencing. The N-terminal sequence of the mature, signal-sequence cleaved protein is ADPCAD… with residues A, D, and P from the vector and C corresponding to C328 of the mature IgE. Recombinant baculovirus was generated using the Baculogold system (Pharmingen).
Protein expression and purification
Protein was expressed and secreted from insect cells (Trichoplusia ni). Supernatants were harvested 2.5 - 3 days post-infection and filtered through a 0.22 μm cellulose acetate membrane. The supernatant was concentrated 8-fold using a tangential flow membrane (1 ft2 prep/scale™-TFF cartridge, Millipore) with a 10 K molecular weight exclusion limit. Following concentration, the supernatant was diluted 2-fold with low salt buffer (20 mM Na phosphate, 40 mM NaCl, pH 7.0), and the concentration/dilution repeated 6 - 8 times. The supernatant was loaded onto a Streamline SP column equilibrated in low salt buffer (30 mM Tricine, 20 mM NaCl, pH 8.3). The column was rinsed with 4 - 5 column volumes low salt buffer, and the Fc was eluted directly with elution buffer (30 mM Tricine, 600 mM NaCl, pH 8.3). The peak fractions were pooled, filtered (0.2 μm), diluted 10-fold into a solution containing 10 mM MgCl2, 1 mM MnCl2, 100 mM NaCl, and 2 mM Na phosphate, pH 7.0, and incubated overnight at 37°C. Precipitate (primarily contaminants) was removed from the solution by gentle vacuum filtration (0.22 μm). The supernatant was concentrated approximately 20-fold by ultrafiltration in a stirred cell (Amicon, YM-10 membrane) at 4°C, filtered (0.2 μm), and applied to a BioScale S10 column (BioRad) equilibrated in low salt buffer (20 mM Na phosphate, pH 7.0). Following a low salt buffer rinse (10 column volumes), a salt gradient was developed (4.3 mM NaCl/mL). The Fc eluted at ∼ 300 mM NaCl. The peak fractions were concentrated and loaded onto a Superdex 200 column (Pharmacia) equilibrated in 20 mM Na phosphate, 100 mM NaCl, pH 7.0. The Fc peak eluted at ∼ 15 mL (∼ 50 kDa). The Fc fraction was diluted until the NaCl concentration was approximately 20 mM, and the diluted protein was applied to a CHT-2 column (BioRad) equilibrated in 20 mM Na phosphate buffer, pH 6.8. A phosphate gradient was developed (13.5 mM/mL) and the Fc eluted at approximately 220 mM Na phosphate. The peak fractions were used without further purification.
Crystallization and treatment of crystals
The IgE-Fc3-4 N371Q, N383Q was crystallized by vapor diffusion using the hanging drop method. The protein was concentrated to 10 mg/mL (using an ε280nm of 1.32 cm–1(mg/mL)–1) in 20 mM sodium chloride. Concentrated protein was mixed 1:1 with precipitant solution (30% (w/v) polyethylene glycol [PEG] 4000, 100 mM ammonium acetate, 100 mM sodium acetate pH 4.6; final pH ∼ 5.3 to make 1 or 2 μL drops and incubated over 700 μL well solution at room temperature. Crystals appeared in 2-3 days and grew mostly as flat plates with growth defects and very rarely as rods. Crystals grew in three space groups: P21, C2 and P21 ‘big’ (see Table 1). Crystals were stored in harvest buffer (200 mM ammonium acetate, 100 mM sodium acetate pH 4.6, 35% (w/v) PEG 4000; final pH ∼ 5.3) before being transferred briefly to cryoprotectant solution (harvest buffer including either 15% (v/v) glycerol (C2 crystal) or 15% (v/v) ethylene glycol (P21 and P21 ‘big’ crystals)) and flash-cooled in liquid nitrogen.
Data Collection, Molecular Replacement, and Refinement
Data for all crystal forms were collected at −160°C at the Advanced Photon Source DND-CAT 5ID beamline using a MarCCD Detector. The data were processed and integrated using the HKL suite of programs22. Because all crystals forms contained more than one Fc chain per asymmetric unit, reflections for Rfree test sets (5% of data) were taken from thin resolution shells. All forms were solved by molecular replacement using either CNS23, 24 or Phaser25. Structures were evaluated using WHAT IF 26, PROCHECK27 and pdb-care28.
Crystal form P21 (a= 65.7 Å, b= 99.4 Å, c= 77.6 Å, β= 97.4°) contains two Fc molecules per asymmetric unit. A native Patterson revealed translational non-crystallographic symmetry (ncs) between the dimers, described by (x + ½, y + 0.066, z + ½). Molecular replacement (CNS) using a dimer of the closed IgE-Fc3-48 as the search model yielded two clear peaks in the rotation search (correlation coefficients ∼ 13.4 %), and the translation search placed two Fc dimers in the asymmetric unit with the expected ncs relationship (correlation coefficient = 33.2%). Refinement (CNS) was performed against all data from 30 to 2.45 Å using |F| > 0 and an anisotropic bulk solvent correction. A variety of ncs restraints was tested and the best results were obtained by using tight ncs restraints (300 kcal/mole/Å2) on the individual C3 and C4 domains during the early stages of refinement and removing the restraints as the refinement progressed. Cycles of model building into composite-omit maps and refinement continued, but the refinement stalled at Rfree = 31.2 %. At this point, refined monomers from the C2 crystal form were used as models by overlaying and substituting the most similar C2 monomers for the working P21 monomer chains (for PA and PD, used CE; for PC used CA; for PD used the original FCA model). Refinement continued using CNS for the early stages and Refmac 5 (CCP4 suite)29 for the later stages. Cycles of manual model building using O30 into composite omit maps followed by refinement yielded a final model with an Rfree of 27.7 % and an Rwork of 22.9 %. Good density for carbohydrate was observed at each of the conserved N394 residues, and 5 carbohydrate residues were modeled at each site. The final model contains residues V336 to N544, 20 carbohydrate residues and 146 water molecules. There was no density for the first 10 and the last 3 residues of the protein. Chain D residue K499 was modeled as alanine because of poor side chain density. The estimated structural uncertainty based on maximum likelihood is 0.227 Å.
Crystal form C2 (a= 153.7 Å, b= 105.0 Å, c= 49.2 Å, β= 101.6°) contains 1.5 Fc dimers (3 chains) per asymmetric unit. Molecular replacement (CNS) using the original closed Fc dimer as a model failed, but the use of a partially-refined P21 chain C monomer as a starting model succeeded using CNS and Phaser. Refinement with CNS was performed against all data from 30 to 2.45 Å using |F| > 0 and an anisotropic bulk solvent correction, followed by model building into composite-omit maps with O. Later rounds of refinement with Refmac yielded a structure with an Rfree of 26.2 % and an an Rwork of 23.1 %. The final model contains residues G335/V336 to N544, 16 carbohydrate residues and 247 water molecules. There was no density for the first 9/10 and the last 3 residues of the protein. Chain B residue L363 was modeled as glycine because of poor density. The estimated structural uncertainty based on maximum likelihood is 0.192 Å.
Crystal form P21 ‘big’ (a= 48.9 Å, b= 104.9 Å, c= 150.0 Å, β= 96.2°) contains 3 Fc dimers per asymmetric unit. The structure was solved by molecular replacement (CNS) using the closed Fc3-4 dimer as a starting model. The rotation search yielded three top solutions (correlation coefficients 6.7 – 7.7 %), and translation searches (sequentially fixing the top rotation solution and searching for the next dimer) gave a three-dimer solution with a correlation coefficient of 30.9 %. Refinement (CNS) was performed against all data from 30 to 2.8 Å using |F| > 0 and an anisotropic bulk solvent correction. During the early stages of refinement, tight ncs restraints (300 kcal/mole/Å2) were used on the on the individual C3 and C4 domains (with the C3 AB helix defined as being part of the C4 domain). The refinement stalled at an Rfree = 36.0 %. As with the P21 crystal form, the most similar chains from the other refined structures were then used as new models for each chain as follows: for PBA and PBF, used CB; for PBC, used PC; for PBB, PBD, and PBE, used PA (however none of the refined monomers were really good models for these chains). Refinement (CNS) without ncs restraints was followed by with manual model building (O) into composite omit maps. Later rounds of refinement were performed with Refmac and yielded a final structure with an Rfree of 28.0 % and an Rwork of 24.1 %. The structure contains residues V336 to N544 and 30 carbohydrate residues. Residue L363 of chains A and F was modeled as glycine because of poor density; chain A residues R393, R427 and chain F residue R427 were modeled as alanine because of poor side chain density. The electron density for chain E was not as good as for the other chains, being particularly choppy in some sections. The estimated structural uncertainty based on maximum likelihood is 0.375 Å.
Acknowledgments
We thank Drs. Alfonso Mondragón and Hadar Feinberg for valuable discussions, Yu (Helen) Wang for excellent technical assistance, and Dr. Scott C. Garman for assistance with synchrotron data collection. This work was performed at the DuPont-Northwestern-Dow Collaborative Access Team (DND-CAT) Synchrotron Research Center located at Sector 5 of the Advanced Photon Source. DND-CAT is supported by the E.I. DuPont de Nemours & Co., The Dow Chemical Company, the U.S. National Science Foundation through Grant DMR-9304725 and the State of Illinois through the Department of Commerce and the Board of Higher Education Grant IBHE HECA NWU 96. Use of the Advanced Photon Source was supported by the U. S. Department of Energy, Office of Science, Office of Basic Energy Sciences, under Contract No. W-31-109-Eng-38. This work was supported by NIH grant (AI18939) to T.S.J.
Footnotes
Data deposition footnote: PDB deposition codes 3H9Y, 3H9Z, 3HA0
PDB accession codes: Coordinates for the three new crystal structures have been deposited in the RCSB Protein Data Bank with the following accession codes: 3H9Y (C2); 3H9Z (P21); 3HA0 (P21 ‘big’).
Publisher's Disclaimer: This is a PDF file of an unedited manuscript that has been accepted for publication. As a service to our customers we are providing this early version of the manuscript. The manuscript will undergo copyediting, typesetting, and review of the resulting proof before it is published in its final citable form. Please note that during the production process errors may be discovered which could affect the content, and all legal disclaimers that apply to the journal pertain.
References
- 1.Gould HJ, Sutton BJ. IgE in allergy and asthma today. Nat Rev Immunol. 2008;8:205–217. doi: 10.1038/nri2273. [DOI] [PubMed] [Google Scholar]
- 2.Verwaerde C, Joseph M, Capron M, Pierce RJ, Damonneville M, Velge F, Auriault C, Capron A. Functional properties of a rat monoclonal IgE antibody specific for Shistosoma mansoni. J Immunol. 1987;138:4441–4446. [PubMed] [Google Scholar]
- 3.Capron M, Capron A. Immunoglobulin E and effector cells in Shistosomiasis. Science. 1994;264:1876–1877. doi: 10.1126/science.8009216. [DOI] [PubMed] [Google Scholar]
- 4.Milgrom H, Fick RB, Su JQ, Reimann JD, Bush RK, Watrous ML, Metzger WJ. Treatment of allergic asthma with monoclonal anti-IgE antibody. New Engl J Med. 1999;341:1966–1973. doi: 10.1056/NEJM199912233412603. [DOI] [PubMed] [Google Scholar]
- 5.Chang TW. The pharmacological basis of anti-IgE therapy. Nat Biotechnol. 2000;18:157–162. doi: 10.1038/72601. [DOI] [PubMed] [Google Scholar]
- 6.D'Amato G, Salzillo A, Piccolo A, D'Amato M, Liccardi G. A review of anti-IgE monoclonal antibody (omalizumab) as add on therapy for severe allergic (IgE-mediated) asthma. Ther Clin Risk Manag. 2007;3:613–619. [PMC free article] [PubMed] [Google Scholar]
- 7.Garman SC, Kinet JP, Jardetzky TS. Crystal structure of the human high-affinity IgE receptor. Cell. 1998;95:951–961. doi: 10.1016/s0092-8674(00)81719-5. [DOI] [PubMed] [Google Scholar]
- 8.Wurzburg BA, Garman SC, Jardetzky TS. Structure of the human IgE-Fc Cε3-Cε4 reveals conformational flexibility in the antibody effector domains. Immunity. 2000;13:375–385. doi: 10.1016/s1074-7613(00)00037-6. [DOI] [PubMed] [Google Scholar]
- 9.Garman SC, Wurzburg BA, Tarchevskaya SS, Kinet JP, Jardetzky TS. Structure of the Fc fragment of human IgE bound to its high-affinity receptor FcεRIα. Nature. 2000;406:259–266. doi: 10.1038/35018500. [DOI] [PubMed] [Google Scholar]
- 10.Wan T, Beavil RL, Fabiane SM, Beavil AJ, Sohi MK, Keown M, Young RJ, Henry AJ, Owens RJ, Gould HJ, Sutton BJ. The crystal structure of IgE Fc reveals an asymmetrically bent conformation. Nat Immunol. 2002;3:681–686. doi: 10.1038/ni811. [DOI] [PubMed] [Google Scholar]
- 11.Cohen GE. ALIGN: a program to superimpose protein coordinates, accounting for insertions and deletions. J Appl Cryst. 1997;30:1160–1161. [Google Scholar]
- 12.Tamura K, Dudley J, Nei M, Kuman S. MEGA4: Molecular Evolutionary Genetics Analysis (MEGA) software version 4.0. Mol Biol Evol. 2007;24:1596–1599. doi: 10.1093/molbev/msm092. [DOI] [PubMed] [Google Scholar]
- 13.DeLano WL, Ultsch MH, de Vos AM, Wells JA. Convergent solutions to binding at a protein-protein interface. Science. 2000;287:1279–1283. doi: 10.1126/science.287.5456.1279. [DOI] [PubMed] [Google Scholar]
- 14.Deisenhofer J. Crystallographic refinement and atomic models of a human Fc fragment and its complex with fragment B of protein A from Staphylococcus aureus at 2.9- and 2.8-Å resolution. Biochemistry. 1981;20:2361–2370. [PubMed] [Google Scholar]
- 15.Sauer-Eriksson AE, Kleywegt GJ, Uhlén M, Jones TA. Crystal structure of the C2 fragment of streptococcal protein G in complex with the Fc domain of human IgG. Structure. 1995;3:265–278. doi: 10.1016/s0969-2126(01)00157-5. [DOI] [PubMed] [Google Scholar]
- 16.Burmeister WP, Huber AH, Bjorkman PJ. Crystal structure of the complex of rat neonatal Fc receptor with Fc. Nature. 1994;372:379–383. doi: 10.1038/372379a0. [DOI] [PubMed] [Google Scholar]
- 17.Corper AL, Sohi MK, Bonagura VR, Steinitz M, Jefferis R, Feinstein A, Beale D, Taussig MJ, Sutton BJ. Structure of human IgM rheumatoid factor Fab bound to its autoantigen IgG Fc reveals a novel topology of antibody-antigen interaction. Nat Sruct Biol. 1997;4:374–381. doi: 10.1038/nsb0597-374. [DOI] [PubMed] [Google Scholar]
- 18.Petrek M, Kosinova P, Koca J, Otyepka M. MOLE: A Voronoi diagram-based explorer of molecular channels, pores, and tunnels. Structure. 2007;15:1357–1363. doi: 10.1016/j.str.2007.10.007. [DOI] [PubMed] [Google Scholar]
- 19.Huang N, Shoichet BK, Irwin JJ. Benchmarking sets for molecular docking. J Med Chem. 2006;49:6789–6801. doi: 10.1021/jm0608356. [DOI] [PMC free article] [PubMed] [Google Scholar]
- 20.Basu M, Hakimi J, Dharm E, Kondas JA, Tsien WH, Pilson RS, Lin P, Gilfillan A, Haring P, Braswell EH, Nettleton MY, Kochan JP. Purification and characterization of human recombinant IgE-Fc fragments that bind to the human high affinity IgE receptor. J Biol Chem. 1993;268:13118–13127. [PubMed] [Google Scholar]
- 21.Jefferis R, Lund J, Pound JD. IgG-Fc-mediated effector functions: molecular definition of interaction sites for effector ligands and the role of glycosylation. Immunol Rev. 1998;163:59–76. doi: 10.1111/j.1600-065x.1998.tb01188.x. [DOI] [PubMed] [Google Scholar]
- 22.Otwinowski Z, Minor W. Processing of x-ray diffraction data collected in oscillation mode. In: Carter CW Jr, Sweet RM, editors. Methods Enzymol Vol 276: Macromolecular Crystallography, part A. Academic Press; New York: 1997. pp. 307–326. [DOI] [PubMed] [Google Scholar]
- 23.Brünger AT, Adams PD, Clore GM, DeLano WL, Gros P, Grosse-Kunstleve RW, Jiang JS, Kuszewski J, Nilges M, Pannu NS, Read RJ, Rice LM, Simonson T, Warren GL. Crystallography & NMR system: a new software suite for macromolecular structure determination. Acta Crystallogr D Biol Crystallogr. 1998;54:905–921. doi: 10.1107/s0907444998003254. [DOI] [PubMed] [Google Scholar]
- 24.Brünger AT. Version 1.2 of the Crystallography and NMR System. Nature Protocols. 2007;2:2728–2733. doi: 10.1038/nprot.2007.406. [DOI] [PubMed] [Google Scholar]
- 25.McCoy AJ, Grosse-Kunstleve RW, Adams PD, Winn MD, Storoni LC, Read RJ. Phaser crystallographic software. J Appl Cryst. 2007;40:658–674. doi: 10.1107/S0021889807021206. [DOI] [PMC free article] [PubMed] [Google Scholar]
- 26.Vriend G. WHAT IF: a molecular modeling and drug design program. J Mol Graph. 1990;8:52–56. doi: 10.1016/0263-7855(90)80070-v. [DOI] [PubMed] [Google Scholar]
- 27.Laskowski RA, MacArthur MW, Thornton JM. PROCHECK: a program to check the stereochemical quality of protein structures. J Appl Cryst. 1993;26:283–291. [Google Scholar]
- 28.Lütteke T, von der Lieth CW. pdb-care (PDB CArbohydrate REsidue check): a program to support annotation of complex carbohydrate structures in PDB files. BMC Bioinformatics. 2004;5:69–74. doi: 10.1186/1471-2105-5-69. [DOI] [PMC free article] [PubMed] [Google Scholar]
- 29.Vagin A, Steiner R, Lebedev A, Potterton L, McNicholas S, Long F, Murshudov GN. REFMAC 5 dictionary: organization of prior chemical knowledge and guidelines for its use. Acta Crystallogr D Biol Crystallogr. 2004;60:2184–2195. doi: 10.1107/S0907444904023510. [DOI] [PubMed] [Google Scholar]
- 30.Jones T. A graphics model building and refinement system for macromolecules. J Appl Cryst. 1978;11:268–272. [Google Scholar]
- 31.Cook JPD, Henry AJ, McDonnell JM, Owens RJ, Sutton BJ, Gould HJ. Identification of Contact Residues in the IgE Binding Site of Human FcεRIα. Biochemistry. 1997;36:15579–15588. doi: 10.1021/bi9713005. [DOI] [PubMed] [Google Scholar]


