Abstract
A spatially and temporally realistic simulation of Escherichia coli chemotaxis was used to investigate the swimming patterns of wild-type and mutant bacteria within a rectangular arena in response to chemoattractant gradients. Swimming dynamics were analysed during long time series with phase-space trajectories, power spectra and estimations of fractal dimensions (FDs). Cell movement displayed complex trajectories in the phase space owing to interaction of multiple attractors that captured runs and tumbles. Deletion of enzymes responsible for adaptation (CheR and CheB) restricted the pattern of bacterial swimming in the absence of a gradient. In the presence of a gradient, there was a strong increase in trajectories arising from runs and attenuation of those arising from tumbles. Similar dynamics were observed for mutants lacking CheY, which are unable to tumble. The deletion of CheR, CheB and CheY also caused significant shifts in chemotaxis spectral frequencies. Rescaled range analysis and estimation of FD suggest that wild-type bacteria display characteristics of fractional Brownian motion with positive correlation between past and future events. These results reveal an underlying order in bacterial swimming dynamics, which enables a chemotactic search strategy conforming to a fractal walk.
Keywords: chemotaxis, simulation, long memory process, fractional Brownian motion, fractal walk
1. Introduction
As we learn more about how an animal controls its behaviour, it becomes increasingly important to simulate this behaviour on a computer. Only when we have put all of the available information into a program can we tell if our theories of sensory and actuator systems are quantitatively correct. Specific deficits in the performance of the simulated organism can highlight errors in contemporary models and provide an impetus for further hypothesis generation and testing. The success of this approach has been vividly demonstrated in recent years by the construction of robotic animals, such as Sahabot, which mimics the navigation possibilities of the Saharan desert ant, and Salamander robotica, which reproduces the amphibian's ability to switch from swimming to crawling (Bonabeau et al. 1999; Lambrinos et al. 2000; Ijspeert et al. 2007). These artificial creatures become objects of experimental investigation in their own right—surrogate organisms that can be tested in ways not possible for the living versions (Webb 2002).
The swimming of bacteria towards distant sources of food presents a particularly simple and accessible form of behaviour. All of the molecular components responsible for chemotaxis have been identified, purified and studied under defined conditions. A wide range of computer simulations have been developed that reproduce different aspects of the bacterial response and permit bacteria to be treated as surrogate organisms, in the sense used above (Kollmann & Sourjik 2007). In a recent study, for example, we used a molecularly detailed reaction kinetics model of the chemotaxis pathway in Escherichia coli coupled to a graphical display based on known swimming parameters to simulate the responses of bacteria to two-dimensional gradients of attractants (Bray et al. 2007). The program we used is sufficiently close to the real organism that gives the correct phenotype of over 60 mutants in which the components of the chemotaxis pathway are deleted or overexpressed. It also accurately reproduces swimming responses to pulses and step increases of attractant. When placed in a simulated radial gradient of attractant aspartate, the in silico bacteria moved towards and accumulated close to regions of the highest attractant.
Bacterial swimming is customarily classified as a form of biased Brownian motion (Berg & Brown 1972; Berg 1993). From a strict mathematical standpoint this definition carries a number of corollaries. True Brownian motion is a form of noise and therefore scale dependent: for example, if we expand either the spatial or the time dimension then the statistical characteristics of the noise become smoother or more jagged (Peitgen et al. 2004). However, it is already anticipated that bacterial motion does not conform to this strict definition, since individual bacteria exhibit persistence of motion (Berg & Brown 1972; Locsei 2007). A swimming E. coli cell alternates between periods of relatively smooth progression that last for approximately 1 s, called runs, interspersed with brief stochastic changes in orientation called tumbles. Persistence arises because the change of angle during a tumble is not truly random but biased in the forward direction. The pattern therefore embodies some memory of the previous state.
A more rigorous evaluation of the dynamical properties of bacterial swimming would ideally be based on the detailed records of individual bacteria, swimming for long periods in an unchanging gradient, a situation that is unfortunately hard to obtain experimentally. However, as we demonstrate in this report, such an analysis is possible for computer-based bacteria. We have followed individual simulated bacteria for periods long enough to obtain accurate statistical data and reveal the underlying dynamics. We have done this for defined concentration gradients that are absolutely stable for the duration of the experiment, and explored the genetic basis of swimming behaviour using bacteria with genotypes that we have assigned.
2. Methods
2.1. Simulations
The core simulation of the response of E. coli bacteria to gradients of aspartate (the BCT program) has been described elsewhere (Bray & Bourret 1995). The current version (BCT v. 4.4) is available for download from the website http://www.pdn.cam.ac.uk/comp-cell/BCT.html. Protein-based reactions are modelled as a series of approximately 90 ordinary differential equations (ODEs). These include binding reactions between an attractant molecule and the receptor (the input), binding reactions between the receptor and CheA, phosphorylation of CheA and methylation of the receptor. The program starts with the binding association of receptors CheW and CheA to form a functional ternary complex. Subsequent simulation cycles use this assembled complex to perform phosphorylation and other signalling reactions.
Rates and concentrations used in the BCT program are based on the quantitative data reported in the large published literature. Parameter values (7 concentrations and 14 independent rate constants) and their sources are listed as part of the program and are available from http://www.pdn.cam.ac.uk/compcell/Rates.html. Unless otherwise noted, the protein concentrations and kinetic data used in this work are the same as in a recent study (Bray et al. 2007).
The graphical interface was developed using C++ and OpenGL and is similar to that described recently (Bray et al. 2007). In broad terms, the program depicts the swimming of a single bacterium in two dimensions confined within a rectangular arena, 800 μm wide and 400 μm high. The position of the cell with respect to the x-axis is recorded at 25 ms intervals. The bacterium is about the right size and swims at about the right speed. Lengths of runs, angles of turns during tumbles and drift due to thermal noise all correspond roughly with experimental data. The arena is given toroidal boundaries at the top and bottom so that a bacterium swimming into one of these reappears on the opposite side (with no change in its pattern of swimming). By contrast, the arena has impenetrable boundaries at left and right. In the simulations described in this paper, a bacterium encountering one of these boundaries is reflected back, setting off in a run along the shortest trajectory to the peak of the gradient.
The arena contains a symmetrical gradient of chemoattractant (aspartate) that is highest along the vertical midline and decreases to the left and right. In most experiments, we used either linear or exponential gradients. The bacterium starts in the centre of the arena and swims in a random direction. A set of ODEs based on the BCT program read the current level of aspartate and calculate the intracellular concentration of CheYp four times a second. The program then uses the concentration of CheYp to obtain the probability that an individual cell will undergo a tumble in the next time step. The cell then changes its orientation according to a random number selected from a Gaussian distribution and based on experimental values described by Turner et al. (2000).
In addition to the occasional tumbles, the swimming cell also undergoes continual small random changes in direction, called a ‘shimmy’, to simulate thermal drift and rotational diffusion. The size of the shimmy was adjusted so as to produce a correlation length of approximately 10 μm, as observed experimentally with swimming cells (Berg & Brown 1972; Strong et al. 1998).
2.2. Analysis of swimming patterns
Experimental simulations typically ran for 50 min (3000 s). Chemotaxis data were translated into values of time (s) and distance from the centre of the arena (μm) and then plotted as time-series charts using Microsoft Excel. The time series were analysed using histograms to plot the distribution frequency of positions occupied in the simulation arena for the duration of the experiment. These histograms indicate the extent to which cells explore their environment when challenged with different attractant conditions, for wild-type or mutant genetic backgrounds. Time-series data were also analysed by calculating root-mean-square (r.m.s.) displacement from the centre of the simulation arena. The r.m.s. values for the entire 3000 s time-series data were calculated for four intervals of 750 s each. The r.m.s. values were calculated by squaring the position data (displacement from the centre of the simulation arena in μm), calculating the mean position, and then calculating the square root of the mean. The values presented are the r.m.s.±s.e. Histogram distributions and r.m.s. displacement from the centre were calculated using Sigmaplot.
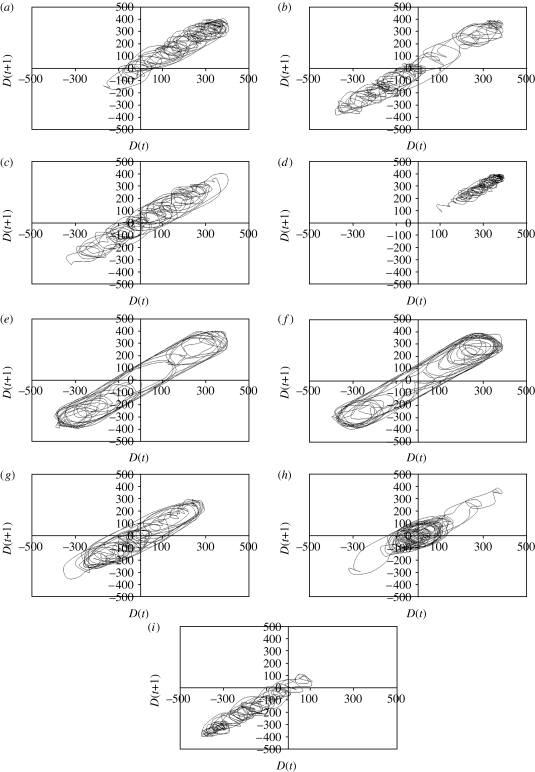
Phase-space diagrams are representations of all possible states of the system. Each possible state corresponds to one point in the phase space. For bacterial chemotactic swimming, the phase space of the system is represented by all possible positions of the cell within the simulation arena. In this report, phase-space diagrams for bacterial swimming were assessed with return maps. The time series was sampled at 5 s intervals, and these data were used to plot return maps for the entire series (0–3000 s). Return maps plot the distance D from the centre at time t [D(t)] versus distance D at time t+1 [D(t+1)]. Owing to trajectory saturation and obfuscation of map details, representative selections from 0 to 1200 s are presented in this report.
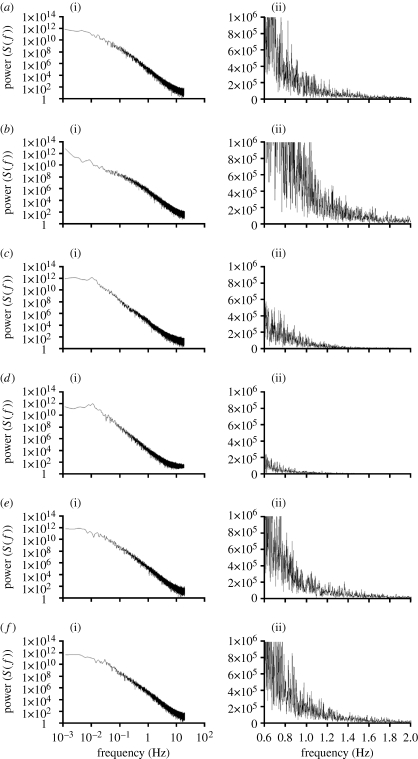
The time-series data show that wild-type bacteria swim in cycles from one side of the gradient to the other. To determine if these cycles contain any repeating (ordered) patterns, the time-domain information was transformed to the frequency domain by fast Fourier transforms and computation of power spectra. The spectral densities can reveal underlying trends and periodicities in the frequency of these chemotactic swimming cycles, and enable direct visualization of spectral frequency differences between wild-type and mutant cells in different environments. Power spectral densities were computed as averages using Sigmaplot v. 8.0 and customized transforms.
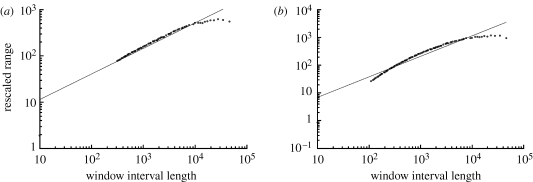
We examined closely how the bacterial chemotactic swimming conformed to random walk or Brownian motion. If a Brownian process is not purely random then there will be some degree of correlation with a very long decay, called a long memory process. When the long memory process has positive correlation, it becomes a fractal process called fractional Brownian motion. The long time-series data obtained with our simulations enabled us to ask whether bacterial chemotaxis is purely random or a long memory process, by estimating Hurst exponents and fractal dimensions (FDs) using rescaled range analysis. Hurst (1951) developed rescaled range analysis as a method to determine whether long time-series data were truly random or contained long-term correlation pattern. The rescaled range analysis is the estimation of range R of cumulative deviations from the mean divided by the standard deviation S, with R/S values obtained for many different window interval lengths τ of the total time-series data. The estimates are plotted as log R/S versus log τ. The Hurst exponent H is estimated from the linear regression R/S∝τ H. The Hurst exponent gives a measure of the roughness of a fractal object and is directly related to the FD, with FD=2−H (Hurst 1951; Mandelbrot & Wallis 1969; Bassingthwaighte & Raymond 1994; Peitgen et al. 2004). A Hurst exponent value of 0.5 indicates a true random walk that lacks correlation between past and future events. Values of 0.5<H<1 indicate persistent behaviour and long memory processes. Hurst exponents were estimated using rescaled range analysis computed with Benoit v. 1.3. The number of data points used for each simulation was 147 840 and the number of window intervals sampled for the R/S calculation was 118.
3. Results
3.1. Chemotactic swimming within the simulation arena
The simulations begin with the bacterium swimming smoothly at right angles to the long axis of the arena, parallel to the highest concentration of the attractant. Owing to its continual shimmy (thermal drift), the cell soon moves towards one side of the arena or the other. As it travels further from the peak of the concentration the cell eventually senses that aspartate concentration is decreasing and initiates a tumble. A series of random changes in direction then ensues until the bacterium heads back in the direction of the gradient peak. Tumbles are then suppressed and the bug swims smoothly to the midline. After crossing the midline, the cell continues to run (since its aspartate receptors are still saturated) and therefore moves down the slope of concentration. When this falls below a certain value, a tumble is initiated and the entire process repeats.
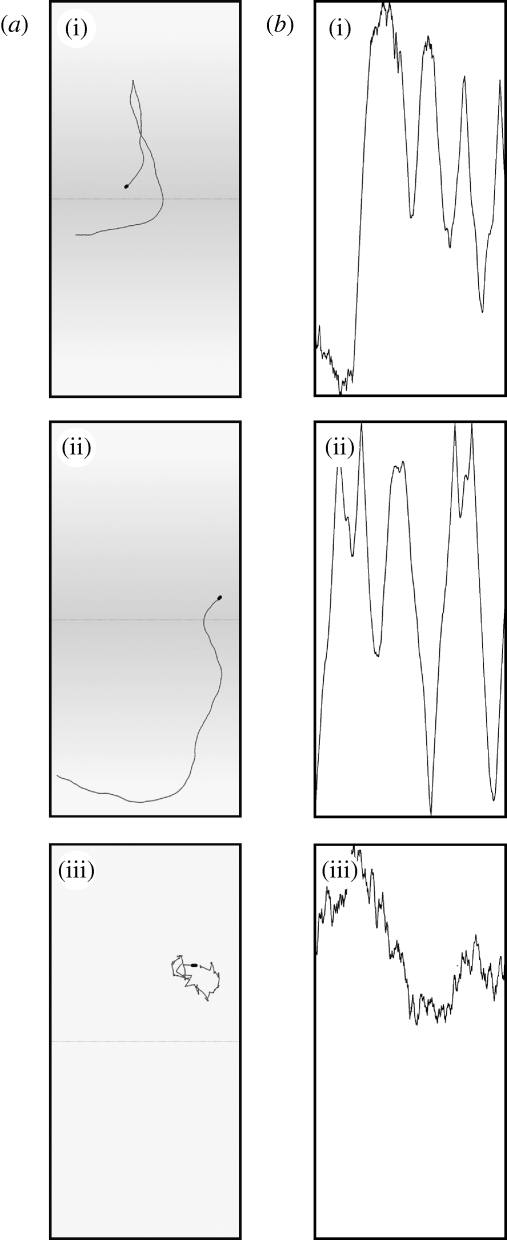
The bacterial genotypes and aspartate gradient specifications used in the study are listed in table 1. Sample screen shot images and position data captured from the computer monitor during simulations are presented in figure 1. The swimming pattern of wild-type bacteria (figure 1(i)) comprises long quasi-repetitive sweeps from one side of the arena to the other across the peak of the gradient (represented by the grey shading). Tumbles occur in the region of low attractant concentration on either side but are variable in precise location and often occur in clusters.
Table 1.
Bacterial genotypes and chemoattractant gradient specifications used in the study.
| simulation | genotype | chemoattractant gradient |
|---|---|---|
| X33-1 | wt | 0 |
| X31-5 | wt | linear 10−8–10−3 |
| X36-1 | wt | linear 10−9–10−7 |
| X30-5 | wt | exponential 10−8–10−3 |
| X36-2 | wt | exponential 10−9–10−7 |
| X33-7 | RB null | 0 |
| X33-5 | RB null | exponential 10−8–10−3 |
| X33-3 | Y null | 0 |
| X32-1 | shimmy=0 | exponential 10−8–10−5 |
| X32-3 | shimmy=2·wt | exponential 10−8–10−5 |
| X36-3 | shimmy=5·wt | exponential 10−8–10−5 |
Figure 1.
Screen shot images captured during experimental simulations of bacterial chemotaxis. The program allows one to view either the paths travelled by the cells or plots of cell position against time. (a) Swimming paths built up from the most recent 1000 images (captured over 25 s) of the bacterium in grey plus the current image, superimposed in black. The centre of each simulation arena is denoted by the dotted line. The aspartate gradient is represented by grey shading. (b) Position data over the previous 5 min, which are plotted as a raster that scrolls from left to right during the simulation. The most recent position of the bacterium is plotted at the right. Note that the images captured from the computer monitor have been rotated here by 90° to allow comparison with figures 2 and 3. Bacterial genotypes are (i) wild-type in an exponential aspartate gradient of 10−9–10−4, (ii) Y null in an exponential aspartate gradient of 10−9–10−4, and (iii) RB null in a uniform aspartate concentration of 10−9.
A cell lacking the signalling protein CheY is shown in figure 1(ii). Tumbles are initiated when the phosphorylated form of the signalling protein CheY, CheYp, binds to the inner face of a motor. Consequently, a CheY-null cell cannot make CheYp and is unable to generate a tumble: it therefore swims smoothly across the arena until either (i) it encounters the top or bottom boundary and is reflected or (ii) the thermal shimmy causes the cell to drift sufficiently that it reverses direction. The cell shown in figure 1(ii) is swimming in an aspartate gradient, but exactly the same pattern would be generated in the absence of a gradient (data not shown). In figure 1(iii), the locus of a bacterium lacking the methylation and demethylation proteins CheR and CheB is recorded in a uniform aspartate concentration. This mutant is unable to adapt to changes in attractant gradients and has no ‘memory’ of past positions. In the absence of a gradient, therefore, it tumbles continuously interspersed with transient runs.
3.2. Long-term swimming behaviour in stable gradients
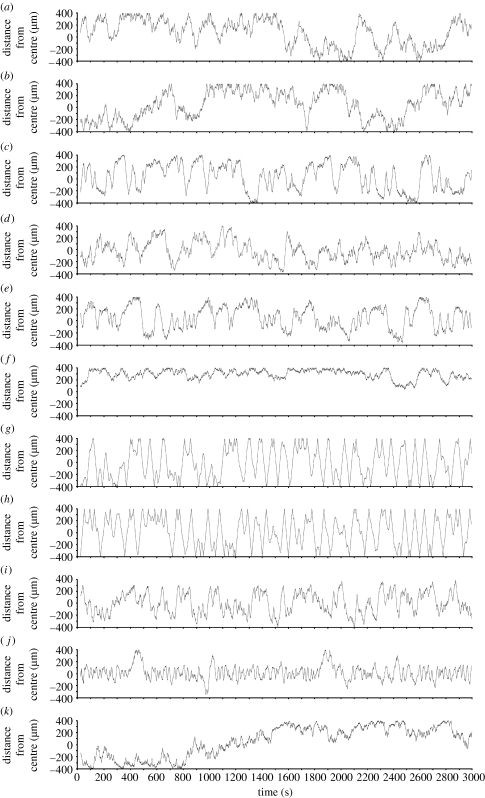
The simulations enabled long observation times and precise measurements of bacterial movement in stable chemoattractant gradients. Movement of the cells during 3000 s is shown in figure 2. The swimming behaviour of wild-type cells was assessed in conditions of no gradient (figure 2 a), linear gradients of 10−8–10−3 M (figure 2 b) and 10−9–10−7 M (figure 2 c), and exponential gradients of 10−8–10−3 M (figure 2 d) and 10−9–10−7 M (figure 2 e).
Figure 2.
Time-series data of bacterial chemotaxis simulations. Bacterial genotypes and gradient conditions for each simulation are given in table 1. (a) X33-1, (b) X31-5, (c) X36-1, (d) X30-5, (e) X36-2, (f) X33-7, (g) X33-5, (h) X33-3, (i) X32-1, (j) X32-3 and (k) X36-3.
In all cases, the trace is dominated by alternating runs and tumbles with a few extended runs. The presence of an aspartate gradient stimulates greater exploration of the arena (figure 2 b,c), while the steeper contours of an exponential gradient cause the cell to spend more time near the centre of the arena where the concentration is the highest (figure 2 d,e). The movement of wild-type bacteria in a range of other gradient sizes and shapes was assessed with similar results (not shown). The cells in figure 2 f,g lack the two enzymes needed for adaptation, CheR and CheB. In figure 2 f, the arena also lacks any attractant, so the cell performs a repetition of multiple tumbles interspersed with brief runs. In these conditions, the mutant cell lacks a systematic searching strategy that would enable it to readily seek out a higher concentration of attractant. In the presence of an exponential gradient with peak 10−3 M, the cell runs for the entire period of 3000 s with few, if any, tumbles (figure 2 g). This result, which may be contrasted with the behaviour of wild-type cells under these conditions (figure 2 d), arises because the cells respond to the gradient but are unable to adapt to it. Continuous runs also occur in cells lacking CheY, which are unable to tumble (figure 2 h). However, in contrast to CheR/CheB mutants, CheY-null cells display continual runs irrespective of gradient conditions (compare figure 2 h with figure 2f).
The last three plots explore the effect of changing the thermal drift, or rotational diffusion, of the bacterium. In figure 2 i, removal of the thermal drift causes relatively minor changes to the swimming pattern. However, a twofold increase in thermal drift (a doubling of the average angle change with time) results in a marked accumulation of the cell nearer to the aspartate peak (figure 2 j). This accumulation arises because the drift carries a cell in even a short run back in the direction of higher concentration. A fivefold increase in thermal drift causes severe disruption of bacterial chemotactic swimming (figure 2 k).
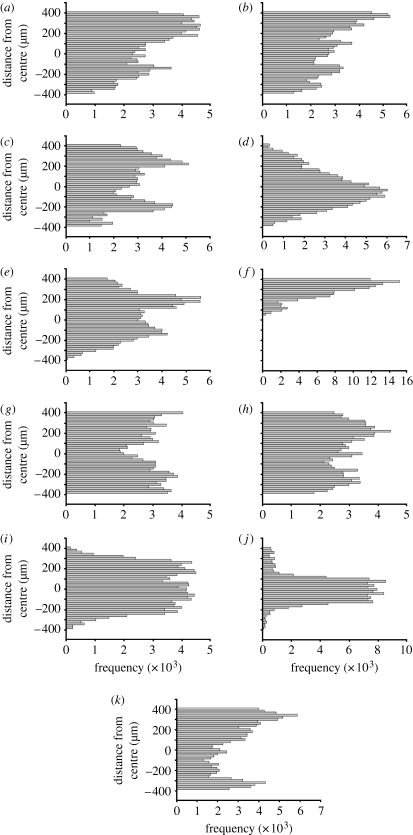
To more clearly reveal how cells move within the simulation arena, position data were plotted as histograms showing the frequency of position occupancy collected in localized regions of the arena (figure 3). The distributions of cell positions were pooled into 40 bins, with each bin representing a 20 μm section through the simulation arena. The histograms reveal a clear difference in the positions of wild-type cells swimming in the absence of a gradient (figure 3 a) or in the presence of a linear gradient (figure 3 b,c), when compared with cells swimming in an exponential gradient (figure 3 d,e). Wild-type cells respond to an exponential gradient by focusing their movements within the region with the highest attractant concentration near the midline of the arena, yielding a Poisson distribution (figure 3 d). The cells lacking CheR and CheB (RB null), swimming in the absence of a gradient, explore the least area of all cells tested (figure 3 f). By contrast, in the presence of an exponential gradient, RB-null cells use the entire arena but are unable to adapt to differences in aspartate concentration (figure 3 g). Cells lacking CheY (Y null) also use the entire arena (figure 3 h), and their position distribution is irrespective of chemoattractant conditions. Removal of thermal drift has moderate effects on how cells move within the arena (figure 3 i), while increasing thermal drift sharpens the peak distribution near the midline (figure 3 j). Further increases in thermal drift perturb the response to chemoattractant (figure 3 k).
Figure 3.
Histograms showing the distribution frequency of positions within the simulation arena for time-series data of figure 2. Each bin represents a 20 μm slice through the arena. Bacterial genotypes and gradient conditions for each simulation are given in table 1. (a) X33-1, (b) X31-5, (c) X36-1, (d) X30-5, (e) X36-2, (f) X33-7, (g) X33-5, (h) X33-3, (i) X32-1, (j) X32-3 and (k) X36-3.
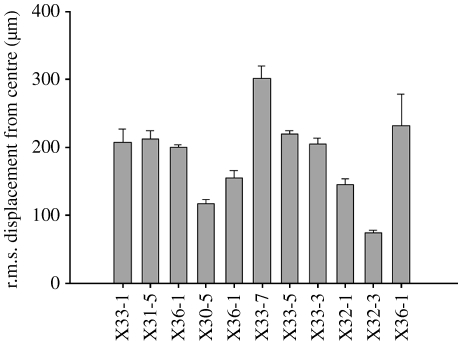
The r.m.s. displacement from the centre of the simulation arena is presented in figure 4. For wild-type bacteria, the movement of cells from the centre of the arena is not significantly different in the absence of a gradient or in the presence of a linear gradient. This distance is clearly decreased in response to an exponential gradient, which focuses the cell's movements towards the peak of the gradient located at the centre of the simulation arena. RB-null bacteria swimming in the absence of a gradient explored the least area of the simulation arena of all cells examined. The r.m.s. values for CheRB-null bacteria, in the presence of an exponential gradient, and CheY-null bacteria were not significantly different from wild-type cells in the absence of an aspartate gradient. A twofold increase in thermal drift helps to focus the cells towards the aspartate gradient, but a fivefold increase in drift results in a greater displacement from the centre of the gradient.
Figure 4.
The r.m.s. displacement from the centre of the simulation arena. Values are r.m.s.±s.e. Bacterial genotypes and gradient conditions for each simulation are given in table 1.
3.3. Chemotactic swimming plotted in return maps
Return maps provide information about the dynamics of long-term swimming behaviour and how the bacteria explore the simulated environment of the arena. Return maps plot the states of the system, with each state corresponding to one position in the map. As the bacteria move from one position to another, the trajectories passing through these points provide information on how chemotactic swimming evolves over time. When select swimming paths are consistently used by cells, the overlapping trajectories indicate specific basins of attraction in the phase space. These basins represent preferred states of chemotactic swimming in a given genetic background and chemotactic environment.
In the absence of a gradient, the swimming path of wild-type bacteria tracks through limited regions of the phase space but in a saturating manner (figure 5 a). The map shows densely nested, compact trajectories that partially overlap, giving rise to tumbles (figure 5 a). These trajectories are also displayed by cells in the presence of aspartate, in addition to longer paths resulting from greater run times (figure 5 b). In the presence of a steep aspartate gradient, the compact trajectories of tumbles are less densely nested and the longer run paths exploring the entire space become more prominent (figure 5 c). These results show that even subtle changes in bacterial swimming are revealed more clearly in return maps as compared to time-series curves shown in figure 2.
Figure 5.
Return maps of bacterial chemotaxis swimming trajectories. Each map plots the swimming trajectories from 0 to1200 s for the time-series data of figure 2. Bacterial genotypes and gradient conditions for each simulation are given in table 1. (a) X33-1, (b) X31-5, (c) X30-5, (d) X33-7, (e) X33-5, (f) X33-3, (g) X32-1, (h) X32-3 and (i) X36-3.
The tumble trajectories accumulate within a narrow region of the phase space in RB-null bacteria swimming in an arena that lacks chemoattractant (figure 5 d). In the presence of a steep aspartate gradient, they appear to become more organized and converge near the boundaries of the system (figure 5 e). Significantly, at least two strong attractors emerge, which capture most of the swimming trajectories, resulting in long periods of uninterrupted runs (figure 5 e). Similar dynamics are observed in CheY-null bacteria (figure 5 f), although the swimming dynamics of CheY-null cells are independent of chemoattractant.
Removal of thermal drift significantly enhances an attractor that captures longer runs (figure 5 g). A twofold increase in thermal drift causes the phase map to contract near the origin (figure 5 h), while a fivefold increase in drift causes a marked disruption of longer runs and how the cells use the arena (figure 5 i).
3.4. Power spectral analysis of chemotactic swimming
Spectral analyses of the complex signals produced by bacterial chemotactic swimming within the simulation arena are presented in figure 6. These power spectra provide information about the distribution of swimming frequencies. The power spectrum of wild-type bacteria swimming in an exponential aspartate gradient is composed of multiple frequencies, a characteristic of Brownian motion (figure 6 a). Minor peaks occur at 0.005 and 0.01 Hz (figure 6 a). Similar spectra resulted from wild-type bacteria swimming in the absence of a gradient and in the presence of a linear gradient (data not shown). Deletion of enzymes required for adaptation (RB null) significantly alters the spectral profiles. In the absence of an aspartate gradient, there is an increase in frequencies especially in the range of 1–10 Hz and an enhancement of the peak at 0.01 Hz (figure 6 b). In the presence of an exponential gradient, the peak at approximately 0.01 Hz increases while higher frequencies are repressed (figure 6 c). This trend becomes more pronounced in CheY-null cells (figure 6 d). Multiple peaks at approximately 0.01 Hz emerge in bacteria that lack the signalling protein CheY, while higher frequencies are severely attenuated (figure 6 d). Alteration of thermal drift has only minor effects on the spectral profiles of chemotactic swimming (figure 6 e,f).
Figure 6.
Power spectral analysis of bacterial chemotaxis. Two charts are shown for each simulation: (i) full log–log plot and (ii) linear plot of 0.6–2 Hz. Bacterial genotypes and gradient conditions for each simulation are given in table 1. (a) X30-5, (b) X33-7, (c) X33-5, (d) X33-3, (e) X32-1 and (f) X32-3.
3.5. Rescaled range analysis for estimation of Hurst exponent and fractal dimension
Rescaled range analysis (R/S) was used on the long time-series data to assess trends or correlations in swimming patterns, by estimating Hurst exponents and FDs. R/S calculations and log–log plots with linear regressions were generated using Benoit v. 1.31 software. The results suggest that only one of the simulations had true Brownian motion or random walk, with H=0.55 and FD=1.45, and that was RB null with zero gradient (figure 7 a). Wild-type bacteria in an exponential aspartate gradient yielded H=0.74 and FD=1.26 (figure 7 b). Estimated Hurst exponents for all wild-type simulations in different chemoattractant conditions ranged from 0.74 to 0.76 (data not shown), indicating that long-term swimming behaviour has positive correlation between past and future events. These results suggest that wild-type bacteria swimming in a liquid medium display fractal patterns of motion, called a fractal walk.
Figure 7.
Rescaled range analysis of (a) RB-null mutant X33-7 (R/S=3.2×τ0.553) and (b) wild-type bacteria X30-5 (R/S=1.3×τ0.741).
4. Discussion
In this report, we have used a computer simulation of individual bacteria to examine the statistical properties of their swimming patterns. Our objective is to investigate this non-equilibrium behaviour using methods of nonlinear dynamics, and relate this to its molecular and cellular origins. To simplify the analysis, we selected a rectilinear arena containing a chemoattractant gradient that is symmetrical about the midline. Simulated cells are allowed to swim freely in this arena, subject to reflection at the left and right borders, and their positions with respect to the x-axis are recorded (i.e. in relation to the gradient). Under these conditions, we find that the cells performed sustained autonomous movements that are complex, noisy and highly sensitive to the parameters of the system, including the genotype of the bacteria and the dimensions of the arena and gradient.
In the absence of attractants, bacteria wandered aimlessly within the arena, constrained within the boundaries of the arena, but otherwise without preference for any particular location. The cell shown in figure 2 a, for example, gave an asymmetric distribution when sampled over 3000 s (figure 3 a), but if averaged over longer periods would have visited all positions across the arena equally (data not shown). If a gradient of attractant was present, however, cells collected in regions of the highest concentration. Thus, in a gradient between 10−9 and 10−7 M aspartate cells swam repeatedly from one side of the gradient to the other (figure 2 b,c), and the corresponding distributions show a peak centred on the gradient peak (figure 3 b,c). Although over this range linear and exponential gradients produced similar results, differences became apparent when steeper gradients were employed. In the 10−8–10−3 M range, an exponential gradient still gave good accumulation (figures 2 d and 3 d), whereas a linear gradient showed little or no accumulation (figures 2 b and 3 b). With a peak concentration of 10−3 M, approximately 99 per cent of the linear gradient will be above a saturating concentration (say 10−5 M aspartate). By contrast, in the exponential gradient 60 per cent of the concentrations will be below saturation and therefore allow effective chemotaxis.
In a natural environment, any stable gradient of diffusible substance between a source and a sink will be linear. From our analysis, we know that an E. coli cell should respond to a linear gradient of aspartate between concentrations of approximately 10−8 and 10−5 M. Extrapolating from the dimensions of our simulated arena (2000 μm), we can therefore predict that the cell should be capable of chemotaxis over a large distance—tens of centimetres. By contrast, the steeper exponential gradient could be produced by a localized source and global degradation or by concentration waves travelling away from a sudden localized pulse of attractant. The cell response here will be of more limited duration and spatial extent. It would be interesting to know the shape and dynamics of real-world gradients and examine how E. coli responds to them.
The rotational diffusion of swimming bacteria, here termed a shimmy, was assigned a value close to 0.15 rad2 s based on experimental measurements (Strong et al. 1998). Removal of this component had only a minor effect on cell swimming (figure 2 i) whereas a twofold increase actually seemed, paradoxically, to improve the ability of bacteria to accumulate at the peak of the gradient (figure 2 j). Increasing the shimmy yet further to five times the experimental value however produced a significant degradation of performance (figure 2 k). It is also clear that if rotational diffusion becomes sufficiently large it will swamp the effects of tumbling, resulting in a completely random walk. We conclude that the optimal shimmy size for bacterial accumulation, under the conditions we examined, is several times larger than expected, i.e. the rate of random turning of the bacterium could be larger. Since the rate of diffusional rotation is a fixed physical parameter, this in turn implies that either the frequency of tumbles or the angle change at a tumble could be greater than the values we have used.
In order to be able to follow bacteria for long periods of time it was necessary to confine them within a defined arena as shown in figure 1, otherwise bacteria would have been steadily lost from our analysis and we would have had to replenish numbers by a steady stream of new bacteria. As shown in figure 1, we chose toroidal boundaries at either end of the arena to minimize any perturbation of the pattern of runs and tumbles, and indeed the loci of swimming bacteria moving orthogonal to the gradient showed no interruptions or discontinuities (figure 2). By contrast, at the top or the bottom of the arena corresponding to the lowest concentrations of attractant, we introduced reflecting boundaries. The behaviour of a swimming bacterium meeting a physical barrier is not well defined and will depend on the nature of the surface (Lauga et al. 2006; Ahmed & Stocker 2008). For convenience, in most of the simulations, we adopted a tactic in which the swimming bacterium was reflected by the barrier back towards the centre of the gradient. We also tried allowing bacteria to return back in any random direction, which one might consider a more natural course of events, but were unable to detect any significant difference in chemotactic behaviour. The presence of these reflecting boundaries obviously affected the swimming of bacteria in the absence of a gradient: thus, the sawtooth back-and-forth motion of mutants lacking CheY or CheB plus CheR arose because of boundary reflections. But bacteria responding to the gradient rarely made contact with these reflecting boundaries, and their pattern of swimming was therefore a direct reflection of chemotactic behaviour (e.g. figure 2 d).
Return maps reveal details of how the chemotaxis search patterns evolve in the simulation arena (figure 5). Wild-type bacteria have densely nested, overlapping trajectories that effectively saturate the arena (figure 5 a–c). CheY-null mutants perform repeated cycles across the entire arena interspersed with shorter cycles near the left and right borders (figure 5 f). A similar pattern emerges in RB-null mutants in an exponential gradient (figure 5 e). An interesting case is seen in the simulation that eliminates thermal drift, where a basin of attraction emerges that lies just inside the borders of the simulation arena (figure 5 g). Removal of memory and attractant or increase in thermal drift both cause accumulation of swimming trajectories in limited spatial regions within the time available in the experimental simulation (figure 5 d,h). Taken together, these results indicate that chemotaxis patterns evolve around multiple basins of attraction.
The spectral frequency density distributions of the simulated bacteria suggest power-law behaviour in a range between Brownian noise and 1/f noise (figure 6). Wild-type bacteria swimming in an exponential gradient have minor peaks at approximately 0.005 and 0.01 Hz, in addition to the complex and densely nested spectra at higher frequencies (figure 6 a). Deletion of CheY causes the emergence of a strong frequency peak near 0.01 Hz (figure 6 d). A similar result is observed in RB-null mutants swimming in the presence of a gradient (figure 6 c). RB-null mutants swimming in the absence of a gradient display an attenuated 0.01 Hz frequency peak. The 100 s cycles arise from the reflection of the left and right boundaries for simulations X33-3 (figures 2 h and 6 d) and X33-5 (figures 2 g and 6 c), but this will not account for the cyclic behaviour in wild-type cells (figures 2 d and 6 a) or in RB-null cells with no attractant (figures 2 f and 6 b). This indicates that there is a cyclic behaviour in the swimming pattern of the simulated bacteria.
Swimming paths of individual bacteria represent the search strategy used by the cells to find food, and have been characterized as random walks. However, a purely random search strategy would be less efficient than an ordered search that incorporates input from memory. The results show that of all simulations tested, only RB-null cells swimming in the absence of chemoattractant display purely random search strategies (figures 2 f and 7 a). Wild-type bacteria display ordered searches that are long memory processes with fractal properties (figures 2 a–e and 7 b). Order is present in wild-type cells even in the absence of chemoattractant (figures 2 a and 3 a; compare with figures 2 f and 3 f). Input from memory fine-tunes the swimming pattern.
Earlier reports found that bacterial colonies on semi-solid media display patterns of growth including circular waves, branches, filaments, radial spots and fractal patterns (Budrene & Berg 1991, 1995; Ben-Jacob et al. 1994; Tsyganov et al. 1999). The present work indicates that swimming patterns in liquid medium of simulated wild-type bacteria have fractal properties, with Hurst values of 0.74–0.76. Bacterial chemotaxis can therefore be characterized as fractional Brownian motion. A search strategy based on fractal geometry, called a fractal walk, is more efficient than one based on a random walk. Many biological and natural systems are fractal with Hurst values of approximately 0.75. Thus, it is intriguing that even the comparatively simple signalling network controlling bacterial swimming contains the same order that is ubiquitous in living organisms.
Acknowledgments
This work has been supported by NIGMS grant GM064713 and The Netherlands Organisation for Scientific Research (NWO–ECHO 700.56.00).
References
- Ahmed T., Stocker R. 2008. Experimental verification of the behavioural foundation of bacterial transport parameters using microfluidics. Biophys. J. 95, 4481–4493. 10.1529/biophysj.108.134510. [DOI] [PMC free article] [PubMed] [Google Scholar]
- Bassingthwaighte J. B., Raymond G. M. 1994. Evaluating rescaled range analysis for time series. Ann. Biomed. Eng. 22, 432–444. 10.1007/BF02368250. [DOI] [PubMed] [Google Scholar]
- Ben-Jacob E., Schochet O., Tenenbaum A., Cohen I., Czirok A., Vicsek T. 1994. Generic modelling of cooperative growth patterns in bacterial colonies. Nature 368, 46–49. 10.1038/368046a0. [DOI] [PubMed] [Google Scholar]
- Berg H. C. 1993. Random walks in biology, expanded edn. Princeton, NJ: Princeton University Press. [Google Scholar]
- Berg H. C., Brown D. A. 1972. Chemotaxis in Escherichia coli analysed by three-dimensional tracking. Nature 239, 500–504. 10.1038/239500a0. [DOI] [PubMed] [Google Scholar]
- Bonabeau E., Dorigo M., Theaulaz G. 1999. Swarm intelligence: from natural to artificial systems. New York, NY: Oxford University Press. [Google Scholar]
- Bray D., Bourret R. B. 1995. Computer-analysis of the binding reactions leading to a transmembrane receptor-linked multiprotein complex involved in bacterial chemotaxis. Mol. Biol. Cell 6, 1367–1380. [DOI] [PMC free article] [PubMed] [Google Scholar]
- Bray D., Levin M. D., Lipkow K. 2007. The chemotactic behaviour of computer-based surrogate bacteria. Curr. Biol. 17, 12–19. 10.1016/j.cub.2006.11.027. [DOI] [PubMed] [Google Scholar]
- Budrene E. O., Berg H. C. 1991. Complex patterns formed by motile cells of Escherichia coli. Nature 349, 630–633. 10.1038/349630a0. [DOI] [PubMed] [Google Scholar]
- Budrene E. O., Berg H. C. 1995. Dynamics of formation of symmetrical patterns by chemotactic bacteria. Nature 376, 49–53. 10.1038/376049a0. [DOI] [PubMed] [Google Scholar]
- Hurst H. E. 1951. Long-term storage capacity of reservoirs. Trans. Am. Soc. Civil Eng. 116, 770–808. [Google Scholar]
- Ijspeert A. J., Crespi A., Ryczko D., Cabelguen J.-M. 2007. From swimming to walking with a salamander robot driven by a spinal cord model. Science. 315, 1416–1420. 10.1126/science.1138353. [DOI] [PubMed] [Google Scholar]
- Kollmann M., Sourjik V. 2007. In silico biology: from simulation to understanding. Curr. Biol. 17, 12–19. 10.1016/j.cub.2006.12.034. [DOI] [PubMed] [Google Scholar]
- Lambrinos D., Möller R., Labhart T., Pfeifer R., Wehner R. 2000. A mobile robot employing insect strategies for navigation. Rob. Auton. Syst. 30, 39–64. 10.1016/S0921-8890(99)00064-0. [DOI] [Google Scholar]
- Lauga E., DiLuzio W. R., Whitesides G. M., Stone H. A. 2006. Swimming in circles: motion of bacteria near solid boundaries. Biophys. J. 90, 400–412. 10.1529/biophysj.105.069401. [DOI] [PMC free article] [PubMed] [Google Scholar]
- Locsei J. T. 2007. Persistence of direction increases the drift velocity of run and tumble chemotaxis. J. Math. Biol. 55, 41–60. 10.1007/s00285-007-0080-z. [DOI] [PubMed] [Google Scholar]
- Mandelbrot B. B., Wallis J. R. 1969. Computer experiments with fractional Gaussian noises. Part 2, rescaled ranges and spectra. Water Resour. Res. 5, 242–259. 10.1029/WR005i001p00242. [DOI] [Google Scholar]
- Peitgen H.-O., Jürgens H., Saupe D. 2004. Chaos and fractals: new frontiers of science. New York, NY: Springer [Google Scholar]
- Strong S. P., Freedman B., Bialek W., Koberle R. 1998. Adaptation and optimal chemotactic strategy for E. coli. Phys. Rev. E. 57, 4604–4617. 10.1103/PhysRevE.57.4604. [DOI] [Google Scholar]
- Tsyganov M. A., Kresteva I. B., Aslanidi G. V., Aslanidi K. B., Deev A. A., Ivanitsky G. R. 1999. The mechanism of fractal-like structure formation by bacterial populations. J. Biol. Phys. 25, 165–176. 10.1023/A:1005153720027. [DOI] [PMC free article] [PubMed] [Google Scholar]
- Turner L., Ryu W. S., Berg H. C. 2000. Real-time imaging of fluorescent flagellar filaments. J. Bacteriol. 182, 2793–2801. 10.1128/JB.182.10.2793-2801.2000. [DOI] [PMC free article] [PubMed] [Google Scholar]
- Webb B. 2002. Robots in invertebrate neuroscience. Nature 417, 359–363. 10.1038/417359a. [DOI] [PubMed] [Google Scholar]


