Abstract
Closed-form analytical solutions are presented for the angular displacement, velocity and acceleration of motion-sensing filiform hairs exposed to airflow pulsations of short time duration. The specific situations of interest correspond to a spider intentionally moving towards a cricket, or an insect unintentionally moving towards or flying past a spider. The trichobothria of the spider Cupiennius salei and the cercal hairs of the cricket Gryllus bimaculatus are explored. Guided by earlier work, the spatial characteristics of the velocity field due to a flow pulsation are approximated by the local incompressible flow field due to a moving sphere. This spatial field is everywhere modulated in time by a Gaussian function represented by the summation of an infinite Fourier series, thus allowing an exploration of the spectral dependence of hair motion. Owing to their smaller total inertia, torsional restoring constant and total damping constant, short hairs are found to be significantly more responsive than long hairs to a flow pulsation. It is also found that the spider trichobothria are underdamped, while the cercal hairs of the cricket are overdamped. As a consequence, the spider hairs are more responsive to sudden air motions. Analysis shows that while two spiders of different characteristic sizes and lunge velocities can generate pulsations with comparable energy content, the associated velocity fields display different patterns of spatial decay with distance from the pulsation source. As a consequence, a small spider lunging at a high velocity generates a smaller telltale far-field velocity signal than a larger spider lunging at a lower velocity. The results obtained are in broad agreement with several of the observations and conclusions derived from combined flow and behavioural experiments performed by Casas et al. for running spiders, and by Dangles et al. for spiders and a physical model of spiders lunging at crickets.
Keywords: cricket cercal hairs, spider trichobothria, flow pulsations, analytical modelling, reaction times
1. Introduction
Many insects such as crickets and cockroaches, and arachnids such as spiders and scorpions, use medium motion-sensing filiform hairs (referred to as trichobothria in the case of arachnids) to detect aerodynamic stimuli in their surroundings, which affect their behaviour. The hairs are loosely suspended in sockets distributed over the animal exoskeleton, such as the cerci of crickets, the legs of spiders and the chelicerae of scorpions. They are usually of different lengths, often clustered or organized in arrays, and respond to the amplitudes and frequencies of the slightest air motions produced by prey, predators or conspecifics, frequently in the presence of significant background noise associated with the environment. For detailed studies see, among others, Markl & Tautz (1975), Tautz & Markl (1978), Gnatzy & Tautz (1980), Barth & Höller (1999), Barth (2000, 2002a ) and Humphrey & Barth (2008).
Until fairly recently, the bulk of the investigations performed to elucidate the performance characteristics of motion-sensing hairs has been experimental in nature, frequently involving carefully controlled sinusoidally oscillating flows. For these conditions, and over many flow oscillation cycles, it is possible to determine the mechanical directional characteristics and the mechanical frequency tuning characteristics of the hairs (e.g. Shimozawa & Kanou 1984a , b ; Barth et al. 1993; Kumagai et al. 1998; Shimozawa et al. 1998). In combination with physical–mathematical models describing oscillating hair motion, from these data it is possible to determine the torsional restoring constants (S h; N m rad−1), and the viscous damping constants (R h; N m s rad−1) inherent to the hairs. With these values in hand, it is now possible to routinely calculate with good accuracy the performance characteristics of the hairs for fairly arbitrary but monochromatic oscillating flow conditions (see Humphrey & Barth 2008 and references therein).
While the highly controlled sinusoidally oscillating flows employed in most of the above-mentioned experiments allow the accurate determination of hair performance characteristics and mechanical constants inherent to the hairs, because they are monochromatic they generally do not correspond to the natural flow conditions. In Nature, the generation and duration of an information-carrying aerodynamic signal can be associated with a highly transient process often having relatively short time scales (typically less than 1 s in contrast to multiple-cycle experiments lasting up to minutes) and spanning a range of frequencies. Consider, for example, the highly transient nature of the flow associated with a cricket escaping from a spider or a scorpion, or of an insect accidentally moving towards or flying past a spider or scorpion. (In this regard, the flow generated in the wake of a flying insect can be viewed as a string of vortices each of which presents pulsation-like characteristics.) It is the analytical modelling of the flow fields induced by these suddenly accelerated bodies, and the effects of the flow fields on motion-sensing filiform hairs, which concerns us here.
1.1. Prior work
The biological importance of transient flow effects on hair motion has been discussed by, for example, Wiese (1976), Camhi (1984), Barth et al. (1995), Tauber & Cahmi (1995), Friedel & Barth (1997), Brittinger (1998), Barth & Höller (1999), Barth (2000, 2002b ), Dangles et al. (2006), Humphrey & Mellon (2007), Casas et al. (2008) and Humphrey & Barth (2008). In particular, Tauber & Camhi (1995) investigated the escape behaviour of free-ranging crickets Gryllus bimaculatus exposed to a wind stimulus consisting of an air pulsation. In their experiment, at the location of the cricket cerci, the air speed increased essentially linearly to a peak value of approximately 2.3 m s−1 over a period of approximately 0.2 s. The latency times1 for three categories of escape behaviour were measured to be: (i) 87±56 ms for a turn response, (ii) 94±51 ms for a jump response, and (iii) 52±42 ms for a turn (first) and 191±33 ms for a jump (second) response. Even though statistical analysis revealed no significant differences among the latencies of these three response categories, the study showed that Gryllus can discriminate between air motions approaching it from the left and right sides, respectively, as well as from the near front and near rear. Brittinger (1998; see also Barth 2002a ) investigated the elicitation of prey-capture behaviour in the spider Cupiennius salei by artificially produced airflow pulsations aimed at one or two legs. In these experiments, stimulus pulsations of duration 0.2 s and speed 0.233 m s−1 were imposed on the spider's metatarsus. These experiments showed that when aimed at an intact leg the spider responded to air pulsations, whereas stimulation of a leg with the trichobothria removed did not elicit spider response.
Rinberg & Davidowitz (2003) conducted a two-dimensional (horizontal plane) flow experiment to investigate the relationship between (i) the statistical properties of a stimulus emulating ambient wind motions in the cockroach's environment and (ii) the steady-state response of the cercal system. For this, they simulated ambient flows by random wind stimuli with different spectra. A trial consisted of 3–4 s of quiescence, a 60–100 s period with the cockroach cerci exposed to a horizontal wind stimulus with a given spectrum and a final 3–4 s period of quiescence. While the length of the stimulus in their study does not correspond to the pulsation-like flows of interest here, some of the authors' findings are relevant. They find, for example, that neuron firing rates strongly depend on the shape of the stimulus spectrum, narrowing the spectrum working to increase the average firing rate. More relevant to this study, the authors also analysed the fluid mechanics to conclude that the horizontal velocity component of the wind signature of a predator approaching a cockroach varies according to V z=V S R S/(z+R S) where z is the location ahead of a predator of characteristic size (or length scale) R S translating at a characteristic velocity V S. (The constraints on this estimate are discussed in appendix A.) From their analysis, the authors conclude that a cockroach needs to detect the increasing far-field flow velocity of an approaching predator in order to be able to escape it and that, because it has only 50–100 ms to respond, the frequencies important to escaping an attack lie below approximately 20 Hz.
Dangles et al. (2006) simulated the airflow produced by a wolf spider (Lycosidae, Pardosa sp.) lunging at a stationary wood cricket (Nemobius sylvestris) by means of an impulsively accelerated cylindrically shaped piston-like object. Thus, starting from rest, moving in the direction of the cricket, and approaching it from behind, within a displacement of 1 cm the cylinder was brought to a final constant velocity along its longitudinal axis. Cylinder velocities corresponding to 5, 11, 15, 25, 40 and 50 cm s−1 were explored and the characteristics of the flow fields induced ahead of the cylinder once it had attained a constant velocity were quantified by means of particle image velocimetry (PIV). The diameter of the cylinder was 0.8 cm, close to the frontal diameter range (0.5–0.7 cm) of the spiders, and its side was located parallel to and 0.2 cm above the working surface, approximately corresponding to the height of a spider. The starting position of the cylinder was located 4.5 cm away from the cricket and the total cylinder displacement was approximately 4 cm, resulting in characteristic total displacement time scales of 0.800, 0.364, 0.267, 0.160, 0.100 and 0.080 s, approximately, for the velocities explored. In comparison, the characteristic time scales associated with establishing a steady motion were, approximately, 0.200, 0.091, 0.067, 0.040, 0.025 and 0.020 s. The flow fields produced by the axially translating cylinder elicited behavioural responses in the crickets closely matching those observed when the spiders lunged at them. Thus, the median distance from the approaching cylinder circular face at which crickets initiated escape behaviour was 1.6 cm (range: 0.5–2.4 cm), within the range observed for crickets escaping from spiders. Also similar to the natural situation, cricket escape success was found to be maximal for intermediate approaching cylinder velocities (range: 11–25 cm s−1), and to decrease markedly at very low (less than 8 cm s−1) and very high (larger than 33 cm s−1) velocities. In the natural situation, it was observed that more than 70 per cent of spider attacks occurred at these extreme velocities. In further work also using the PIV technique, Casas et al. (2008) measured the motion of air ahead of running wolf spiders (Pardosa lugubris) and assessed the flow patterns observed in relation to their attack strategies and the escape strategies of cricket prey. Their findings were in good agreement with those derived from the accelerated cylinder model of Dangles et al. (2006). In particular, they determined that the electrophysiological velocity threshold of 30 μm s−1 (quoted by them) for triggering action potentials from cricket filiform hairs could be attained at a distance 3 cm ahead of a spider running at approximately 9.5 cm s−1.
Humphrey & Barth (2008) modelled the response characteristics of spider MeD1 trichobothria (Barth et al. 1993) exposed to a transiently evolving boundary-layer flow consisting of a background motion with a high-frequency sinusoidal component of motion superimposed. The case of interest corresponds, approximately, to an insect flying over a spider. In the calculations, the combined background and sinusoidal motions were simultaneously accelerated exponentially from rest around a spider leg of diameter 2 mm on which the hairs of interest were located. Using the data of Barth et al. (1995) for guidance, the final developed background flow was fixed to 50 mm s−1 and the amplitude of the final developed oscillating component to 10 mm s−1 with a frequency of 100 Hz. This combined transiently evolving flow acted on three hairs of different length (250, 500 and 1000 μm). Whereas, for the conditions examined, the far-field velocity and the boundary-layer thickness acquired their steady periodic states in less than 50 ms, the effects of the periodic component of motion on the three hair types examined were noticeable within 15 ms. In addition, all three hairs were well within the boundary layer of the transiently evolving oscillating flow. However, because the longest hair extended furthest into the boundary layer, it experienced the highest air velocities, resulting in significantly larger angular displacements and velocities for this hair compared with the other two. It was also found that within 5 ms of the start of motion, each of the three hairs had been displaced by approximately 0.10° (1000 μm), 0.06° (500 μm) and 0.03° (250 μm), values large enough to trigger action potentials from the sensory cells connected to the hairs (Barth & Höller 1999).
The above studies show that insects such as cockroaches and crickets must be able to detect pulsation-like transient flow fields generated by suddenly approaching predators if they are to avoid capture. Likewise, it is entirely plausible that arachnids such as spiders and scorpions experience pulsation-like transient flows generated by prey moving in their vicinity. For this reason, it has been of special interest to perform a comparative analysis of cricket and spider motion-sensing hairs exposed to the same flow conditions, even if the former are more likely to experience pulsating flows than the latter.
2. Theoretical analysis
2.1. Hair angular momentum equation
We are concerned here with developing a physical–mathematical model that will simulate the response of a filiform hair to an airflow pulsation; that is, to the frequency-rich motion of an airflow that is essentially instantaneously accelerated from a state of rest and then, over a predetermined amount of time, decelerated back to a state of rest. The specific situation of interest is motivated by and relates to (with some differences to be clarified) the experimental investigations by Dangles et al. (2006) and Casas et al. (2008), discussed above. In particular, we ask the question: How will the filiform hairs of a cricket and the trichobothria of a spider respond to such a flow pulsation? Because crickets are spider prey and spiders are cricket predators, it is interesting to explore, for the same range of flow conditions, the extent to which their motion-sensing hairs exhibit similar or dissimilar behaviours. Hence the comparative analysis performed.
The starting point for the present analysis is a statement of the conservation of angular momentum for the motion of a filiform hair, approximated as a forced, damped harmonic oscillator, given by eqn (1) in Humphrey & Barth (2008)
 |
2.1 |
In equation (2.1): θ (rad),  (rad s−1) and
  (rad s−2) are the angular displacement, velocity and acceleration of the hair about its pivot point, respectively; I
h (N m s2 rad−1) is the moment of inertia of the hair; S
h (N m rad−1) and R
h (N m s rad−1) are the hair torsional restoring constant and damping constant, respectively; and T (N m) is the total torque acting on the hair. The moment of inertia of the hair is determined from geometry and is given by
 |
2.2 |
where d (m) and L (m) are, respectively, the diameter and length of the hair, approximated as a cylinder, and ρ h (kg m−3) is the hair density. The constants R h and S h are mechanical properties inherent to the hair, determined by the material and structural characteristics of the attachment supporting it, and must be obtained experimentally. The torque T in equation (2.1) is given by
 |
2.3 |
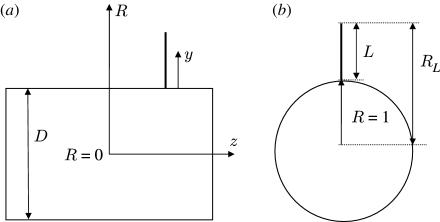
where (i) F D (N m−1), (ii) F AM (N m−1) and (iii) F PG (N m−1) are forces per unit length acting on the hair, respectively, due to (i) the viscous drag, (ii) the added mass of air around the hair and (iii) a ‘pressure gradient’ force. (Although for filiform hairs in air F AM≪F D and F PG≪F D, both of these terms are retained in the present analysis which also applies to hairs in water.) The integration in equation (2.3) is performed along the length of the hair, which, for small displacement angles (θ≤10°) remains essentially normal to the substrate supporting it. With reference to figure 1, the substrate supporting the hair is either a spider leg or a cricket cercus, both being approximated as a long cylinder of diameter D (m), as in Humphrey & Barth (2008) and references therein.
Figure 1.
Simplified schematic showing (a) side and (b) end views of a cylindrically shaped spider leg or cricket cercus of diameter D with a cylindrically shaped hair of diameter d and length L projecting normal to the substrate surface. The relevant (y, z) coordinates are defined. Note that R=1+(y/(D/2)) is the dimensionless hair length with origin at the centre of the large cylinder so that R=1 (y=0) corresponds to the substrate surface and R L=1+(L/(D/2)) corresponds to the tip of the hair.
As will be shown, a hair exposed to a velocity pulsation is momentarily displaced from its normal position, to which it subsequently returns to rest owing to the action of the torsional restoring constant. Because the displacement of the hair is continuous and its oscillations about any displacement location during the course of motion are of relatively small amplitude, it is assumed that at any instant in time the motion of the hair is in dynamic equilibrium with the motion of the air around it. For this condition, expressions for F D, F AM and F PG are given by
 |
2.4 |
 |
2.5a |
 |
2.5b |
The expression for the viscous drag force F
D given by equation (2.4) is the classical Oseen equation (White 1991); that for the added mass force F
AM given by equation (2.5a) is due to the added mass of air around the hair, which must accelerate with it (Milne-Thomson 1986); and that for the pressure gradient force F
PG given by equation (2.5b) is the force required to accelerate the air that would occupy the volume of the length of hair if it were absent (Clift et al. 1978). Equation (2.4) is valid for Re
d=dV
r
ρ/μ<1, where: ρ (kg m−3) and μ (kg m−1 s−1) are the air density and dynamic viscosity; and V
r=V
f−V
h (m s−1) is the relative velocity of the air (V
f) with respect to that of the hair (V
h). The quantities  and
and  in equations (2.5a) and (2.5b) are the relative acceleration and acceleration of the air, respectively. The velocity of the hair depends on the distance y (m) from the substrate and is given by
  . In equation (2.4) the quantity Γ=0.577216… is Euler's constant.
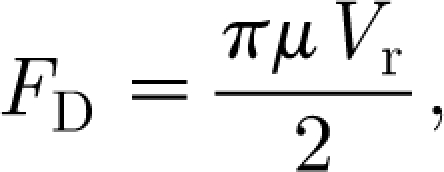
Owing to the logarithmic dependence of F D on Re d in equation (2.4), to render the problem of interest analytically tractable, it is necessary to make an approximation. We know from earlier work that the Reynolds number range for filiform hairs is typically bounded by 10−4<Re d<10−2, approximately (see Humphrey & Barth 2008 and numerous references therein). This means that the denominator in equation (2.4) varies between 6.6 and 11.2, a representative value in the range of Re d being 8. For this value equation (2.4) simplifies to
 |
2.6 |
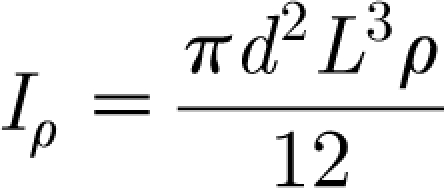
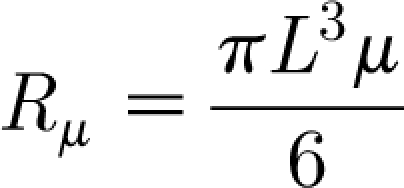
with an average error2 of less than 12 per cent over the range of Re d. Substituting equations (2.5a), (2.5b) and (2.6) into equation (2.3) and the result of this into equation (2.1) yields (after integration and rearrangement of terms) the following form for the angular momentum equation:
 |
2.7 |
In equation (2.7)
 |
2.8 |
and
 |
2.9 |
are additional inertia and damping contributions due to the air medium, respectively. The quantity Q is the forcing function given by
 |
2.10 |
In earlier work, in order to account for the effect of viscous damping on air motion by the no-slip velocity condition at the substrate, Humphrey et al. (1993) have taken for the function V f the analytical solution for the flow field oscillating parallel to the longitudinal axis of a spider leg approximated as a fixed, infinitely long cylindrical substrate.3 The result is
 |
2.11 |
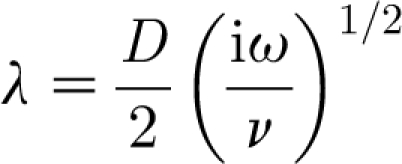
where
 |
2.12 |
and ω (=2πf rad s−1, where f is frequency in Hz) is the flow oscillation angular frequency.
With reference to figure 1, in the above two expressions: D is the substrate diameter, here corresponding to a spider leg or a cricket cercus; R=(1+y/(D/2)) is the dimensionless hair length with origin at the centre of the cylindrical substrate; V ∞ is the far-field velocity amplitude; i=(−1)1/2 is the imaginary unit; ν (≡μ/ρ) is the air kinematic viscosity; λ is a dimensionless viscous length scale associated with the damping of the air motion by the substrate; and K 0( ) denotes the modified Bessel function operator of the second kind. It is the Bessel function term in equation (2.11) that captures the variation of the velocity component parallel to the substrate as a function of the distance normal to it. We note that while equation (2.11) describes a developed steady-periodic flow, analysis (Panton 1996) shows that the transient leading to such a flow condition is fairly short, being (numerically) of the order of ω −1 s.
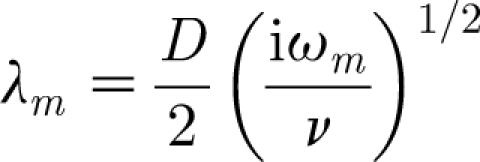
Equation (2.11) applies to a flow oscillating at a single frequency, ω. In general, however, a velocity distribution may be composed of many linearly superposed harmonic sinusoids with arbitrary frequencies, ω m. Furthermore, any transient velocity field can be decomposed into an infinite number of velocity oscillations with distinct frequencies and amplitudes. This suggests that the summation of harmonic sinusoids given by
 |
2.13 |
is also a valid velocity field. In equation (2.13)
 |
2.14 |
and  is the amplitude of the sinusoidal wave associated with the frequency ω
m. Thus, equation (2.13) represents the velocity distribution parallel to a cylindrical substrate as a function of the normal distance to it for an oscillating flow with far-field velocity
  .
.
2.2. Modelling the velocity field due to a flow pulsation
In this study, the velocity function V f of interest corresponds to the motion of the air medium in the vicinity of a filiform hair due to a sudden flow pulsation. As remarked above, the pulsation may be due to a predator lunging towards a prey or it may be the result of a prey moving suddenly in the vicinity of a predator. In many biological situations, the pulsation velocity function V f displays temporal and spatial dependencies and is rich in frequency content.
There is a large body of evidence showing that many transient physical phenomena grow and decay in a Gaussian manner. In other branches of physics, ‘pulsations’, ‘puffs’ or ‘flashes’ are often described by spatial and/or temporal Gaussian functions. In optics, for example, a continuous source of light emanating from a source such as a laser has a spatial Gaussian or apodization function profile (Drake 1996). Likewise, a laser pulsation of short duration is also Gaussian in both time and space. The temporal Gaussian nature of a pulsation can be visualized as being a function of the binary (on–off) switch in the device that produces the pulsation resulting in the impulse characteristics. Mathematical operations of binary switches are commonly expressed by means of rectangular functions. However, as convenient as it may be mathematically, the inertia associated with the device producing the pulsation renders the rectangular functional representation inadequate. Other functions such as the Dirac delta function and the Gaussian function are also used. Gaussian functions are particularly advantageous analytically when transforming from the time domain to the frequency domain, and back. This is because the Fourier mapping of a Gaussian function is also Gaussian. (In this context, the Gaussian function is also known as the frequency curve and its Fourier coefficients as the instrument functions, a notation we retain below.)
In appendix A we show that the instantaneous spatial distribution of velocity at the start of motion ahead of an impulsively accelerated object such as a cylinder or a spider is given by the relationship
 |
2.15 |
In this expression, V S is the velocity of the object or source driving air motion (in the case of a cylinder, its circular flat end face); z is the distance ahead of the object; and R S is a length scale characteristic of the object. Equation (2.15) contains spatial variations only. To capture both the spatial and time variations due to a pulsation of short duration, we assume a more general function of the form
 |
2.16 |
where t is the time with respect to a reference time, t 0, that in this work can be set to zero and β is a constant prescribed to control the pulsation width. With t 0=0 and n=2, equation (2.16) states that at time t=0 the velocity field at any location z is given by equation (2.15), and for t>0 decays with time according to a Gaussian function. As will be shown below, equation (2.16) is motivated by and is a generalization of equation (A 2) in appendix A.
Equation (2.16) is subject to the conditions given by  , where the parameters ϵ and
  are arbitrarily small. This condition says that the function given by equation (2.16) is at least once differentiable (belongs to the class of function ∈C
1), and is defined on the entire time axis. The additional conditions
  and
and  are necessary to obtain a well-behaved Fourier series that converges to the pulsation function. This is accomplished by extending the period of the Fourier series to a sufficiently large extent so that the value of the function is nearly zero and the pulsation function is effectively confined within the time
  . Thus, we wish to express equation (2.16) in terms of a Fourier series and, because the Fourier series of a function converges in the mean of order 2, it is necessary to impose the condition that the function describing the pulsation be at least once continuously differentiable {∈C
1} on the time interval corresponding to one period of the Fourier series expansion (−π, π). While computing the instrument function, the integration is carried out in the limit (−π, π) and the function given by equation (2.16) is assumed to be zero outside this interval. As a consequence, equation (2.16) acquires a jump discontinuity that renders its Fourier series with undesirable, high-frequency perturbations near the ends of the interval (the Gibbs phenomenon). In order to minimize these perturbations, it is necessary to make the period of the Fourier series large compared with the duration of the pulsation. This condition is imposed on equation (2.16) by requiring that the function it describes be arbitrarily small outside
 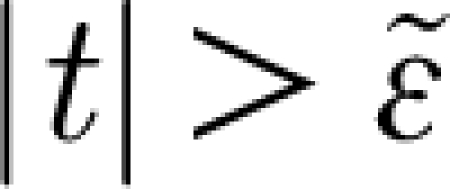 (meaning V(z, t)<ϵ outside a small interval, t, such that
  ).
).
For equation (2.16) to be Gaussian in the time domain, it is necessary that n=2. For this condition, and taking t 0=0, we see that the quantity β is related to the standard deviation σ of the Gaussian function by σ=(2β)−1/2. It can also be shown (see appendix A) that at any time t the kinetic energy in the air medium driven by the pulsation described by equation (2.16) is given by
 |
2.17 |
The Fourier expansion of V(z, t) on (−T, T) corresponding to equation (2.16) is given by
 |
2.18 |
In equation (2.18) ω m=mπ/T which, for T=π, yields ω m=m=0, 1, 2, 3, …, and
 |
2.19 |
Integrating equation (2.19) between −T=−π (s) and T=π (s) yields
 |
2.20 |
where the quantity
 |
2.21a |
is the instrument function. In this expression: (i) the operator Erf( ) denotes the error function and (ii) because in the products (π 2 β) and (πβ) the quantity π has units of s, the first quantity is dimensionless and the second has dimensions s−1. Thus the instrument function can also be written as
 |
2.21b |
As shown by equation (2.18), the Fourier decomposition of the Gaussian pulsation function contains a complete spectrum of sinusoidal waves of amplitude  , m=0, 1, 2, … The instrument function given by equation (2.21b) represents a real function. It indicates that the amplitudes of the decomposed waves decrease exponentially as the frequency ω
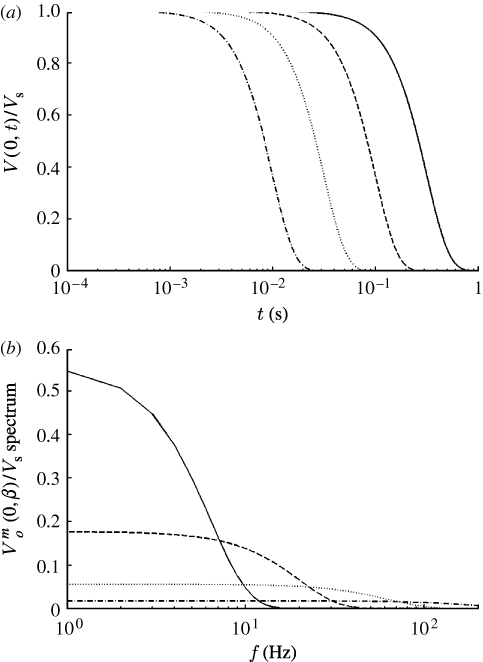
m increases. In Fourier transformations from the time to the frequency domain and vice versa, as t→∞, ω→0 and as t→0, ω→∞. This dependence implies that pulsations of short duration contain high frequencies. The duration of the Gaussian pulsation given by equation (2.16) is controlled by the variable β (s−2) or, equivalently, by the characteristic time scale σ=(2β)−1/2 (s), which is the standard deviation of the pulsation. Thus, values of β=10, 102, 103 and 104 s−2 correspond to characteristic time scales given by σ=224, 70.7, 22.4 and 7.07 ms, respectively. Figure 2
a shows the time variation of dimensionless velocity, V(z, t)/V
S, at the origin (z=0) for Gaussian pulsations with these values of β. The velocity distributions are obtained from equation (2.16) or, equivalently, from the Fourier decomposition given by equation (2.18) together with equation (2.20). The corresponding velocity spectra, shown in figure 2
b, are obtained from equation (2.21b). It is clear that pulsations with large values of β (small values of σ) decay faster. In addition to controlling the pulsation decay time, the parameter β determines the amplitude and frequency content of the velocity spectrum. Thus, with increasing β, velocity waves with higher frequency and lower amplitude are generated.
Figure 2.
(a) Time variation of dimensionless velocity at the origin (z=0) for a number of Gaussian pulsations with different values of β (solid curve, β=10; dashed curve, β=102; dotted curve, β=103; dot-dashed curve, β=104; s−2). (b) Frequency spectra corresponding to the velocity pulsations shown in (a).
The Fourier series defined by equation (2.18) is valid on (−∞<t<∞) and represents the Gaussian pulsation function with period 2π, except in the vicinity of the endpoints of the period where the Fourier sum deviates from the exact value of the function itself. The size of the endpoint regions where the function deviates depends on the number of terms considered in the summation, the size of these regions decreasing with an increasing number of terms. If the period 2π is sufficiently larger than the characteristic time of the pulsation, then the disturbances at the endpoints do not significantly affect the shape of the pulsation. Furthermore, the superposition of waves given by equation (2.18) produces a steady-periodic pulsation function with period 2π. These wave functions can be considered as independent of one another, and the effect of any one of them on the motion of the filiform hair can be studied.
Based on the above considerations, it follows that substitution of equation (2.20) into equation (2.13) yields the velocity field V F due to a Gaussian flow pulsation that includes the effects of viscous damping due to the no-slip condition along a cylindrical substrate. The result is
 |
2.22 |
of which we are only concerned with the real part. Equation (2.22) corresponds to the developed steady-periodic flow and, therefore, any transients associated with errant flow near the endpoints of period 2π have subsided, meaning that they are negligibly small. Because the transient to steady-periodic flow is relatively short (of the order of ω−1 s), the steady-periodic solution can be used with accuracy to investigate pulsation driven hair motions. Henceforth, for convenience of notation, we write  .
.
2.3. Analytical solution of the hair angular momentum equation
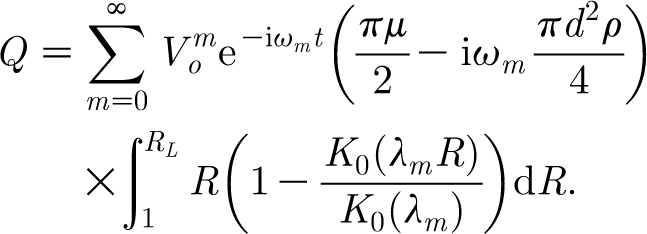
Before solving equation (2.7) analytically, it is convenient to evaluate the integrals appearing in the forcing function defined by equation (2.10). With reference to figure 1 and taking for V f the form given by equation (2.22), the forcing function becomes
 |
2.23 |
The integral in equation (2.23) is readily evaluated along the non-dimensional length of the filiform hair R=1+y/(D/2) to yield the final form of the forcing function given by
 |
2.24 |
where
 |
2.25 |
Equation (2.7) can now be rewritten as
 |
2.26 |
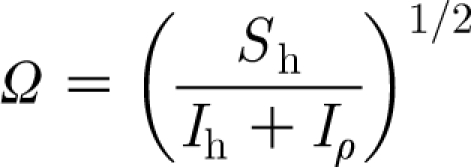
where the natural frequency, Ω, of the hair is given by
 |
2.27 |
and its dimensionless damping factor, ζ, can be found from
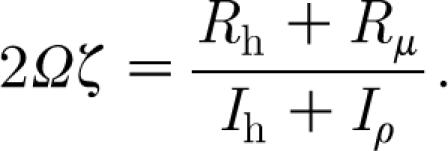 |
2.28 |
The general solution of equation (2.26) consists of the homogeneous (θ H) and particular (θ P) solutions. For a second-degree oscillator problem, there are two functions that satisfy the homogeneous equation and a linearly independent superposition of these two solution functions also represents a homogeneous solution. The general solution of equation (2.26) contains two arbitrary constants that are determined from two initial conditions. A characteristic of the general solution is that a subset of this solution (the homogeneous solution) decays to zero with time (the transient solutions). The general solution of equation (2.26) is, therefore,
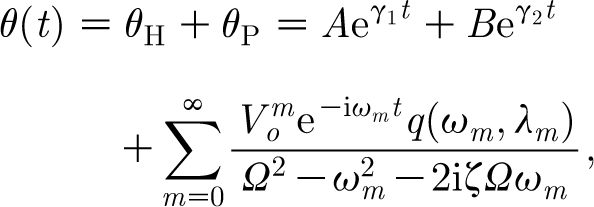 |
2.29 |
with
 |
2.30 |
Equation (2.30) shows that for a given damping factor, ζ, the decay times 1/γ
1,2 are inversely proportional to the natural resonance frequency, Ω. Because the real parts of γ
1 and γ
2 are Re(γ
1)<0 and Re(γ
2)<0, the homogeneous (transient) solution θ
H decays to zero exponentially with time. However, the particular solution also decays with time because the pulsation is of short duration. The constants A and B are determined by requiring that the general solution satisfies the initial conditions,  . Application of these initial conditions yields the constants A and B required by the general solution, equation (2.29). The result is
 |
2.31 |
 |
2.32 |
Substituting these expressions for A and B into equation (2.29) gives
 |
2.33 |
Corresponding expressions for the angular velocity and angular acceleration are given by
 |
2.34 |
and
 |
2.35 |
3. Results
Equations (2.33)–(2.35) were programmed using Fortran and Matlab to calculate the angular displacement, velocity and acceleration of spider trichobothria and cricket cercal filiform hairs exposed to a range of flow pulsation conditions. The MeD1 and TiDA1 trichobothria of the spider C. salei (Barth et al. 1993) and the cercal hairs of the cricket G. bimaculatus were explored. Values for the hair diameter (d), the torsional restoring constant (S h) and the damping constant (R h) as a function of hair length (L) were specified from the empirical allometric functions provided in table 1 in Humphrey & Barth (2008) for these hairs. Likewise, hair and air medium physical properties were specified from table 2 in Humphrey & Barth (2008).
Guided by the analysis in appendix A for the experimental results obtained by Dangles et al. (2006) and Casas et al. (2008), in most of our calculations of hair angular displacement, velocity and acceleration, we have fixed the characteristic pulsation velocity and length scales to V S=0.25 m s−1 and R S=0.75 cm, yielding an initial pulsation energy of E P(0)=3.21×10⁻⁸ J, and have investigated values of β=102, 103 and 104 s−2 corresponding to characteristic pulsation time scales given by σ (=(2β)−1/2)=70.7, 22.4 and 7.07 ms, respectively. These values are of biological interest and overlap with the ranges investigated experimentally by these authors. In particular, for fixed values of V S and R S, varying β corresponds to a spider lunging at a cricket with the same initial pulsation energy and velocity but with different time rates of decay for these two quantities. Thus, with reference to equation (2.17), for fixed values of V S and R S, at any time t, the energy E P(t) in a pulsation decreases with increasing β or, equivalently, with decreasing pulsation time scale σ. One can, instead, explore the effects on hair motion patterns of different (V S, R S) pairs generating similar levels of the initial pulsation energy E P(0). For example, a large spider with a low initial lunge velocity and a small spider with a large initial lunge velocity can generate similar initial pulsation energies, but the spatial and temporal decays of the velocity fields respectively generated can differ. To explore this effect, we have also calculated hair motion patterns for pulsations with β=103 s−2 having the following (V S, R S) pairs and initial energy E P(0): (V S=9.5 cm s−1, R S=3.8 mm), E P(0)=6.02×10⁻¹⁰ J, corresponding to a lunging spider (see appendix A); (V S=9.5/2 cm s−1, R S=2×3.8 mm), E P(0)=1.20×10⁻⁹ J; and (V S=2×9.5 cm s−1, R S=3.8/2 mm), E P(0)=3.01×10⁻¹⁰ J.
Owing to the linear dependence on the pulsation characteristic velocity V S in equation (2.16) and equation (2.20), if all parameters are fixed and V S alone is varied, the corresponding changes in hair angular displacement, velocity and acceleration scale linearly with the change in V S. This is clearly shown by the forms of equations (2.33)–(2.35), and explains why we have limited the bulk of the calculations to the representative value given by V S=0.25 m s−1.
It is important to note that in this study we are not reproducing the entire space–time history of the flow fields explored by Dangles et al. (2006) using a suddenly accelerated cylinder and observed by Casas et al. (2008) for a lunging spider. Instead, we are concerned with the flow fields generated by relatively short but energetic displacements of such objects corresponding to small times after the start of motion. As shown in appendix A, from the data of Dangles et al. (2006) and Casas et al. (2008), we learn that the z dependence of the horizontal z component of velocity shortly after the start of motion of a cylinder or a spider is very well approximated by the local field due to a sphere in translational motion. Because for the conditions of interest the air medium can be treated as incompressible, it is reasonable to assume that this z dependence of velocity is established essentially instantaneously, and that it is preserved throughout the lifetime of a short duration pulsation. For the reasons explained above, we have chosen a Gaussian function to modulate the time dependence of the pulsations investigated. In the remainder of this section, we present the results obtained from the analytical model, and in the next section we discuss some of their implications.
3.1. Values of hair parameters
Table 1 provides the values of the parameters characterizing the three types of hairs investigated. For these hairs it is always the case that I h≫Iρ and R h≈R μ. The cricket cercal hairs have values of I h that are 50 to 80 per cent smaller than the spider trichobothria. As a consequence, because the values of S h are comparable among the three types of hairs, the cercal hair natural frequencies calculated using equation (2.27) are larger. Note that the values of natural frequency yielded by equation (2.27) are larger than the preferred (or practical) resonance frequencies of these hairs. In fact, the natural frequencies of the present analysis correspond to the frequencies at which hair velocity, as opposed to displacement angle, is maximized in a steady-periodic flow (Humphrey et al. 2001).
Table 1.
Total inertia I h+I ρ (N m s2 rad−1), torsional restoring constant S h (N m rad−1), total damping constant R h+R μ (N m s rad−1) and calculated natural frequency f n (=Ω/2π, s−1), for the TiDA1 and MeD1 trichobothria of C. salei and the cercal hairs of the cricket G. bimaculatus. (The values for Ω are determined using equation (2.27) in the text, and those for S h and R h from the allometric relationships provided in table 1 of Humphrey & Barth (2008). Note from equation (2.30) that hair motion can be overdamped [(Ωζ)2−Ω 2>0] as in the case of the cercal hairs, or underdamped [(Ωζ)2−Ω 2<0] as in the case of the TiDA1 and MeD1 trichobothria, the former being more underdamped than the latter; see figures 3–6 and their discussion. The dimensionless damping factor ζ is obtained from equation (2.28). For these hairs, I h≫I ρ and R h≈R μ.)
| hair type and length | TiDA1 | MeD1 | cercal |
|---|---|---|---|
| 1000 μm | I h+I ρ=1.69×10⁻¹⁷ | I h+I ρ=8.29×10⁻¹⁸ | |
| S h=1.37×10⁻¹¹ | S h=1.03×10⁻¹¹ | S h=1.90×10⁻¹¹ | |
| R h+R μ=1.34×10⁻¹⁴ | R h+R μ=1.35×10⁻¹⁴ | R h+R μ=3.85×10⁻¹⁴ | |
| f n=143.32 | f n=124.67 | f n=240.97 | |
| (Ωζ)2−Ω 2=−1.65×10⁴ | (Ωζ)2−Ω 2=−1.15×10³ | (Ωζ)2−Ω 2=7.92×10⁴ | |
| ζ=0.44 | ζ=0.51 | ζ=1.54 | |
| 500 μm | I h+I ρ=1.38×10⁻¹⁸ | I h+I ρ=4.09×10⁻¹⁹ | |
| S h=8.82×10⁻¹² | S h=2.53×10⁻¹² | S h=5.97×10⁻¹² | |
| R h+R μ=2.07×10⁻¹⁵ | R h+R μ=2.22×10⁻¹⁵ | R h+R μ=5.43×10⁻¹⁵ | |
| f n=402.78 | f n=215.75 | f n=607.91 | |
| (Ωζ)2−Ω 2=−1.48×10⁵ | (Ωζ)2−Ω 2=−3.00×10⁴ | (Ωζ)2−Ω 2=7.53×10⁴ | |
| ζ=0.30 | ζ=0.60 | ζ=1.74 | |
| 250 μm | I h+I ρ=1.13×10⁻¹⁹ | I h+I ρ=2.02×10⁻²⁰ | |
| S h=5.70×10⁻¹² | S h=6.20×10⁻¹³ | S h=1.88×10⁻¹² | |
| R h+R μ=3.51×10⁻¹⁶ | R h+R μ=4.21×10⁻¹⁶ | R h+R μ=7.70×10⁻¹⁶ | |
| f n=1131.96 | f n=373.38 | f n=1533.60 | |
| (Ωζ)2−Ω 2=−1.22×10⁶ | (Ωζ)2−Ω 2=−5.08×10⁴ | (Ωζ)2−Ω 2=6.90×10⁴ | |
| ζ=0.22 | ζ=0.80 | ζ=1.98 | |
With reference to equation (2.30), evaluation of the radicand  for these hairs reveals that the motion of the cercal hairs is overdamped while that of the spider trichobothria is underdamped, the TiDA1 hairs being less damped than the MeD1. Similarly and in agreement with this finding, the values of the damping factor, ζ, given by equation (2.28) are smallest for the TiDA1 hairs and the largest for the cercal hairs.
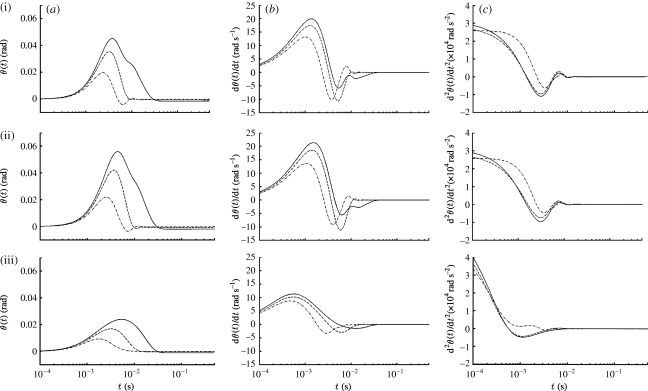
3.2. Dependence of hair motion on hair length
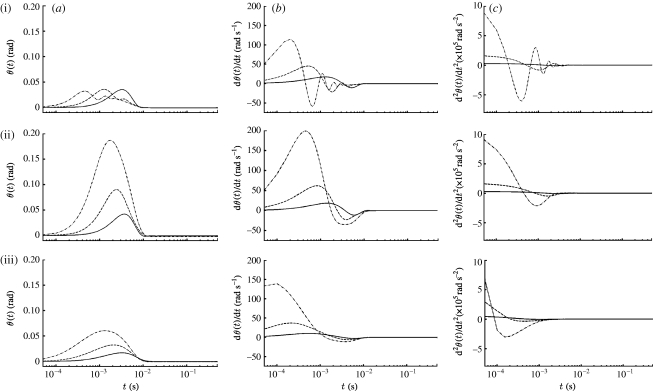
The dependence of hair motion on hair length is illustrated in figure 3 for spider trichobothria and cricket cercal hairs of length 1000, 500 and 250 μm at a location z=1.5 cm from the pulsation source. The pulsation characteristic velocity, length and time scales are V S=0.25 m s−1, R S=0.75 cm and σ=(2β)−1/2=22.4 ms, respectively. The dependence of hair motion patterns on hair length is traced back to the length-dependent terms in equation (2.7). In general, because of their smaller total inertia (I h+I ρ), torsional restoring constant (S h) and total damping constant (R h+R μ), short hairs attain larger maximum displacement angles, velocities and accelerations than long hairs, and at earlier times; the time delays between hairs being especially marked for the TiDA1 hairs. The displacement angles of the TiDA1 hairs are an exception in that, compared with the MeD1 and cercal hairs, their maximum values show virtually no dependence on hair length. Compared with the TiDA1 hairs, the displacement angles of the cercal hairs show a somewhat stronger dependence on hair length but, in both cases, the relatively small displacement angles are attributed to the larger values of S h for these hairs (table 1). The lower values of S h for the MeD1 hairs account for their larger values of angular displacement and velocity. The patterns of motion (displacement, velocity and acceleration) displayed by the cercal hairs are similar to those of the MeD1 hairs but, as expected from the entries for the damping factor ζ in table 1, are more strongly damped. By contrast, the patterns of motion of the TiDA1 hairs display noticeable underdamping, especially for the shortest (250 μm) hair. The plots show that in all cases at this location from the source, hair motion ceases within approximately 10 ms even though the pulsation characteristic time is 22.4 ms. Additional results for the effects of hair length on hair motion patterns are presented in relation to figure 6 discussed below.
Figure 3.
Time variations of the (a) angular displacement, (b) velocity and (c) acceleration of (i) TiDA1, (ii) MeD1 spider trichobothria and (iii) cricket cercal hairs of length 250 (dot-dashed curve), 500 (dashed curve) and 1000 (solid curve) μm at location z=0.015 m for a Gaussian pulsation with V S=0.25 m s−1, R S=7.5×10⁻³ m and β=103 s−2 (σ=2.24×10⁻² s).
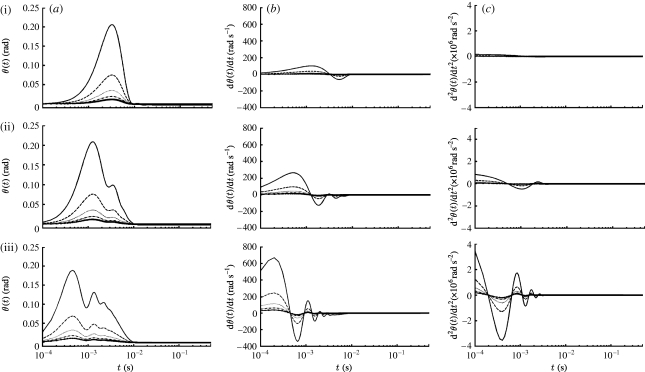
Figure 6.
Time variations of the (a) angular displacement, (b) velocity and (c) acceleration of TiDA1 spider trichobothria of length (i) 1000, (ii) 500 and (iii) 250 μm at five z locations (solid curve, 0.005 m; dashed curve, 0.010 m; dotted curve, 0.015 m; dash-dotted curve, 0.020 m; solid curve with crosses, 0.025 m) for a Gaussian pulsation with V S=0.25 m s−1, R S=7.5×10⁻³ m and β=103 s−2 (σ=2.24×10⁻² s).
3.3. Dependence of hair motion on pulsation time scale
The effects on hair motion patterns due to the pulsation characteristic time scale are illustrated in figure 4 for hairs of equal length (1000 μm) at a location z=1.5 cm from the pulsation source. As above, the pulsation characteristic velocity and length scales are V S=0.25 m s−1 and R S=0.75 cm, respectively. The values of β explored are 102, 103 and 104 s−2 corresponding to characteristic σ time scales of 70.7, 22.4 and 7.07 ms. Except for the details of their variations, the patterns of motion displayed by the three types of hairs are fairly similar. It is clear from equations (2.16) and (2.17) that the time rates of decay of velocity and energy in a pulsation increase exponentially with increasing β. Not surprisingly, therefore, for most of the duration of a pulsation, hair angular displacement and velocity (and for small time acceleration also) are smaller for the pulsations with larger values of β. As in figure 3, because the motions of the spider trichobothria are underdamped, these hairs display relatively large negative overshoots in their velocities and accelerations, which are ultimately overcome by the torsional restoring torques of the hairs. Similar but much weaker negative overshoots are displayed by the cercal hairs. The patterns of motion in the overshoot regions are rendered complex owing to the different spectral distributions of energy among the three pulsations. Additional results concerning the dependence of hair motion on pulsation energy are presented in relation to figure 8 discussed below.
Figure 4.
Time variations of the (a) angular displacement, (b) velocity and (c) acceleration of (i) TiDA1, (ii) MeD1 spider trichobothria and (iii) cricket cercal hairs of length 1000 μm at location z=0.015 m for a Gaussian pulsation with V S=0.25 m s−1, R S=7.5×10⁻³ m, and β=102 (solid curve), 103 (dashed curve) and 104 (dot-dashed curve) s−2 (σ=7.07×10⁻², 2.24×10⁻², 7.07×10⁻³ s).
Figure 8.
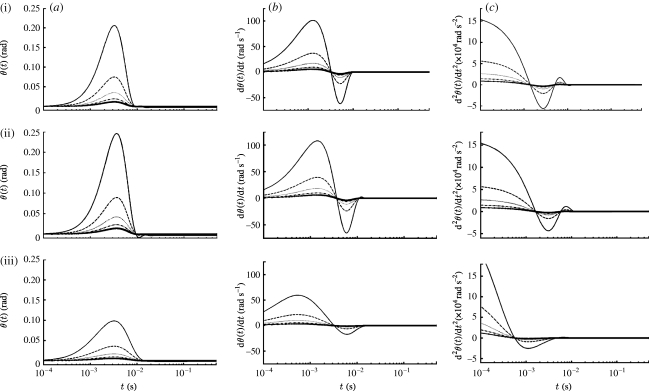
Time variations of the (a) angular displacement, (b) velocity and (c) acceleration of cricket cercal hairs of length 1000 μm at five z locations (solid curve, 0.005 m; dashed curve, 0.010 m; dotted curve, 0.015 m; dash-dotted curve, 0.020 m; solid curve with crosses, 0.025 m) for three Gaussian pulsations ((i) V S=9.5/2 cm s−1, R S=2×3.8 mm, (ii) V S=9.5 cm s−1, R S=3.8 mm, (iii) V S=2×9.5 cm s−1, R S=3.8/2 mm) corresponding to the initial velocity conditions shown in figure 7. The pulsations have the same time scale β=103 s−2 (σ=2.24×10⁻² s) but different initial energy E P(0), and different velocity and length scales; see (figure 7).
3.4. Dependence of hair motion on distance from pulsation source
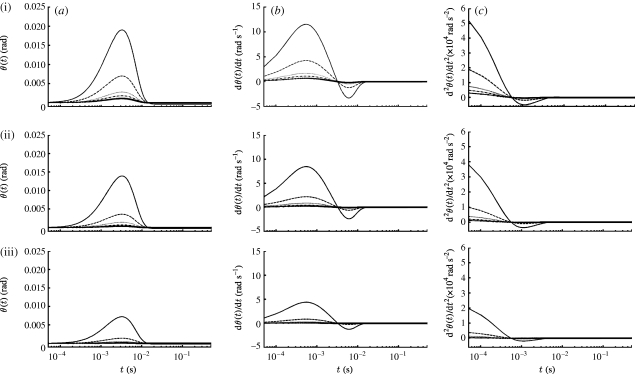
The analysis and experimental data in appendix A show that the V z component of velocity acting on a filiform hair decreases spatially according to (1+(z/R S)−3), where z is the distance between the hair and the pulsation source. Using equation (2.16) with n=2, it is easy to show, for example, that at the start of motion (t=0), V(z, t)/V S=0.01 at z/R S=5.64, and that V(z, t)/V S=0.001 at z/R S=11.0. At later times, t>0, these velocity ratios are smaller by the factor e−βt. Time variations of the angular displacement, velocity and acceleration of TiDA1, MeD1 spider trichobothria and cricket cercal hairs of length 1000 μm at five z locations are plotted in figure 5. As in figure 3, the results are for a Gaussian pulsation with characteristic velocity, length and time scales V S=0.25 m s−1, R S=0.75 cm and σ=22.4 ms. While the spider trichobothria attain larger maximum angular displacements than the cricket cercal hairs, all three types of hairs acquire their maximum displacements at essentially the same time. Similarly, the trichobothria attain larger maximum angular velocities than the cercal hairs, but the cercal hairs reach their peak values sooner. All three types of hairs display negative velocity and acceleration overshoots that are significantly larger in the case of the underdamped trichobothria. Of all the hairs, the TiDA1 trichobothria are the most underdamped and, consequently, they are the most responsive to the spectral content of the pulsation. This is more clearly shown in figure 6, which compares the motion patterns of three TiDA1 hairs of different lengths to the same pulsation conditions of figure 5. The plots in the figure show that: (i) the angular displacement, velocity and acceleration responses of TiDA1 hairs to the spectral content of the flow increase significantly with decreasing hair length and proximity to the pulsation source and (ii) short hairs respond sooner to the pulsation than long ones (see figure 3 also). In this regard, the time delay between the maximum angular displacement of a 250 μm long TiDA1 trichobothrium and one that is 1000 μm long is approximately 3 ms.
Figure 5.
Time variations of the (a) angular displacement, (b) velocity and (c) acceleration of (i) TiDA1, (ii) MeD1 spider trichobothria and (iii) cricket cercal hairs of length 1000 μm at five z locations (solid curve, 0.005 m; dashed curve, 0.010 m; dotted curve, 0.015 m; dash-dotted curve, 0.020 m; solid curve with crosses, 0.025 m) for a Gaussian pulsation with V S=0.25 m s−1, R S=7.5×10⁻³ m and β=103 s−2 (σ=2.24×10⁻² s).
3.5. Dependence of hair motion on pulsation velocity and length scales
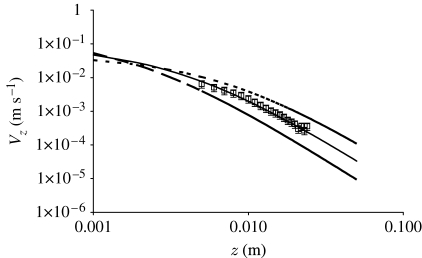
In appendix A we show that the maximum kinetic energy in the air medium ahead of an object generating a Gaussian flow pulsation is produced at the start of motion (equation (A 6)). Thereafter, the kinetic energy decays with time (equation (A 7)). It is possible to generate pulsations having similar initial kinetic energies but with different characteristic velocity and length-scale pairs (V S, R S). Thus two objects such as a large spider lunging at a low velocity and a small spider lunging at a high velocity can generate respective pulsations having similar initial energies but with different spatial and temporal decays of their respective velocity fields. Figure 7 shows spatial distributions of the initial velocity fields associated with three spiders having different (V S, R S) pairs but similar initial energies E P(0). The reference case is that with (V S=9.5 cm s−1, R S=0.38 cm) corresponding to a spider in the experimental study of Casas et al. (2008), already discussed in appendix A. Relative to this reference, the other two cases correspond to: (i) a spider twice the size lunging at half the velocity and (ii) a spider half the size lunging at twice the velocity. The results in figure 7 show clearly that large spiders lunging at low velocities generate larger telltale far-field velocity signals than smaller spiders lunging at higher velocities. For all three of the cases shown in figure 7, the 30 μm s−1 velocity threshold quoted by Casas et al. (2008) for stimulating cercal hairs is exceeded at a distance z=3 cm. It is also clear from the trends in these data that, depending on spider size and velocity, telltale far-field signals achieving the 30 μm s−1 velocity threshold can, in principle, be attained for values of z as large as 10 cm.
Figure 7.
Comparison between the measured instantaneous spatial variation of the horizontal component of velocity ahead of a lunging spider (P. lugubris; squares) close to the start of motion (Casas et al. 2008) and calculations based on three characteristic length and velocity scale pairs (V S, R S) using equation (A 3) in appendix A, or using equation (2.16) with t=0. The calculations with (V S=9.5 cm s−1, R S=3.8 mm) and E P(0)=6.02×10⁻¹⁰ J (solid curve) correspond to the lunging spider (see figures 10 and 12 and their discussion). The other two cases correspond to (V S=9.5/2 cm s−1, R S=2×3.8 mm) and E P(0)=1.20×10⁻⁹ J (dashed curve) and (V S=2×9.5 cm s−1, R S=3.8/2 mm) and E P(0)=3.01×10⁻¹⁰ J (long-dashed curve), respectively.
Figure 8 shows time variations of the motion patterns for 1000 μm long cricket cercal hairs at five z locations for the above three pulsations with β=103 s−2. For the z locations plotted, the results show that the hairs exposed to the pulsation generated by the largest, slowest moving spider experience significantly larger angular displacements, velocities and accelerations than the hairs exposed to the smallest, fastest moving spider.
4. Discussion
4.1. Spectral dynamics of hair response
The dependence of hair motion on hair length for the pulsation flow conditions of this study differs from that reported in earlier work. In the case of filiform hairs exposed to fully developed steady-periodic flows oscillating at a single frequency, it is known that maximum angular displacement (at displacement resonance frequency) increases with increasing hair length, while maximum angular velocity (at velocity resonance frequency) increases with decreasing hair length (Barth et al. 1993; Humphrey et al. 2001; Humphrey & Barth 2008). By contrast, for hairs exposed to the short flow pulsations investigated here, we find that hair angular displacement, velocity and acceleration all increase with decreasing hair length and, as a consequence, that short hairs are significantly more responsive than long hairs to the pulsations.
In a developed flow oscillating at a single frequency f parallel to a flat substrate, the velocity distribution decreases exponentially towards the substrate and the thickness of the boundary layer δ along the substrate varies with frequency according to  (Humphrey et al. 1993). For a developed flow oscillating along a cylindrical substrate such as a spider leg or cricket cercus, the boundary-layer thickness is actually smaller than this because of the additional inverse dependence of velocity on a term (1+y(D/2))1/2 (equation (2.25); Humphrey et al. 1993) where y and D are defined in figure 1. In such flows, at any time and frequency, long hairs will extend further than short hairs into the high-velocity region of the boundary layer and, as a consequence, will experience larger torques leading to larger angular displacements. By contrast, as shown by equation (2.22), the flow created by a pulsation near to a surface consists of an infinite number of velocity waves covering a spectrum of frequencies the sum of which defines the flow field. Each of these waves has its own characteristic frequency f and associated pseudo-boundary-layer thickness δ. Figure 2
b shows that the velocity wave amplitudes associated with a pulsation with, for example, β=103 s−2, have essentially the same magnitude over the energy containing range of frequencies. As a consequence, in such a flow, both short and long hairs experience very similar distributions of velocity as a function of distance from the substrate and, therefore, also experience the same drag forces per unit length generating the torques acting on these hairs. However, because of their smaller total inertia, torsional restoring constant and total damping constant, short hairs attain larger maximum displacement angles, velocities and accelerations than long hairs, and at earlier times, when exposed to a pulsation.
The spectral approach of this study reveals that for the biologically relevant pulsation conditions investigated, the frequencies of the velocity waves generated (lower than 200 Hz) overlap with the natural frequencies of long spider hairs but not with the natural frequencies of medium length and short spider hairs or of any of the cricket hairs (table 1). This means that the waves inducing hair motion are only marginally or not at all tuned to the natural frequencies of these hairs, the prime movers of the hairs then being velocity waves with f<200 Hz. Because the spectral distribution of wave amplitudes depends on the pulsation characteristic time scale σ=(2β)−1/2 and the amplitudes of the waves depend on the characteristic velocity scale V S (figure 2 b), it is possible to conceive of very intense, short duration pulsations containing more energetic velocity waves at higher frequencies than explored here. However, the biological relevance of such pulsations must be scrutinized carefully, as they would correspond to very quickly decaying events with characteristic time scales less than 7 ms, approximately. The analysis of such conditions has been beyond the scope of this study.
Analytical consideration of equations (2.29) and (2.30) shows that the response of motion-sensing hairs to the spectral content of a flow pulsation is favoured by underdamped hair oscillation conditions. A measure of hair damping is given by the damping factor ζ that is obtained from equation (2.28) using equation (2.27). Overdamped hair motion occurs for ζ>1 and underdamped for ζ<1. The values of ζ provided in table 1 show that the cercal hairs of the cricket G. bimaculatus are overdamped, while the trichobothria of the spider C. salei are underdamped. In particular, the relatively low damping associated with the TiDA1 spider hairs renders them especially responsive to the spectral content of a flow pulsation (figures 3 and 6).
Combining equations (2.27) and (2.28) yields an explicit expression for ζ given by
 |
4.1 |
From this it follows that
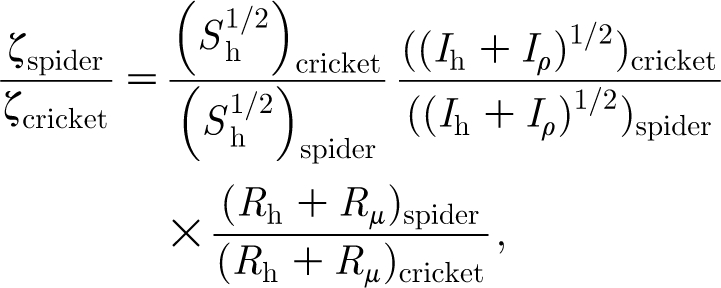 |
4.2 |
or, equivalently,
| 4.3 |
where the terms in equation (4.2) have been renamed for plotting purposes.
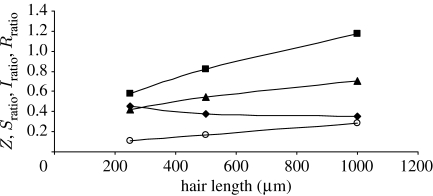
Values for Z, S ratio, I ratio and R ratio are plotted in figure 9 as a function of hair length using the data for the spider TiDA1 trichobothria and cricket cercus hairs given in table 1. (Very similar results are obtained for the spider MeD1 hairs relative to the cricket hairs.) Although S ratio increases with hair length, it is never much larger than 1 and, because both the I ratio and R ratio terms remain smaller than 1 for all hair lengths, the values of Z=ζ spider/ζ cricket are significantly smaller than 1 for all hair lengths. It is clear from figure 9 that the primary terms determining the small values of Z are I ratio and R ratio. Thus, it is the larger values of I h and the smaller values of (R h+R μ) for the spider trichobothria that primarily determine their smaller damping constants relative to the cricket cercus hairs. Since spiders feed on a variety of walking and flying insects, not just crickets, having trichobothria with relatively low damping constants translates into having motion-sensing hairs with increased sensitivity over larger frequency ranges.
Figure 9.
Variation of Z=ζ
spider/ζ
cricket,  , I
ratio=((I
h+I
ρ)1/2)cricket/((I
h+I
ρ)1/2)spider and R
ratio=(R
h+R
μ)spider/(R
h+R
μ)cricket with hair length for the case of spider TiDA1 trichobothria relative to cricket cercus hairs (squares, S
ratio; triangles, I
ratio; diamonds, R
ratio; circles, Z). Results are based on the data in table 1.
4.2. Hair sensitivity and detection ranges
We know from equation (2.16) that the velocity field associated with a pulsation decays relatively quickly with both distance from the pulsation source and time (see figure 2 a and appendix A). Using the PIV technique, Casas et al. (2008) measured the motion of air ahead of running wolf spiders (P. lugubris) near to the start of motion and concluded that the electrophysiological velocity threshold of 30 μm s−1 for triggering action potentials from cricket filiform hairs could be attained at a distance 3 cm ahead of a spider of body size 3.8 mm running at approximately 9.5 cm s−1. Figure 7 shows calculations of the flow field at t=0 induced by such a spider (also presented and discussed in appendix A) and for two other spiders: (i) one half the size moving at twice the velocity and (ii) one twice the size moving at half the velocity. Two points are especially noteworthy. The first is that analytical extrapolation of the reference case, corresponding to the study by Casas et al. (2008), yields an airflow velocity of approximately 140 μm s−1 at z=3 cm, significantly exceeding the electrophysiological velocity threshold of 30 μm s−1 for triggering action potentials. The second is that even the smallest spider with the fastest spatial decay of velocity generates an airflow velocity of approximately 40 μm s−1 at z=3 cm, also exceeding the electrophysiological velocity threshold. In addition, we know from the data plotted in figure 8 that in the case of the two largest spiders, the maximum displacement angle of the 1000 μm cercal hair at z=2.5 cm falls in the threshold angle range 0.01°–0.1° (Humphrey & Barth 2008) for eliciting action potentials. The conclusion is that, for the conditions examined, the analysis supports the notion that both electrophysiological velocity and displacement angle thresholds for cricket cercal hairs can be exceeded at distances as large as 3 cm from the pulsation source. (The same conclusion applies to the spider trichobothria examined.) However, it is doubtful that the motion of a single hair triggers escape behaviour in a cricket (or, for that matter, attack behaviour in a spider). Rather it is the response of a group of hairs to spatial and temporal variations of the air velocity, that induces such behaviours (Barth 2002a ; Dangles et al. 2008).
Reaction times ranging from approximately 50 ms to approximately 200 ms have been reported by Tauber & Camhi (1995) for three modes of escape behaviour exhibited by the cricket G. bimaculatus when exposed to airflow pulsations. From the study by Dangles et al. (2006) using an accelerated cylinder, it is possible to estimate a characteristic reaction time associated with the escape behaviour of the wood cricket N. sylvestris. These authors report that the rate of escape success of Nemobius is the largest for approaching cylinder velocities ranging from 11 cm s−1 to 25 cm s−1, and that the rate drops off markedly for cylinder velocities larger than 33 cm s−1. They also report that the median distance from the approaching cylinder at which the crickets initiate escape behaviour is 1.6 cm. Assuming that the cylinder velocity (i) increased linearly for the first 1 cm of travel to acquire its steady-state value and (ii) thereafter remained at this velocity, it is possible to analytically estimate the cricket reaction time. Taking 30 cm s−1 as a characteristic steady-state value of an approach velocity that differentiates between successful and unsuccessful cricket escapes, the estimated reaction time for Nemobius is approximately 110 ms, a value that lies in the range measured by Tauber & Camhi (1995) for Gryllus. Inspection of the hair motion patterns presented in this study for the cercal hairs of Gryllus shows that the characteristic response time for a hair to achieve a threshold displacement angle ranging between 0.01° and 0.1° is typically 10 ms or less, a value considerably smaller than the cricket typical reaction time.
The analytical methodology and results presented in this study allow the consideration of the possible responses of multiple hairs of different lengths, at different times and spatial locations, exposed to pulsations of different velocity, length and time scales. While the analysis ignores possible medium viscous coupling between or among filiform hairs, these have been shown to be quite small for the trichobothria of C. salei (Bathellier et al. 2005) and relatively weak for the cercal hairs of the cricket G. bimaculatus (Humphrey & Barth 2008). Irrespectively, even in the presence of weak viscous coupling, none of the main findings of the present study is significantly altered; in particular that for the short flow pulsations investigated here, hair angular displacement, velocity and acceleration all increase with decreasing hair length and, as a consequence, that short hairs are significantly more responsive than long hairs to the pulsations.
Acknowledgments
The authors express their sincere thank to Prof. Jérôme Casas for helpful discussions and for providing the experimental data in appendix A. Part of the material contained in this paper was developed while J.A.C.H. was a guest professor in the Department of Neurobiology and Cognition Research at the University of Vienna during the summer of 2008, through the courtesy extended by Prof. Friedrich Barth. We are indebted to Prof. Barth for valuable comments and suggestions made concerning an early version of this paper. J.A.C.H. also gratefully acknowledges funding received in support of this study under a DARPA BioSenSE Award via AFOSR grant no. FA9550-05-1-0459, and under the Office of Naval Research MURI award N00014-08-1-0642 through the University of Virginia.
Appendix A. Instantaneous velocity field ahead of an impulsively accelerated object at the start of motion
A.1. Preliminary considerations
In experimental investigations using a particle image velocimeter, Dangles et al. (2006) and Casas et al. (2008) have, respectively, measured instantaneous spatial distributions of the horizontal velocity component, near to the start of motion, ahead of a lunging spider and ahead of the circular flat end face of a cylinder accelerated along its axis parallel to a flat substrate. These data are shown in figures 10–12. The data for the lunging spider have been taken from fig. 4 of Casas et al. (2008), while those for the impulsively accelerated cylinder have been provided by J. Casas (2008, personal communication). We show here that these velocity distributions are accurately represented by the local flow field of a dipole source corresponding to a constant volume sphere oscillating at low frequency.
Figure 10.
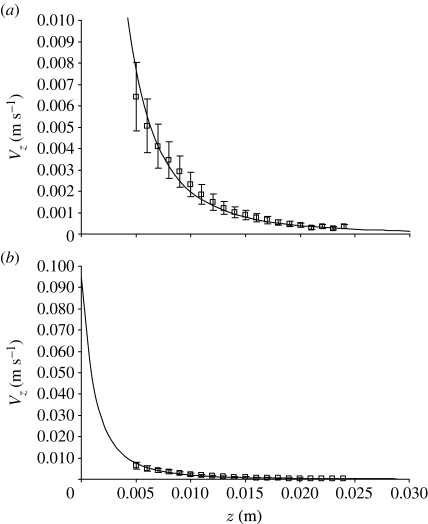
(a) Instantaneous horizontal variation of the horizontal component of velocity ahead of a lunging spider (P. lugubris) close to the start of motion. The measurements were made with a particle image velocimeter (Casas et al. 2008) and are shown with their experimentally determined uncertainties. The calculations are made assuming the flow field is due to a translating sphere of radius R S=3.8 mm (equation (A 3)). (b) Theoretical extrapolation to the body surface of the spider (z=0) yields a starting body velocity V S=9.5 cm s−1, corresponding closely to the mean velocity 9.44 cm s−1 observed in the experiments for spiders with mean body sizes 3.6 mm. (Squares, measured; solid curve, calculated.)
Figure 11.
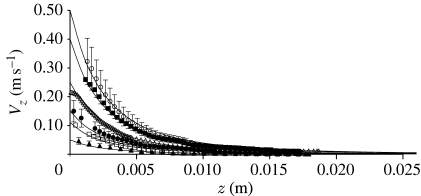
Instantaneous horizontal variations of the horizontal component of velocity ahead of the flat circular end surface of a cylinder impulsively accelerated from rest along its axis, parallel to a horizontal surface at a distance 2 mm from the side of the cylinder. The measurements (Dangles et al. 2006), shown as symbols, were made with a particle image velocimeter after the cylinder attained steady motion for the nominal starting V S velocities shown in the figure (open circles, 0.50 ms−1; filled squares, 0.40 m s−1; open triangles, 0.25 m s−1; filled circles, 0.15 m s−1; open squares, 0.11 m s−1; filled triangles, 0.05 m s−1). To avoid clutter in the figure, typical estimated uncertainty bars are shown only for the data corresponding to starting velocities V S=0.05, 0.15 and 0.50 m s−1. The diameter and length of the cylinder are 8 mm and 80 mm, respectively. The calculations, shown as solid lines, are made assuming the flow field is due to a translating sphere of radius R S=7.5 mm (equation (A 3)).
Figure 12.
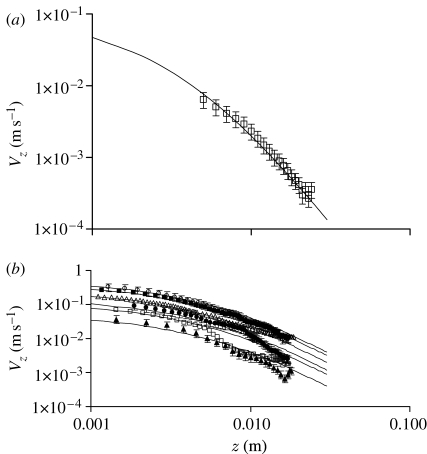
Log–log plots of the data shown in figures 10 and 11. (a) The experimental velocity data for a lunging spider follow the variation due to a translating sphere to within the uncertainty in the measurements (squares, measured; solid curve, calculated). (b) The experimental velocity data for an impulsively accelerated cylinder also follow the variation due to a translating sphere to within the uncertainty in the measurements. A notable exception is displayed by the data corresponding to the starting velocity V S=0.11 m s−1 which, for z>6 mm, approximately, departs significantly from the expected translating sphere behaviour (open circles, 0.50 m s−1; filled squares, 0.40 m s−1; open triangles, 0.25 m s−1; filled circles, 0.15 m s−1; open squares, 0.11 m s−1; filled triangles, 0.05 m s−1).
The equation describing the horizontal velocity component, V z, of the inviscid flow field generated by a sphere oscillating in the horizontal plane at large distances from any surface, and modelled as a dipole source, is given by (Kalmijn 1988)
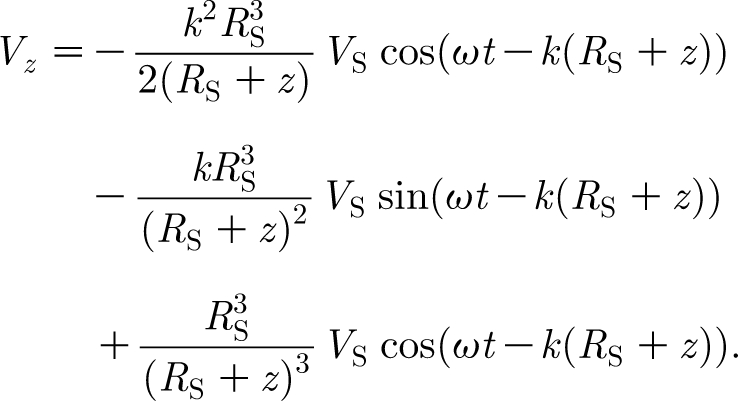 |
A1 |
In this equation, R S (m) is the sphere radius; V S (m s−1) is the sphere velocity amplitude; ω (rad s−1) is the sphere oscillation frequency; z (m) is the horizontal distance from the sphere surface to the point of interest; and k (=ω/c=2πf/c; m−1) is the wavenumber where c (=343 m s−1) is the speed of sound in air at 20°C. The first term of equation (A 1) describes the propagating sound wave and leads V S by 180 degrees. The second term accounts for the intermediate flow and leads V S by 90 degrees. The third term represents the local incompressible flow and is in phase with V S. As explained in §1, the smallest characteristic time scale associated with a unidirectional cylinder displacement is 0.08 s. If the cylinder were actually executing oscillatory motion, it would have a time period T=4×0.08=0.32 s, a frequency f=3.13 Hz and a wavenumber k=0.057 m−1. Since in this work R S is approximately 0.01 m, it follows that the first two terms of equation (A 1) are of the order of 1.6×10⁻⁷ and 5.7×10⁻⁴, respectively, compared with the third and, therefore, completely negligible. Thus, it is clear that the sound field does not contribute to the fluid motion of interest. In addition, the quantity k (R S+z) is also of the order of 5.7×10⁻⁴ and, to an excellent approximation, it follows that
 |
A2 |
Equation (A 2) provides the spatial–temporal distribution of the air velocity ahead of a sphere oscillating at a low, single frequency in air. The maximum velocity at any location z is attained at the start of motion when t=0 and thereafter decays according to cos (ωt). For all practical purposes,
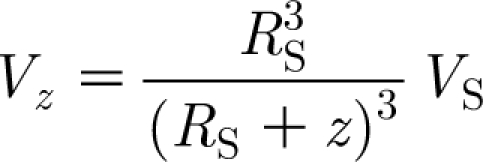 |
A3 |
is an excellent approximation of the horizontal component of velocity for small ω or at the start of motion. Equation (A 3) can be written
 |
A4 |
showing that with increasing z the slope of V z versus z decreases from −1 to −2 to −3. For values z/R S<0.1, equation (A 4) is well approximated by
 |
A5 |
Thus we find that for values z/R S<0.1, the horizontal component of velocity induced by a translating sphere is less than the last term in equation (A 5). This last term is exactly that given by Rinberg & Davidowitz (2003) ‘for a distance, r=(R S+z), that is much larger than the size of the body’. However, to get the form of equation (A 5), we have just shown it is necessary to assume that z/R S<0.1 or, equivalently, that r/R S=(R S+z)/R S<1.1 so that, in fact, r=(R S+z) is not much larger than the size of the body, R S.
The form of equation (A 2) has motivated the temporal form of the Gaussian function used in this work. From equation (A 2) we see that in the case of a flow field generated by a sphere oscillating at a single frequency ω, the time variation of velocity at any location z is cosinusoidal. In this study, we wish to model the contributions of many frequencies to the motion of a fluid induced by a sudden pulsation. To accomplish this, we replace the monochromatic cosinusoidal variation in equation (A 2) with the Fourier expansion of a Gaussian pulsation (see equations (2.16) and (2.18) in the main text).
Note that equation (A 3) also follows from an analysis of the velocity potential and stream function associated with a sphere moving at the steady velocity V S in an incompressible fluid medium at rest at infinity (Milne-Thomson 1986). The kinetic energy induced in the air by the sphere is given by (Milne-Thomson 1986)
 |
A6 |
This is the maximum possible kinetic energy. If velocity decays according to the Gaussian pulsations of interest here (equation (2.16)), the kinetic energy at any later time t imparted to the air by the sphere is given by
 |
A7 |
A.2. Fits to the experimental data
Calculations of V z versus z using equation (A 3) are plotted in figure 10 for the case of a lunging spider and in figure 11 for the case of an impulsively accelerated cylinder where they are compared with the experimental data of Dangles et al. (2006) and Casas et al. (2008), respectively. In general, the agreement between measurements and calculations is very good. In addition, for the case of the spider, theoretical extrapolation of the analytical solution to z=0 yields 9.5×10⁻² m s−1 for the body velocity, corresponding closely to the mean value of 9.44×10⁻² m s−1 observed in the experiments for spiders with mean body sizes 3.6×10⁻³ m. Log–log plots of the spider and cylinder velocity data, provided in figure 12, show that, with increasing z, the slope of V z versus z decreases from −1 to −2 to −3. In addition, the log–log plots for the cylinder data corresponding to V S=0.11 m s−1 when z>6×10⁻³ m, and to V S=0.05 m s−1 when z>10−2 m, show that the corresponding velocity variations depart significantly from the expected (R S+z)−3 behaviour. (This departure from expected behaviour is not obvious in figure 11.) Given the fairly good agreement between measurements and calculations displayed by the other velocity cases, and given the challenges reported by Dangles et al. (2006) related to performing PIV measurements at such low air velocities, we suggest that for these values of z these two datasets may have been affected by a systematic uncertainty resulting from complex interactions of the flow with the substrate.
For the calculations shown in figures 10–12, we have set R S=3.8×10⁻³ m for the case of the spider and R S=7.5×10⁻³ m for the case of the cylinder. These values of R S may be looked upon as the effective radii of the spider and cylinder, respectively. In fact, the spider mean body size (corresponding to the largest width of the prothorax, plus the lengths of the coxa and the trochanter) was 3.6×10⁻³ m (Casas et al. 2008) and the diameter of the circular flat end face of the impulsively accelerated cylinder was 8×10⁻³ m (Dangles et al. 2006). Thus, the values of R S used in the calculations are approximately two times larger than the geometrical dimensions given for these two objects. However, for the spider and the cylinder to geometrically and dynamically correspond to the spherical model assumed above, in obtaining values for R S it is also necessary to account for their depth; that is, for the geometrical dimension aligned in the direction of motion. In the case of the spider, this means factoring in the additional length of the abdomen (not provided in Casas et al. 2008). In the case of the cylinder, we note that its length was 8×10⁻² m, or 10 times the value of the end face diameter. Therefore, it is not surprising that the empirically determined values of R S for these two objects should be larger than their frontal characteristic dimensions, and the values chosen yield the best agreement between the measured and calculated values of V z.
Footnotes
The latency times were derived from cinematographic recordings of animal behaviour. Since the values reported correspond to the times between the application of the stimulus and the observed change in animal behaviour, they may also be referred to as ‘reaction times’ to the flow stimulus.
The error of this approximation can be reduced to a much smaller value once the range of Red is more narrowly defined for a particular situation.
Humphrey et al. (1993) also provided an analytical expression for the flow oscillating perpendicular to a cylindrical substrate, but the complexity of that expression renders impracticable the analytical solution sought here. However, this is not a serious limitation, as the case investigated, with the flow oscillating parallel to the substrate, is biologically relevant and provides guidance concerning what to expect for the perpendicular flow case.
References
- Barth F. G.2000How to catch the wind: spider hairs specialized for sensing the movement of air. Naturwissenschaften. 87, 51–58. 10.1007/s001140050010 [DOI] [PubMed] [Google Scholar]
- Barth F. G. 2002a. A spider's world. Senses and behavior. Berlin, Germany; Heidelberg, Germany; New York, NY:Springer [Google Scholar]
- Barth F. G. 2002b. Spider senses—technical perfection and biology. Karl von Frisch-Lecture. Zoology. 105, 271–285. 10.1078/0944-2006-00082 [DOI] [PubMed] [Google Scholar]
- Barth F. G., Höller A.1999Dynamics of arthropod filiform hairs. V. The response of spider trichobothria to natural stimuli. Phil. Trans. R. Soc. B. 354, 183–192. 10.1098/rstb.1999.0370 [DOI] [Google Scholar]
- Barth F. G., Wastl U., Humphrey J. A. C., Devarakonda R.1993Dynamics of arthropod filiform hairs. II. Mechanical properties of spider trichobothria (Cupiennius salei KEYS.). Phil. Trans. R. Soc. B. 340, 445–461. 10.1098/rstb.1993.0084 [DOI] [Google Scholar]
- Barth F. G., Humphrey J. A. C., Wastl U., Halbritter J., Brittinger W.1995Dynamics of arthropod filiform hairs. III. Flow patterns related to air movement detection in a spider (Cupiennius salei KEYS.). Phil. Trans. R. Soc. B. 347, 397–412. 10.1098/rstb.1995.0032 [DOI] [Google Scholar]
- Bathellier B., Barth F. G., Albert J. T., Humphrey J. A. C.2005Viscosity-mediated motion coupling between pairs of trichobothria on the leg of the spider Cupiennius salei. J. Comp. Physiol. A. 191, 733–746. 10.1007/s00359-005-0629-5 [DOI] [PubMed] [Google Scholar]
- Brittinger W. 1998. Trichobothrien, Medienströmungen und das Orientierungsverhalten von Jagdspinnen (Cupiennius salei Keys). Dissertation, Universität Wien.
- Camhi J. 1984Neuroethology: nerve cells and the natural behavior of animals Sunderland, MA:Sinauer [Google Scholar]
- Casas J., Steinmann T., Dangles O.2008The aerodynamic signature of running spiders. PLoS ONE. 3, e2116. 10.1371/journal.pone.0002116 [DOI] [PMC free article] [PubMed] [Google Scholar]
- Clift R., Grace J. R., Weber M. E. 1978. Bubbles, drops and particules New York, NY:Academic Press [Google Scholar]
- Dangles O., Ory N., Steinmann T., Christides J. P., Casa J.2006Spider's attack versus cricket's escape: velocity modes determine success. Anim. Behav. 72, 603–610. 10.1016/j.anbehav.2005.11.018 [DOI] [Google Scholar]
- Dangles O., Steinmann T., Pierre D., Vannier F., Casas J.2008Relative contributions of organ shape and receptor arrangement to the design of cricket's cercal system. J. Comp. Physiol. A. 194, 653–663. 10.1007/s00359-008-0339-x [DOI] [PubMed] [Google Scholar]
- Drake G. W. F. 1996. Atomic, molecular and optical handbook New York, NY:American Institute of Physics [Google Scholar]
- Friedel T., Barth F. G.1997Wind-sensitive interneurons in the spider CNS (Cupiennius salei). Directional information processing of sensory inputs from trichobothria on the walking legs. J. Comp. Physiol. A. 180, 223–233. 10.1007/s003590050043 [DOI] [Google Scholar]
- Gnatzy W., Tautz J.1980Ultrastructure and mechanical properties of an insect mechanoreceptor: stimulus-transmitting structures and sensory apparatus of the cercal filiform hairs of Gryllus. Cell Tissue Res. 213, 441–463. [DOI] [PubMed] [Google Scholar]
- Humphrey J. A. C., Mellon De F.2007Analytical and numerical investigation of the flow past the lateral antennular flagellum of the crayfish Procambarus clarkii. J. Exp. Biol. 210, 2969–2978. 10.1242/jeb.005942 [DOI] [PubMed] [Google Scholar]
- Humphrey J. A. C., Barth F. G. 2008. Medium flow-sensing hairs: biomechanics and models In Insect mechanics and control, vol. 34 (eds Casas J., Simpson S. J.). Advances in Insect Physiology, pp. 1–80. Burlington, MA: Academic Press [Google Scholar]
- Humphrey J. A. C., Devarakonda R., Iglesias I., Barth F.1993Dynamics of arthropod filiform hairs. I. Mathematical modeling of the hair and air motions. Phil. Trans. R. Soc. B. 340, 423–444. 10.1098/rstb.1993.0083[Errata in Phil. Trans. R. Soc. B 1997 352 , 1995; Phil. Trans. R. Soc. B 1998 353 , 2163.] [DOI] [Google Scholar]
- Humphrey J. A. C., Barth F. G., Voss K. 2001. The motion-sensing hairs of arthropods: using physics to understand sensory ecology and adaptive evolution. In Ecology of sensing Barth F. G., Schmid A. pp. 105–126. Eds. Berlin, Germany:Springer. [Google Scholar]
- Kalmijn A. J. 1988. Hydrodynamic and acoustic field detection. In Sensory biology of aquatic animals Atema J., Fay R. R., Popper A. N., Tavolga W. N.pp. 83–130. Eds. New York, NY:Springer. [Google Scholar]
- Kumagai T., Shimozawa T., Baba Y.1998Mobilities of the cercal wind-receptor hairs of the cricket, Gryllus bimaculatus. J. Comp. Physiol. A. 183, 7–21. 10.1007/s003590050230 [DOI] [Google Scholar]
- Markl H., Tautz J.1975The sensitivity of hair receptors in caterpillars of Barathra brassicae L. (Lepidoptera, Noctuidae) to particle movement in a sound field. J. Comp. Physiol. 99, 79–87. 10.1007/BF01464713 [DOI] [Google Scholar]
- Milne-Thomson L. M. 1986. Theoretical hydrodynamics. 5th edn.London, UK:McMillan Education Ltd [Google Scholar]
- Panton R. L. 1996. Incompressible flow New York, NY:Wiley [Google Scholar]
- Rinberg D., Davidowitz H. 2003. Wind spectra and the response of the cercal system in the cockroach. J. Comp. Physiol. A. 189, 867–876. 10.1007/s00359-003-0460-9 [DOI] [PubMed] [Google Scholar]
- Shimozawa T., Kanou M. 1984a. Varieties of filiform hairs: range fractionation by sensory afferents and cercal interneurons of a cricket. J. Comp. Physiol. A. 155, 485–493. 10.1007/BF00611913 [DOI] [Google Scholar]
- Shimozawa T., Kanou M. 1984b. The aerodynamics and sensory physiology of range fractionation in the cercal filiform sensilla of the cricket Gryllus bimaculatus. J. Comp. Physiol. A. 155, 495–505. 10.1007/BF00611914 [DOI] [Google Scholar]
- Shimozawa T., Kumagai T., Baba Y.1998Structural scaling and functional design of the cercal wind-receptor hairs of a cricket. J. Comp. Physiol. A. 183, 171–186. 10.1007/s003590050245 [DOI] [Google Scholar]
- Tauber E., Camhi J. M.1995The wind-evoked escape behavior of the cricket Gryllus bimaculatus; integration of behavioral elements. J. Exp. Biol. 198, 1895–1907. [DOI] [PubMed] [Google Scholar]
- Tautz J., Markl H.1978Caterpillars detect flying wasps by hairs sensitive to airborne vibration. Behav. Ecol. Sociobiol. 4, 101–110. 10.1007/BF00302564 [DOI] [Google Scholar]
- Wiese K.1976Mechanoreceptors for near-field water displacements in crayfish. J. Neurophysiol. 39, 816–833. [DOI] [PubMed] [Google Scholar]
- White F. M. 1991. Viscous fluid flow. New York, NY:McGraw-Hill, Inc [Google Scholar]


