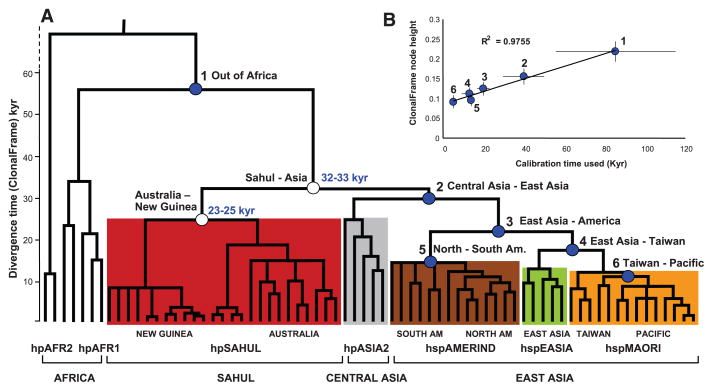
Fig. 3.
Global phylogeny of H. pylori as calculated by a haplotype approach based on the 80% consensus of 100 ClonalFrame analyses. (A) Phylogenetic tree of divergence time, as indicated by node height versus geographic sources (bottom line) and population assignments (second line). Detailed sources of clades within populations are indicated in the third line from the bottom. Node heights were used to date the two hpSahul nodes (unfilled circles) based on six calibration times (filled blue circles, table S2). Age ranges (light blue numbers) are the 95% confidence limits of estimated coalescence times obtained with GRMD rate-smoothing over the range of node height values and calibration time limits. hpAFR2, hpAfrica2; hpAFR1, hpAfrica1; AM, America. (B) Graph showing a linear relation of calibration time with the range of heights for each node.

