

Abstract
In neural development, several Wnt genes are expressed in the vertebrate diencephalon, including the thalamus. However, roles of Wnt signaling in the thalamus during neurogenesis are not well understood. We examined Wnt/β-catenin activity in embryonic mouse thalamus and found that a Wnt target gene Axin2 and reporter activity of BAT-gal transgenic mice show similar, differential patterns within the thalamic ventricular zone, where ventral and rostral regions had lower activity than other regions. Expression of Wnt ligands and signaling components also showed complex, differential patterns. Finally, based on partially reciprocal patterns of Wnt and Shh signals in the thalamic ventricular zone, we tested if Shh signal is sufficient or necessary for the differential Axin2 expression. Analysis of mice with enhanced or reduced Shh signal showed that Axin2 expression is similar to controls. These results suggest that differential Wnt signaling may play a role in patterning the thalamus independent of Shh signaling.
Keywords: thalamus, development, Wnt, Shh, Axin2, diencephalon, patterning, neurogenesis, olig3
INTRODUCTION
The vertebrate thalamus is composed of dozens of nuclei, each of which has a unique gene expression pattern, connectivity, and functions (Nakagawa and O’Leary, 2001; Jones, 2007). In early embryonic forebrain, the thalamic ventricular zone is located in the alar plate of the caudal diencephalon, and is bordered rostrally by the zona limitans intrathalamica (ZLI), caudally by the pretectum, dorsally by the habenula, and ventrally by the basal plate (Puelles and Rubenstein, 2003; see Fig. 1C). The thalamic ventricular zone is marked by the expression of the basic helix–loop–helix (bHLH) transcription factor Olig3 and contains two molecularly distinct domains of neural progenitor cells (Vue et al., 2007). The larger domain, pTH-C, is located caudodorsally and generates all the cortex-projecting thalamic nuclei, while the smaller, rostroventrally located domain, pTH-R, contributes to additional nuclei that do not have cortical projections (Vue et al., 2007). Mechanisms that control the differential expression of transcription factors within the thalamic ventricular zone, and thus the positional identities of the progenitor cells, have just begun to be explored (Hashimoto-Torii et al., 2003; Kiecker and Lumsden, 2004; Vieira et al., 2005; Kataoka and Shimogori, 2008; Vue et al., 2009). Among the secreted signaling molecules that are expressed near the early embryonic thalamus, Sonic hedgehog (Shh) is expressed in the ZLI and the basal plate (Echelard et al., 1993). We recently reported that differential Shh signaling regulates the positional gene expression patterns in both pTH-R and pTH-C (Vue et al., 2009). When Shh signaling was enhanced in the thalamic progenitor cells, the pTH-R domain as well as the rostroventral part of pTH-C marked by the expression of the bHLH transcription factor Olig2 were expanded. This study also revealed that increasing the Shh activity in the entire thalamus is not enough to convert the entire thalamic ventricular zone into pTH-R, which indicated that other signaling mechanisms may also play a role in the patterning of the thalamus into molecularly distinct progenitor pools. Wnt signaling is one candidate for thalamic patterning because Wnt3a is expressed in a wedge-shaped region in dorsal diencephalon, dorsal and caudal to the ZLI, at embryonic day (E) 9.5 and E10.5 (Louvi et al., 2007). In addition, Wnt5a is expressed in the ZLI at E12 in mice (Zhou et al., 2004).
Fig. 1.
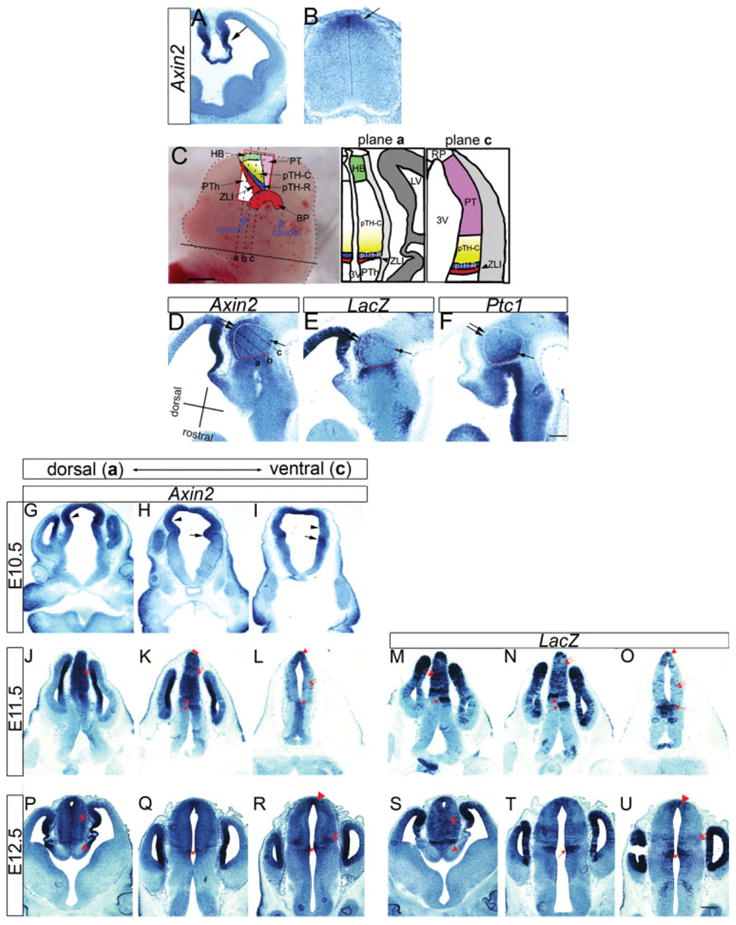
Differential expression of Axin2 and BAT-gal in the thalamic ventricular zone. A: At embryonic day (E) 11.5, Axin2 is expressed in the medial part of the telencephalon including the cortical hem (arrow) that is known to express several Wnt ligands. B: At E11.5, Axin2 is also expressed in the dorsal spinal cord (arrow). C: Schematic representations to show axial nomenclature and section planes of frontal sections used in this study, based on our previous study (Vue et al., 2007). In the left panel, a lateral view of E12.5 mouse brain is shown. Front of the brain is to the left. As shown in blue dotted line, the rostrocaudal axis is curved in the caudal diencephalon, which includes the thalamus. Three different planes of frontal sections (a,b,c) are shown. Section plane a includes the dorsal region, and section c includes the most ventral part of the thalamus. The thalamic ventricular zone is divided into the rostroventral domain pTH-R (blue) and the caudodorsal domain pTH-C (yellow). There is a graded expression transcription factors such Olig2 and Dbx1 within pTH-C. The gradient of Olig2 expression is represented by the intensity of the yellow color. The thalamus is bordered rostrally by the zona limitans intrathalamica (ZLI, red) and ventrally by the basal plate (BP, red). The prethalamus is located rostral to the ZLI. The habenula (HB, green) is dorsal to the thalamus and the pretectum (PT, pink) is caudal to the thalamus. D–F: Three adjacent sagittal sections from BAT-gal embryos showing differential expression of Axin2 (D), LacZ (E), and Ptc1 (F) in the thalamus. Rostrocaudal and dorsoventral axes within the thalamus are shown. a, b, and c show three hypothetical section planes that correspond to C. The thalamus (indicated by Olig3 expression in adjacent sections) is outlined by dotted white lines, where the red segment is the rostral boundary of the thalamus abutting the ZLI. In D and E, the dorsal region of the thalamus shows strong Axin2 and LacZ expression (double arrows), whereas the ventral part has a weaker signal (arrow). In F, Ptc1 is expressed in a smooth gradient within the thalamus, where the rostroventral region (arrow) shows stronger expression than the dorsocaudal region (double arrows). G–U: Frontal sections showing Axin2 expression in the diencephalon of E10.5 (G–I), and Axin2 and LacZ expression in E11.5 (J–O) and E12.5 (P–U) mouse embryos. G, J, M, P, and S are sections that include the dorsal region of the thalamus (corresponding to plane a in C) and I, L, O, R, and U include the most ventral part, corresponding to plane c. G–I: At E10.5, Axin2 is expressed in the ZLI (H and I, arrows) and in the thalamic ventricular zone (G, H, I, arrowheads), with higher expression in the thalamus of dorsal sections (G) than ventral sections (I). J–O: At E11.5, Axin2 and LacZ are expressed in the ZLI (K, L, M, N, O, arrows) and in a heterogeneous pattern within the thalamus (J–O). J,M: Dorsal sections have strong expression throughout the thalamic ventricular zone (double arrows). K,N: More ventrally, expression is heterogeneous, with most of the caudal diencephalon high except for two regions that show low signal: a region adjacent to the ZLI (arrowheads) and in the pretectum (double arrows). L,O: The ventral-most sections show very low Axin2 and LacZ expression throughout the thalamus and pretectum (double arrows). P–U: At E12.5, Axin2 and LacZ are expressed highly in the thalamus of dorsal sections (P,S, double arrows), in the ZLI (Q,R,T,U, arrows), and in a ventral lateral population (R,U, double arrows). Scale bars = 1 mm for the left panel of C, 200 μm in A,B,D–U.
By using chick explant culture and in ovo electroporation, Braun et al. showed that Wnt signaling directs the initial expression of Irx3 in the caudal forebrain and the repression of Six3 in the rostral forebrain (Braun et al., 2003). The two transcription factors Irx3 and Six3 are mutually inhibitory in the chick forebrain (Kobayashi et al., 2002) and are likely to determine the identity of the thalamus and prethalamus, respectively (Braun et al., 2003; Kiecker and Lumsden, 2004). Additionally, mice lacking a Wnt coreceptor LRP6 showed severe patterning defects in the diencephalon (Zhou et al., 2004). These mice lacked Shh expression in the ZLI, and markers of the thalamic mantle zone were largely replaced by prethalamic markers, such as Dlx2. These results collectively demonstrate the early roles of Wnt singling in the specification of the thalamic primordium as a whole. Other studies indicated that Wnt signaling is required for later steps of thalamic development, including the cell survival in parafascicular nucleus (Liu et al., 2008) and the projection of thalamocortical axons (Wang et al., 2002; Zhou et al., 2008, 2009). Despite these studies, it is still unclear whether the active Wnt signaling is still ongoing during neurogenesis and is required for the maintenance of the thalamic identity, or whether Wnt signaling has any role in regulating the heterogeneity of progenitor cells in the thalamic ventricular zone or in the control of cell proliferation and differentiation in the thalamus.
In an attempt to elucidate the role of Wnt signaling in the embryonic thalamus, in this study we examined the expression of readouts and components of the Wnt/β-catenin signaling pathway in E10.5 to E12.5 mouse embryos, where neurogenesis is occurring in the thalamus. We first analyzed the expression of a Wnt target gene Axin2, and the reporter activity in BAT-gal transgenic mice, both of which report Wnt/β-catenin signaling that converges on the activation of TCF/LEF transcription factors (Jho et al., 2002; Maretto et al., 2003; Barolo, 2006). We found that both Axin2 expression and BAT-gal activity showed similar, differential patterns within the thalamic ventricular zone. Specifically, ventral and rostral regions showed weaker activity than the rest of the thalamus and the ZLI. To investigate what accounts for this differential Wnt activity, we analyzed expression of various Wnt ligands, receptors, and soluble inhibitors, as well as other signaling components, and found that many of them show dorsoventral difference within the thalamic ventricular zone. Lastly, because we previously showed that Shh signaling patterns the thalamus during neurogenesis, we analyzed mouse embryos in which Shh signaling is enhanced or reduced within the thalamic ventricular zone (Vue et al., 2009) to determine if Wnt/β-catenin signaling is affected by the altered Shh activity. We found that, in both conditions, differential Axin2 expression largely remained unchanged, indicating the lack of direct interference of Wnt signaling pathway by Shh activity.
RESULTS AND DISCUSSION
Expression of the Wnt Target Gene Axin2 in Embryonic Mouse Thalamus
To examine Wnt/β-catenin signaling activity in the thalamus, we first analyzed the localization of Axin2 mRNA. Axin2 (also known as conductin or Axil) encodes an inhibitor of the Wnt signaling pathway, and is also a direct target of TCF/LEF1-mediated transcriptional activation, thus forming a negative feedback loop to limit the duration or intensity of the Wnt signal. Like other feedback inhibitors in various pathways (e.g., Patched in the Sonic hedgehog pathway and Sprouty in the Fgf pathway), Axin2 is activated in many, possibly all, sites of signaling and is widely used as a readout of Wnt/β-catenin signaling (Jho et al., 2002). As reported previously (Jho et al., 2002; Diep et al., 2004), Axin2 was expressed in the medial telencephalon including the cortical hem (Fig. 1A), as well as in the dorsal spinal cord (Fig. 1B), two regions where Wnt signaling has a role in neural patterning (Galceran et al., 2000; Lee et al., 2000; Ciani and Salinas, 2005; Zechner et al., 2007; Bonner et al., 2008). We then investigated Axin2 expression in the thalamus. In situ hybridization analysis of sagittal sections showed that at E11.5, Axin2 expression is stronger in the dorsal region of the thalamus (Fig. 1D, double arrows), whereas rostral and ventral regions (Fig. 1D, arrow) had a weaker signal. We also analyzed BAT-gal reporter mice, which express the LacZ gene in cells with high TCF/LEF-mediated transcriptional activity (Maretto et al., 2003; Barolo, 2006). In situ hybridization for LacZ transcript on sagittal sections revealed a similar pattern to Axin2, with higher expression in the dorsal region (Fig. 1E, double arrows) and low expression in rostral and ventral regions (Fig. 1E, arrow). This pattern of Axin2 and LacZ expression was partially reciprocal to that of Ptc1, a downstream target gene of the Shh signaling pathway, which is higher in the rostroventral part of the thalamic ventricular zone (Fig. 1F, arrow) than in more caudodorsal part (Fig. 1E, double arrows).
To further describe the spatial and temporal expression patterns of Axin2 and BAT-gal, we also performed in situ hybridization analysis on frontal sections (planes of sections are shown in Fig. 1C). We found that Axin2 is expressed in thalamic progenitor cells at E10.5 (Fig. 1G–I, arrowheads). Expression was strong in the ZLI, the rostral border of the thalamus that expresses Shh and some Wnt ligands (Echelard et al., 1993; Zhou et al., 2004; Fig. 1H,I, arrows). We also noted that Axin2 expression in the thalamus was stronger in dorsal sections (Fig. 1G,H, arrowheads) than in more ventral sections (Fig. 1I, arrowhead).
This pattern became more pronounced at E11.5. In dorsal sections (Fig. 1J), the entire diencephalon caudal to the ZLI, which includes both the thalamus and the habenula, exhibited homogeneous and strong expression of Axin2 (Fig. 1J, double arrows). In contrast, a more ventral section (Fig. 1K) had a heterogeneous pattern (Fig. 1K); caudodorsal to the ZLI, two regions had lower Axin2 expression, one immediately adjacent to the ZLI (Fig. 1K, arrowhead), and the other one located further caudodorsally in the pretectum (Fig. 1K, double arrows). The ZLI and the dorsocaudal tip including the roof plate showed strong expression of Axin2 (Fig. 1K, arrow and double arrowheads, respectively). At the most ventral level (Fig. 1L), the entire section showed weak Axin2 expression (Fig. 1L, double arrows) except in the ZLI (Fig. 1L, arrow) and the dorsocaudal tip (Fig. 1L, arrowhead).
LacZ expression in E11.5 BAT-gal embryos showed a similar pattern to Axin2, although the distribution of LacZ had some degree of mosaic, columnar pattern likely caused by the way in which the transgenic mice were generated (Fig. 1M–O). In dorsal sections, LacZ expression was high throughout the thalamic ventricular zone and ZLI (Fig. 1M, double arrows and arrow, respectively). More ventrally, a heterogeneous pattern similar to that of Axin2 was observed, with low LacZ expression in the region adjacent to the ZLI (Fig. 1N, arrowhead) and caudodorsally in the pretectum (Fig. 1N, double arrows). Most ventrally, LacZ was expressed in the ZLI (Fig. 1O, arrow) and in the roof plate (Fig. 1O, arrowhead), but expression is weaker in the thalamus and pretectum (Fig. 1O, double arrows).
A similar pattern was also found in the ventricular zone at E12.5 (Fig. 1P–U). Dorsal sections show homogeneous expression of Axin2 and LacZ in the thalamus (Fig. 1P,S, double arrows), while the prethalamus is clearly negative (Fig. 1P,S arrowhead). The ZLI still showed strong expression at E12.5 (Fig. 1Q,R,T,U, arrows). Ventral sections have weak expression of Axin2 and LacZ with the exception of the ZLI, dorsal tip (Fig. 1R,U, arrowheads), and a lateral population (Fig. 1R,U, double arrows). Together, these results show that Wnt/β-catenin signaling activity has a spatial difference within the thalamus.
In our previous studies, we described the progenitor cell domains in the thalamus based on the expression patterns of several transcription factors (Vue et al., 2007, 2009). For example, Olig3 is expressed in the entire thalamus and the ZLI, and the ZLI is labeled by Shh (Fig. 2C,G,M). The bHLH transcription factor Ascl1 (also known as Mash1) is expressed in the rostroventral progenitor domain, pTH-R, whereas Olig2 is expressed in the rostroventral part of the caudal progenitor domain, pTH-C (Fig. 2D,H,J,N, also see Fig. 3G–I for a schematic gradient of Olig2 expression). We also reported that Ptc1, a Shh target gene, is expressed in a rostroventral high, caudodorsal low gradient in the thalamic ventricular zone, and that the differential expression of progenitor cell markers in the thalamus is regulated by Shh signaling (Vue et al., 2009).
Fig. 2.
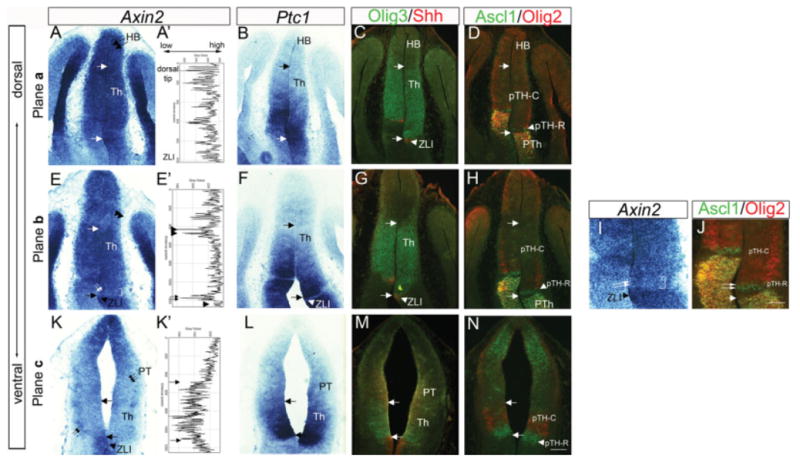
Comparison of Axin2 expression with Ptc1 and markers of different progenitor populations in the thalamus. Frontal sections of E11.5 embryos are shown. A–D,K–N: Sections of the dorsal part of the thalamus (A–D) the most ventral part of the thalamus (K–N). E–J: Sections between A–D and K–N. Within each set of panels, adjacent sections were analyzed for in situ hybridization (Axin2, Ptc1) and double immunohistochemistry (Olig3 and Shh, Ascl1 and Olig2). C,D,G,H,J,M,N: Arrows in each panel indicate the boundaries of thalamic ventricular zone as delineated by Olig3 and Shh expression. Ascl1 is expressed in the rostroventral progenitor domain, pTH-R as well as in the prethalamus (PTh), and Olig2 is expressed in the rostral and ventral part of pTH-C and the prethalamus. A: Dorsal sections show homogeneous, high Axin2 expression (A). E: More ventral sections have heterogeneous Axin2 expression, with low expression adjacent to the ZLI (double arrows) and in the pretectum (double arrowheads) and high expression in remainder of the thalamic ventricular zone. I is a higher magnification image of E and shows the region adjacent to the ZLI (I, double arrows and bracket) with reference to Ascl1 (J, double arrows) and Olig2. K: Most ventrally, Axin2 is low throughout the thalamus and pretectum (triple arrows), with the exception of a lateral population that expresses Axin2 (double arrows). Pixel intensity of Axin2 in situ images shown in panels A′, E′, and K′ were obtained from the images in A, E, and K, respectively. High pixel values are to the right and low values to the left; the top of the graph corresponds to values for the dorsal tip of the diencephalon and the bottom corresponds to the ZLI. The habenula (HB) is on top of the thalamus in sections A–D and the pretectum (PT) is on top of the thalamus in sections K–N. HB, habenula; Th, thalamus; ZLI, zona limitans intrathalamica. Scale bar = 100 μm.
Fig. 3.

Schematic summary of Axin2 expression in relation to Shh activity and thalamic progenitor domains. Midline is to the left. A–C: Axin2 expression shown in pink. A: On dorsal sections, Axin2 is uniformly high in the thalamus as well as the ZLI, habenula (HB) and the roof plate (RP). The prethalamus (PTh) shows lower expression, which is shown in lighter pink. B: At the middle level, Axin2 expression is strong in the roof plate, the caudal part of the thalamus and the ZLI. C: The pretectum (PT), the rostral part of the thalamus just caudal to the ZLI and the prethalamus show weaker expression. At the most ventral level, Axin2 is strong only in the roof plate and the ZLI, whereas other part is uniformly weak. Not shown here is that the lateral edge of the thalamic ventricular zone shows strong Axin2 expression even at this ventral level (Fig. 3I, double arrowheads). D–F: Ptc1 expression shown in green to indicate the differential Shh signaling. On all three section planes, Ptc1 shows a rostral-high, caudal-low gradient of expression, whereas the ZLI does not express Ptc1. Ptc1 is also expressed in the most caudal part of the prethalamus. G–I: Thalamic progenitor domains. The thalamic ventricular zone, which lies caudal to the ZLI (red), is divided into two domains, pTH-R (blue) and pTH-C (yellow-white). pTH-R expresses transcription factors such as Ascl1 and Nkx2.2, whereas pTH-C expresses Neurog2 (=Neurogenin 2 or Ngn2), Olig2, and Dbx1. Olig2 is expressed in rostroventral-high, caudodorsal-low pattern (shown in the graded yellow color) and Dbx1 is expressed in the opposite pattern within pTH-C.
To characterize Axin2 expression within the thalamus in more detail, we examined how the differential Wnt activity is spatially correlated with the graded Shh signaling and the differential expression of transcription factors. At E11.5, on dorsal sections corresponding to section plane a in Figure 1C (Fig. 2A–D), the entire thalamic ventricular zone marked by Olig3 expression (marked by two arrows) showed strong Axin2 expression (Fig. 2A). Quantification of the pixel intensity of Axin2 signal confirmed a uniformly high value throughout the thalamic ventricular zone (Fig. 2A′). The strong Axin2 region extended caudodorsally into the habenula (Fig. 2A, HB, double arrows). On more ventral sections (section plane b in Fig. 1C; Fig. 2E–H), the rostral progenitor domain, pTH-R, which expresses Ascl1, showed low Axin2 expression (marked by the double arrows and bracket in Fig. 2E,I). Quantification of Axin2 confirmed low expression adjacent to the ZLI (Fig. 2E′, double arrows) and caudodorsally in the pretectum (Fig. 2E′, double arrowhead). Higher magnification of the region including the ZLI and adjacent Axin2-low region shows that, while Axin2 expression is clearly lower in the pTH-R (Fig. 2I, double arrows), the boundary between strong and weak Axin2 expression was not as clear as the boundary between pTH-R and the caudal progenitor domain (pTH-C) that expresses Olig2 (Fig. 2J, double arrows). In further ventral sections (section plane c in Fig. 1C; Fig. 2K–N), the entire Olig3-expressing thalamic progenitor domain appeared to have low Axin2 expression (Fig. 2K, arrow), except that we saw a thin band of Axin2-expressing cells in pTH-C along the outer edge of the ventricular zone (Fig. 2K, double arrows). The overlying pretectum also showed weak Axin2 expression (Fig. 2K, PT, triple arrows), whereas Axin2 was strongly expressed in the most dorsal end of the section including the roof plate. Quantification of this expression pattern showed strong Axin2 expression in the dorsocaudal region and at the ZLI (Fig. 2K′, arrow), and weak signal throughout the thalamus and pretectum (Fig. 2K′, between arrows).
In summary, Axin2 showed a dorsal-high, ventral-low pattern in the thalamic ventricular zone. In addition, in the middle level (Fig. 2E,I), Axin2 was also lower in the rostral region than in the caudal region. These patterns were compatible with those seen on sagittal sections (Fig. 1D). In comparison, Ptc1 had a more pronounced rostrocaudal difference at all dorsoventral levels examined (Fig. 2B,F,J). The patterns of gene expression shown in Figure 2 are schematically summarized in Figure 3. While the expression of readout genes indicates that Wnt/β-catenin signaling is differential within the thalamus, the pattern of expression does not strictly correlate with known divisions with the thalamic ventricular zone (i.e., pTH-R and pTH-C). For example, low Axin2 expression adjacent to the ZLI in section plane b includes pTH-R, but more ventrally (section plane c), the region of low Axin2 expression also includes parts of the pTH-C domain.
Expression of Axin2 Compared With Markers of Cell Proliferation and Differentiation
In other regions of the developing central nervous system, Wnt/β-catenin signaling regulates proliferation of neural progenitor cells (Megason and McMahon, 2002; Chenn, 2008; Alvarez-Medina et al., 2009). Thus, it is possible that differential Axin2 and BAT-gal expression reflects a similar role of Wnt/β-catenin signaling activity in the thalamus.
To see if the pattern of Axin2 expression is related to the pattern of thalamic neurogenesis, we compared the pattern of Axin2 expression with markers of cell proliferation and differentiation. Bromodeoxyuridine (BrdU) is incorporated into dividing cells during S-phase and was used to label proliferating cells, and TuJ1 is a marker for newly generated neurons. We find that, in general terms, Axin2 expression is inversely correlated with neuronal differentiation. At E11.5, dorsal sections, which have uniformly high Axin2 expression throughout the thalamic ventricular zone (Fig. 4A,B, arrows), had a thin mantle zone indicated by TuJ1 labeling (Fig. 4C,D, double arrows). Conversely, ventral sections, in which Axin2 expression is low within the thalamic ventricular zone (Fig. 4I,J, arrows), had a thicker TuJ1-positive mantle zone (Fig. 4K,L, double arrows), and thus have undergone more cumulative neurogenesis than the dorsal part of the thalamus at this stage. Furthermore, the ZLI had strong Axin2 expression in all section planes, and this region displays a low differentiation rate, likely due to interplay between other molecules, such as Hes1 (Baek et al., 2006). However, this general trend does not extend to a lateral population in ventral sections that expresses Axin2, which is likely to be postmitotic (Fig. 4J,L, arrowheads). Thus, although there is a general association between the pattern of Axin2 expression and neurogenesis, which indicates a possible role of Wnt/β-catenin signaling in thalamic neurogenesis, Wnt/β-catenin is likely to have other roles at the stages of thalamic development we have analyzed.
Fig. 4.
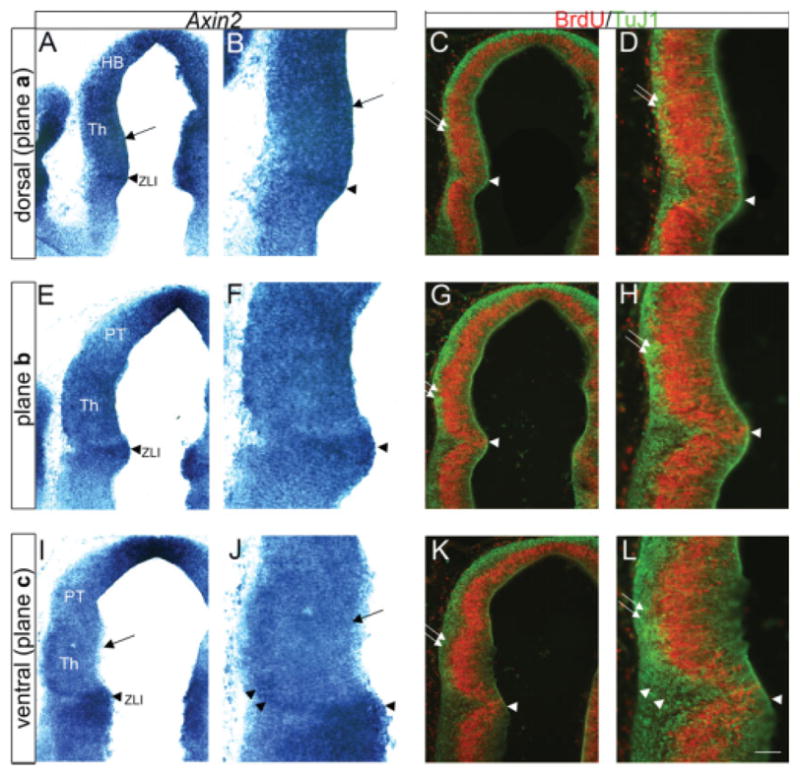
Comparison of Axin2 expression with markers for cell proliferation and neuronal differentiation. Frontal sections through embryonic day (E) 11.5 embryos are shown. Midline is to the right. A–D include the dorsal-most part of the thalamus and corresponds to section plane a of Figure 1C; E–H corresponds to section plane b; and I–L includes the ventral-most part of the thalamus and corresponds to section plane c. Within each set of panels, adjacent sections were analyzed for in situ hybridization (Axin2) and double immunohistochemistry (bromodeoxyuridine [BrdU] and TuJ1). B, D, F, H, J, and L are higher power images of those shown in A, C, E, G, I, and K, respectively. Bromodeoxyuridine (BrdU) was injected into pregnant females 30 min before killing. BrdU is incorporated during S-phase of the cell cycle and is used as a marker of proliferating cells. TuJ1 labels newly generated neurons. Arrowheads in all panels label the position of the ZLI. The thickness of the TuJ1-positive mantle layer is used as a measure of cumulative neurogenesis (double arrows in C,D,G,H,K,L). The thickness of the TuJ1-positive layer is larger ventrally (K and L) than dorsally (C,D). Axin2 expression is high dorsally and low ventrally (A,B compared with I,J, arrows). An Axin2-positive lateral population is likely TuJ1-positive (J and L, arrowheads). HB, habenula; PT, pretectum; TH, thalamus; ZLI, zona limitans intrathalamica. Scale bar = 100μm.
Expression of Wnt Ligands, Receptors, and Inhibitors in Embryonic Mouse Thalamus
The expression of Axin2 mRNA is a final readout of Wnt/β-catenin signaling. Thus, its differential expression pattern within the thalamus should be the culmination of regional differences of various signaling components. For example, Wnt ligands, soluble inhibitors, receptors, and intracellular molecules including LEF/TCF transcription factors could be differentially expressed across the thalamic ventricular zone. Therefore, we next examined the expression of these genes at E10.5 and E11.5.
We first analyzed the expression of various Wnt ligands (Wnt1, Wnt3, Wnt3a, Wnt5a, Wnt7b, Wnt8b) by in situ hybridization at E10.5 (Fig. 5) and E11.5 (Fig. 6). Of these genes, Wnt3, Wnt3a, Wnt5a, and Wnt7b were robustly expressed in the thalamus and/or in the ZLI. Wnt1 was strongly expressed in the roof plate of the diencephalon, but not within the thalamus (data not shown). Wnt3 has been used as a definitive marker that delineates the thalamus and the prethalamus (Salinas and Nusse, 1992; Bulfone et al., 1993). We found that at E10.5, Wnt3 was indeed expressed in the thalamus with a sharp rostroventral boundary; the expression was strongest immediately caudal to the ZLI and gradually decreased caudally and dorsally, but continued into the habenula and the pretectum (compare Fig. 5A and D). At a more ventral level, Wnt3 appeared to be expressed in the ZLI, and the thalamus had much weaker expression than the ZLI (Fig. 5E). This pattern was similar at E11.5; in general, there was stronger thalamic expression in dorsal sections (Fig. 6A) than in ventral sections (Fig. 6G), which is reminiscent of Axin2 distribution. It has been shown that Wnt3a is expressed in a wedge-like region in the diencephalon dorsal and caudal to the ZLI at E9.5 and E10.5, and that the expression level decreased after E10.5 (Louvi et al., 2007). We found that at E10.5, Wnt3a expression is similar to that of Wnt3; it was strongly expressed within the thalamus at the dorsal level (Fig. 5B), but at the ventral level, strong Wnt3a expression was detected in the ZLI, while the thalamus showed weaker expression (Fig. 5F). At E11.5, the dorsal expression of Wnt3a was decreased as reported previously (Louvi et al., 2007), but the ventral part of the ZLI still maintained Wnt3a expression (Fig. 6H). Wnt5a was expressed in the ZLI at both E10.5 and E11.5 (Figs. 5C,G, 6C,I), as reported previously (Zhou et al., 2004). Wnt7b has been reported to be expressed both in the thalamus and the prethalamus in early chick embryos (Garda et al., 2002). Of interest, Wnt7b was not expressed at all in the thalamus in dorsal sections (Figs. 5I, 6M), but was clearly detected in more ventral sections (Figs. 5M on the right side, 6S). In addition to the ventral region of the thalamic ventricular zone, Wnt7b was strongly expressed in the prethalamus (Figs. 5I,M, 6M,S). Wnt8b was expressed in the eminentia thalami, but was not clearly detected within the thalamus (data not shown). In summary, similar to Axin2, Wnt3 and Wnt3a are generally expressed in a dorsal-high, ventral-low pattern, in addition to their expression in the ZLI at the ventral level. In contrast, Wnt7b is expressed in the thalamus only at the ventral level and Wnt5a is largely restricted to the ZLI.
Fig. 5.
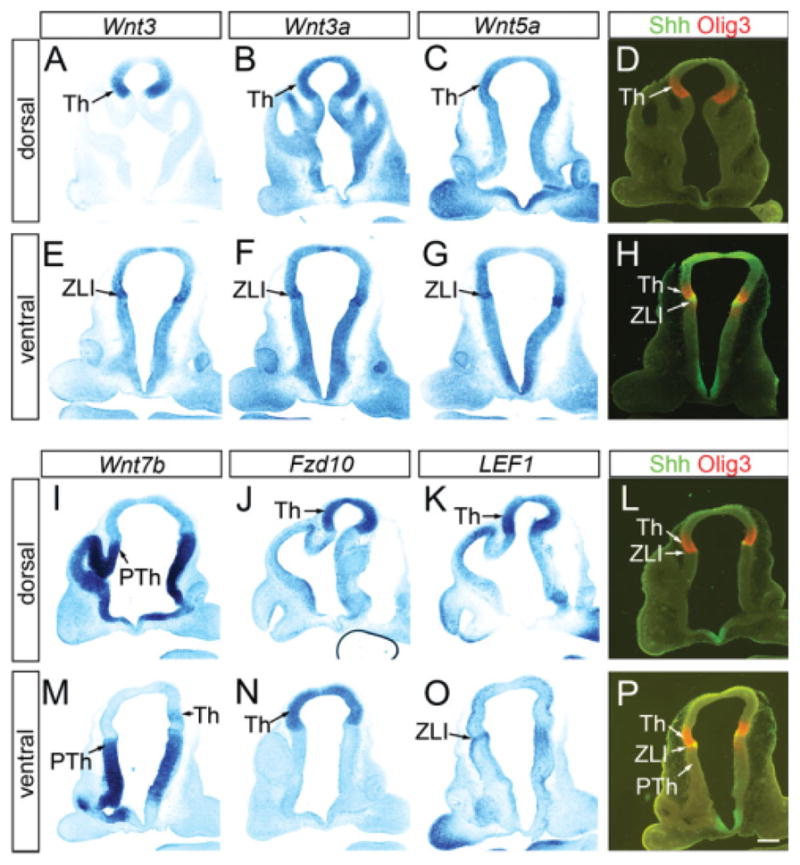
Differential expression of Wnt ligands and signaling components in thalamic progenitor cells at embryonic day (E) 10.5. Frontal sections of E10.5 forebrain. A–P: A–D and I–L are sections that include dorsal part of the thalamus, whereas sections E–H and M–P contain more ventral part. A–P: In situ hybridization for Wnt3 (A,E), Wnt3a (B,F), Wnt5a (C,G), Wnt7b (I,M), Fzd10 (J,N), and LEF1 (K,O) are shown in comparison with double immunohistochemistry of Olig3 and Shh (D,H,L,P) that provides reference for the thalamic ventricular zone. See text for more details. Th, thalamus; ZLI, zona limitans intrathalamica; PTh, prethalamus. Scale bar = 200 μm.
Fig. 6.
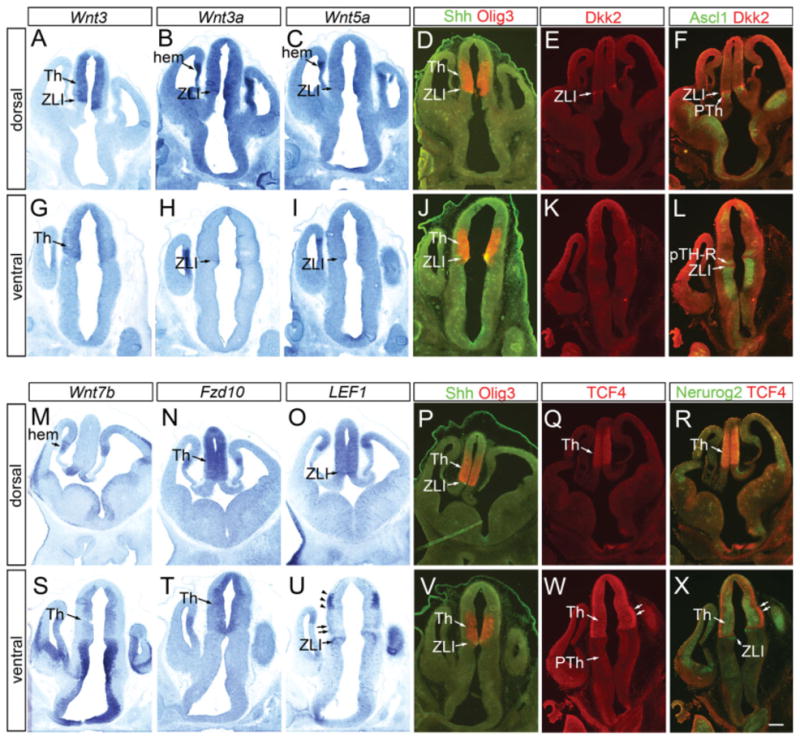
Differential expression of Wnt ligands and signaling components in thalamic progenitor cells at embryonic day (E) 11.5. Frontal sections E11.5 forebrain. A–X: A–F and M–R are sections that include dorsal part of the thalamus, whereas sections G–L and S–X contain more ventral part. A–D,G–J,M–P,S–V: In situ hybridization for Wnt3 (A,G), Wnt3a (B,H), Wnt5a (C,I), Wnt7b (M,S), Fzd10 (N,T), and LEF1 (O,U) are shown in comparison with double immunohistochemistry of Olig3 and Shh (D,J,P,V) that provides reference for the thalamic ventricular zone. E,F,K,L,Q,R,W,X: Also shown are immunohistochemistry for Dkk2 (E,K,F,L) and TCF4 (Q,R,W,X) in combination with Ascl1 (F,L) and Neurog2 (R,X). See text for more details. Th, thalamus; ZLI, zona limitans intrathalamica; PTh, prethalamus. Scale bar = 200 μm.
We next analyzed the expression of soluble Wnt inhibitors, receptors, and transcription factors. Soluble inhibitors Dkk3, sFRP1, sFRP2, and sFRP5 were not clearly expressed in the thalamic ventricular zone (data not shown). Another soluble inhibitor, Dkk2, was expressed specifically in the ZLI at E11.5, but only in the dorsal portion (Fig. 6E,F,K,L). Dkk2 mRNA was distributed in a similar manner (data not shown). Wnt receptor Fzd10 was expressed broadly in the thalamic ventricular zone both at E10.5 and E11.5, but not in the ZLI (Figs. 5J,N, 6N,T), as reported previously (Fischer et al., 2007). Wnt/β-catenin signaling is mediated by transcription factors of the LEF/TCF family. We found that strong TCF4 immunoreactivity is found in the thalamic ventricular zone, both in pTH-R and pTH-C, but not in the ZLI (Fig. 6Q,R,W,X). In ventral sections where the mantle zone is further developed than in the dorsal sections, TCF4 immunoreactivity was even stronger in the mantle zone than in the ventricular zone (Fig. 6W). Weak signal was also detected in the prethalamus (Fig. 6W). The pattern was similar for TCF4 mRNA (data not shown). LEF1 was expressed strongly in the dorsal sections of the thalamus at E10.5 (Fig. 5K) and E11.5 (Fig. 6O). In more ventral sections, LEF1 expression was very weak (Figs. 5O, 6U), with some signal just outside the ventricular zone at E11.5 (Fig. 6U, double arrows). We noted strong LEF1 expression in the mantle zone of the pretectum (Fig. 6U, arrowheads) and the ZLI (Figs. 5O, 6O,U).
In summary, we found that various Wnt signaling components are differentially expressed within the thalamus. Expression patterns of Wnt3, Wnt3a, Wnt5a and LEF1 predicted the differential Wnt pathway activation in the thalamus, and the majority of Wnt inhibitors except Dkk2 were not robustly expressed in the thalamic ventricular zone. However, Wnt7b was expressed in the part of the thalamus where Wnt3, Wnt3a, and Wnt5a were specifically not strongly expressed. Such a complex pattern of gene expression makes the simple prediction of differential Wnt activation difficult. Further studies are needed to elucidate the contribution of each signaling component to Wnt activity in the thalamus.
Increased Shh Signaling in Thalamic Progenitor Cells Does Not Significantly Reduce Axin2 Expression in Thalamic Progenitor Cells
The overall dorsal-high, ventral-low pattern of Wnt/β-catenin signaling within the thalamus is partially reciprocal to the differential Shh signaling, which is high rostroventrally and low caudodorsally (Vue et al., 2009). Therefore, we tested the possibility that Shh signaling negatively regulates Wnt signaling. For this purpose, we analyzed Axin2 expression in Olig3Cre/+; R26SmoM2/+ mice that express a constitutively active form of the Shh effector molecule, Smoothened, within the thalamus (Vue et al., 2009). In these mice, the expression of Ptc1, a target gene of Shh signaling, is strongly enhanced in the entire thalamic ventricular zone, in contrast to a smoothly graded pattern across the rostrocaudal and dorsoventral axes of the thalamus in the control mice (compare Fig. 7B,J and 7F,N; Vue et al., 2009). We also observed expanded expression of Ascl1, a pTH-R marker, and Olig2, a marker for the rostroventral region within the pTH-C domain (compare Fig. 7D,L and Fig. 7H,P), as reported previously (Vue et al., 2009). Using adjacent sections, we examined the expression of Axin2 and found that, despite the enhanced Shh signaling broadly within the thalamus, the region of weak Axin2 expression does not expand dorsally or caudally (Fig. 7E,M, bracket in M shows weak Axin2 expression). This result indicates that high Shh signaling itself is not sufficient to repress the expression of Wnt target gene, Axin2. We also did not observe changes in the expression of Wnt3, Wnt7b, TCF4, or LEF1 in the thalamus (data not shown).
Fig. 7.
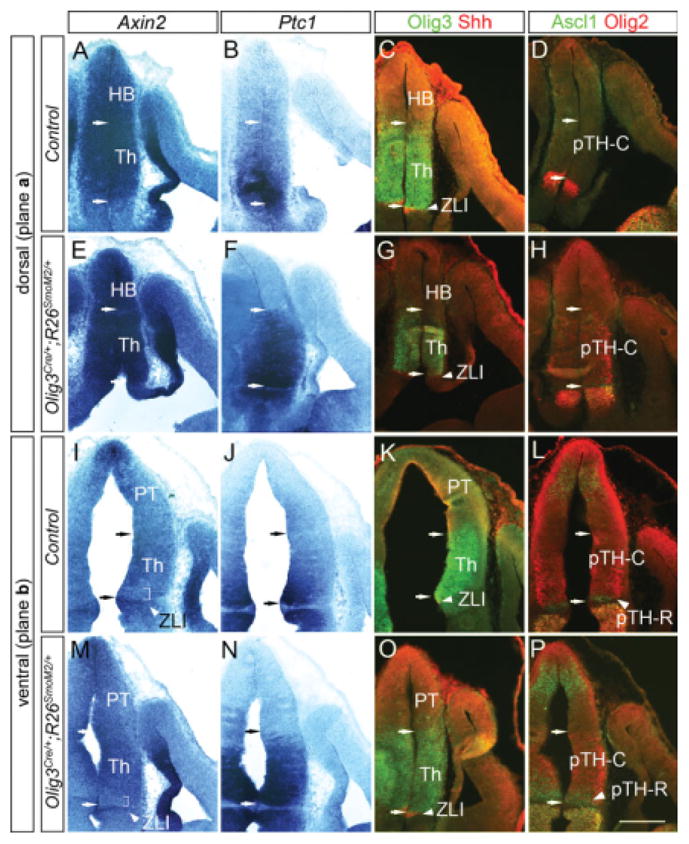
Expression of Axin2 in Olig3Cre/+; R26SmoM2/+ mice. Frontal sections of embryonic day (E) 11.5 embryos are shown. Midline is to the left. A–P: E–H and M–P are from Olig3Cre/+; R26SmoM2/+ embryos and A–D and I–L are controls (Olig3+/+; R26SmoM2/+). A–H are sections of the dorsal part of the thalamus, and I–P contain more ventral part of the thalamus. Within each set of panels, adjacent sections were analyzed for in situ hybridization (Axin2, Ptc1) and double immunohistochemistry (Olig3 and Shh, Ascl1 and Olig2). C,G,K,O: Arrows in each panel indicate the boundaries of thalamic ventricular zone as delineated by Olig3 and Shh expression. A,B,D–F,H,L,P: In dorsal sections, Axin2 is still expressed highly throughout the thalamic ventricular zone of Olig3Cre/+; R26SmoM2/+ embryos (A,E), although Ptc1 expression is enhanced specifically in thalamic progenitor cells (F compared with B) and Ascl1 and Olig2 expression is expanded (H and P compared with D and L, respectively). I,J,M,N: More ventrally, the heterogeneous Axin2 expression pattern is retained within the thalamus (I,M), despite high Ptc1 expression (J,N). I,M: Brackets indicate a region in the rostroventral part of the thalamus with low Axin2 expression. HB, habenula; Th, thalamus; ZLI, zona limitans intrathalamica; PTh, prethalamus. Scale bar = 200 μm.
Decreased Shh Signaling in Thalamic Progenitor Cells Does not Significantly Change the Axin2 Expression Pattern in Thalamic Progenitor cells
To test the possibility that Wnt signaling requires Shh signaling to be activated or repressed, we also analyzed Axin2 expression in NestinCre/+; Shhc/c mice, in which Shh is deleted in neural progenitor cells (Vue et al., 2009). Late deletion of Shh using the NestinCre/+ allele allows us to analyze thalamic gene expression during neurogenesis; complete null mice show severe reduction of diencephalon size by E9.0 (Ishibashi and McMahon, 2002).
As shown previously (Vue et al., 2009), NestinCre/+; Shhc/c mice had very low Shh signaling in the thalamus at E11.0 (Fig. 8B,F). The pTH-R marker Ascl1 and rostroventral pTH-C marker Olig2 were not expressed in the thalamus of the Shh conditional knockout (Fig. 8D,H, arrowhead). On adjacent sections, we analyzed the expression of Axin2 and found that Axin2 expression is similar to controls (Fig. 8A,E). In the middle level sections (similar to section plane b in Fig. 1C) in control embryos, Axin2 expression was high in most of the thalamus except the region immediately caudal to the ZLI (Fig. 8A, red arrow), and the putative ZLI showed strong Axin2 expression (Fig. 8A, yellow arrow). This pattern is similar in NestinCre/+; Shhc/c embryos (Fig. 8E; the red arrow shows a region of weak expression, whereas the yellow arrow shows a region of strong Axin2 expression), although Shh is no longer detected in the rostral end of Olig3-expression domain (Fig. 8C). This result indicates that Shh signaling is not required for the differential pattern of Wnt/β-catenin signaling within the thalamus. However, it is possible that Wnt and Shh signaling pathways interact in other manners. For example, they may converge on enhancers of genes that are differentially expressed within the thalamus (such as Nkx2,2, Ascl1, or Olig2), or Wnt signal may interfere with the Shh pathway upstream of Gli activators.
Fig. 8.
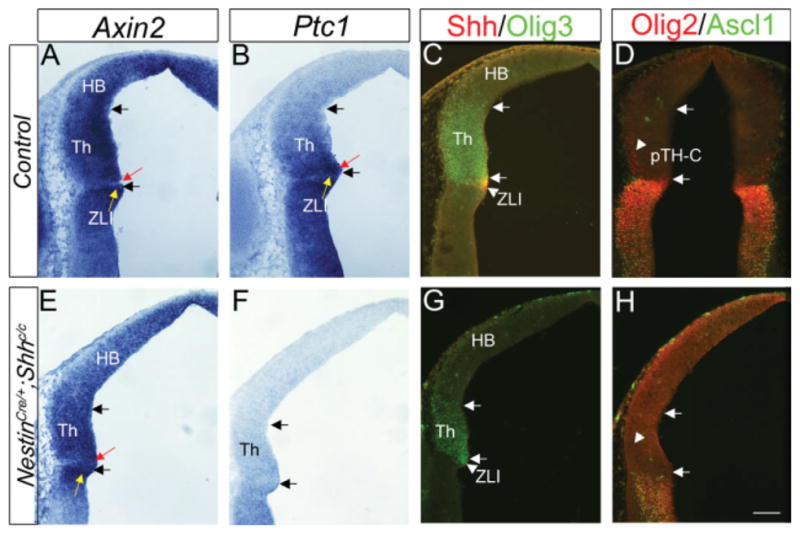
Expression of Axin2 in NestinCre/+; Shhc/c mice. Frontal sections of embryonic day (E) 11.0 embryos at the mid-level (close to section plane b in Fig. 1C) are shown. Midline is to the right. A–H: E–H are from NestinCre/+; Shhc/c embryos and A–D are controls (Nestin+/+; Shhc/c). Within each set of panels, adjacent sections were analyzed for in situ hybridization (Axin2, Ptc1) and double immunohistochemistry (Olig3 and Shh, Ascl1 and Olig2). Arrows in each panel indicate the boundaries of thalamic ventricular zone as delineated by Olig3 and Shh expression (C,G). B,C,F,G: Shh and Ptc1 expression were used to confirm that NestinCre/+; Shhc/c embryos have decreased Shh signaling compared with controls (F,G compared with B,C). H: The pTH-R marker Ascl1 and rostroventral pTH-C marker Olig2 are not expressed in the thalamus of NestinCre/+; Shhc/c embryos. A: In control embryos, Axin2 is highly expressed in most of the thalamus at this dorsoventral level, except in the most rostral region (shown by red arrow) immediately caudal to the ZLI (yellow arrow). E: In NestinCre/+; Shhc/c embryos, Axin2 expression is still high in most of the thalamus at this level, and low in the most rostral region (red arrow), whereas the region rostral to this weak region is again strong (yellow arrow). HB, habenula; Th, thalamus; ZLI, zona limitans intrathalamica. Scale bar = 100 μm.
Summary
Although previous studies have demonstrated that Wnt/β-catenin signaling plays an early role in specifying the thalamic primordium, it is not well understood if Wnt has any role at later stages when Shh patterns the thalamus along the rostrocaudal and dorsoventral axes. In this study, we found evidence suggesting that Wnt/β-catenin signaling is active during thalamic neurogenesis, and expression of a Wnt target gene, Axin2, and the reporter activity of BAT-gal transgenic mice show similar, differential patterns within the thalamic ventricular zone. This differential pattern is generally inversely correlated with the progression of neuronal differentiation within the thalamus, suggesting that this pathway may play a role in the spatial and temporal regulation of neurogenesis. Although gene expression boundaries of Axin2 do not exactly match the boundaries between known progenitor domains in the thalamus, it is still possible that Wnt/β-catenin signaling contributes to thalamic patterning and cell fate specification in collaboration with other pathways, such as those controlled by Shh signaling. In this study, we found that the differential expression pattern of Axin2 is not significantly affected by enhancing or reducing the Shh signal, indicating the lack of direct interference of the Wnt/β-catenin signaling pathway by Shh. Several studies have proposed a variety of mechanisms by which Wnt and Shh pathways interact during neural development (Robertson et al., 2004; Lei et al., 2006; Ulloa et al., 2007; Alvarez-Medina et al., 2008, 2009; Joksimovic et al., 2009; Quinlan et al., 2009), but it is not known whether or how Wnt/β-catenin and Shh pathways interact during thalamic neurogenesis. Further functional studies are needed to address these questions.
EXPERIMENTAL PROCEDURES
Animals
Care and experimentation on mice were done in accordance with the Institutional Animal Care and Use Committee of the University of Minnesota. Noon of the day on which the vaginal plug was found was counted as embryonic day (E) 0.5. Stages of early embryos were confirmed by morphology (Kaufman, 1992). CD1/ICR mice (Charles River) were used to examine normal gene expression patterns. BAT-gal mice were obtained from Kyuson Yun (Jackson Laboratory). Olig3Cre/+; R26SmoM2/+ mice and NestinCre/+; Shhc/c mice were described previously (Vue et al., 2009).
Axial and Anatomical Nomenclature
Axial and anatomical nomenclatures are described (Vue et al., 2007). Briefly, we cut frontal sections as described in Figure 1C. The section plane a contains the dorsal part of the thalamus in addition to the habenula. Section plane c contains ventral part of the thalamus as well as the pretectum. Section b is between a and c. All the sections contain the ZLI, a thin cell domain that forms the rostral border of the thalamus. For identifying thalamic progenitor populations, we used Shh, Olig3, Ascl1, Neurog2 (also known as Neurogenin 2 or Ngn2), and Olig2 as markers (Figs. 3, 4). Shh is a marker for the ZLI. Olig3 is expressed in the ZLI and the two progenitor domains, pTH-R and pTH-C. Ascl1 is expressed in pTH-R, prethalamus, and the caudal part of the pretectum. Neurog2 is expressed in the ZLI, pTH-C and the rostral part of the pretectum. Olig2 is expressed in a gradient in the rostroventral part of pTH-C and the prethalamus.
In Situ Hybridization and Immunohistochemistry
In situ hybridization was performed as described (Vue et al., 2007). The following probes were used and gave rise to positive signals at least in some parts of the sections: Wnt1 (IMAGE clone #3983987), Wnt3 and Wnt3a (gifts from Roel Nusse, Stanford University), Wnt5a and 7b (gifts from Andrew McMahon, Harvard University), Wnt8b (IMAGE clone #40056929), sFRP1 and sFRP2 (gifts from Sam Pleasure, UCSF), sFRP5 (IMAGE clone #1244831), Dkk2 (IMAGE clone #3483699), Dkk3 (IMAGE clone #6465233), Fzd10 (IMAGE clone #556296), Axin2 (a gift from Frank Costantini, Columbia University), and LEF1 and TCF4 were cloned by reverse transcriptase-polymerase chain reaction from mouse embryonic brain cDNA. IMAGE clones were purchased from Open Biosystems or Invitrogen.
Immunohistochemistry was performed as described (Vue et al., 2007, 2009). The two additional antibodies used are anti-Dkk2 (R&D Systems, AF2435) and anti-TCF4 (Millipore 05-511).
Quantification of In Situ Hybridization Images
In situ hybridization for Axin2 was performed, and regional differences in pixel intensity in the thalamus was quantified using the Image J program. Images were converted to black and white and inverted, and a line was drawn along the length of the BrdU-positive ventricular zone, starting at the dorsal-most tip and extending to the ZLI. The “Plot Profile” function was used to obtain values for each pixel along the line. The images shown in Figure 2 were used for the quantification panels in Figure 2.
Acknowledgments
We thank Tou Yia Vue for helpful comments on the manuscript, Lauren Bolopue and Melody Lee for excellent technical assistance, and all members of Nakagawa and Koyano laboratories for discussion. We thank Sam Pleasure, Roel Nusse, Andrew McMahon, and Frank Costantini for plasmids, and Kyuson Yun for BAT-gal mice. Y.N. was funded by grants from Minnesota Medical Foundation and NINDS, N.K-N. was funded by the NIMH, and K.B received a Graduate School Fellowship from the University of Minnesota.
Grant sponsor: Minnesota Medical Foundation; Grant sponsor: NINDS; Grant number: NS049357; Grant sponsor: NIMH; Grant number: MN078998; Grant sponsor: NICHD; Grant number: Developmental Biology Training Grant 5T32HD007480.
References
- Alvarez-Medina R, Cayuso J, Okubo T, Takada S, Marti E. Wnt canonical pathway restricts graded Shh/Gli patterning activity through the regulation of Gli3 expression. Development. 2008;135:237–247. doi: 10.1242/dev.012054. [DOI] [PubMed] [Google Scholar]
- Alvarez-Medina R, Le Dreau G, Ros M, Marti E. Hedgehog activation is required upstream of Wnt signaling to control neural progenitor proliferation. Development. 2009;136:3301–3309. doi: 10.1242/dev.041772. [DOI] [PubMed] [Google Scholar]
- Baek JH, Hatakeyama J, Sakamoto S, Ohtsuka T, Kageyama R. Persistent and high levels of Hes1 expression regulate boundary formation in the developing central nervous system. Development. 2006;133:2467–2476. doi: 10.1242/dev.02403. [DOI] [PubMed] [Google Scholar]
- Barolo S. Transgenic Wnt/TCF pathway reporters: all you need is Lef? Oncogene. 2006;25:7505–7511. doi: 10.1038/sj.onc.1210057. [DOI] [PubMed] [Google Scholar]
- Bonner J, Gribble SL, Veien ES, Nikolaus OB, Weidinger G, Dorsky RI. Proliferation and patterning are mediated independently in the dorsal spinal cord downstream of canonical Wnt signaling. Dev Biol. 2008;313:398–407. doi: 10.1016/j.ydbio.2007.10.041. [DOI] [PMC free article] [PubMed] [Google Scholar]
- Braun MM, Etheridge A, Bernard A, Robertson CP, Roelink H. Wnt signaling is required at distinct stages of development for the induction of the posterior forebrain. Development. 2003;130:5579–5587. doi: 10.1242/dev.00685. [DOI] [PubMed] [Google Scholar]
- Bulfone A, Kim HJ, Puelles L, Porteus MH, Grippo JF, Rubenstein JL. The mouse Dlx-2 (Tes-1) gene is expressed in spatially restricted domains of the forebrain, face and limbs in midgestation mouse embryos. Mech Dev. 1993;40:129–140. doi: 10.1016/0925-4773(93)90071-5. [DOI] [PubMed] [Google Scholar]
- Chenn A. Wnt/beta-catenin signaling in cerebral cortical development. Organogenesis. 2008;4:76–80. doi: 10.4161/org.4.2.5852. [DOI] [PMC free article] [PubMed] [Google Scholar]
- Ciani L, Salinas PC. WNTs in the vertebrate nervous system: from patterning to neuronal connectivity. Nat Rev Neurosci. 2005;6:351–362. doi: 10.1038/nrn1665. [DOI] [PubMed] [Google Scholar]
- Diep DB, Hoen N, Backman M, Machon O, Krauss S. Characterisation of the Wnt antagonists and their response to conditionally activated Wnt signalling in the developing mouse forebrain. Brain Res Dev Brain Res. 2004;153:261–270. doi: 10.1016/j.devbrainres.2004.09.008. [DOI] [PubMed] [Google Scholar]
- Echelard Y, Epstein DJ, St-Jacques B, Shen L, Mohler J, McMahon JA, McMahon AP. Sonic hedgehog, a member of a family of putative signaling molecules, is implicated in the regulation of CNS polarity. Cell. 1993;75:1417–1430. doi: 10.1016/0092-8674(93)90627-3. [DOI] [PubMed] [Google Scholar]
- Fischer T, Guimera J, Wurst W, Prakash N. Distinct but redundant expression of the Frizzled Wnt receptor genes at signaling centers of the developing mouse brain. Neuroscience. 2007;147:693–711. doi: 10.1016/j.neuroscience.2007.04.060. [DOI] [PubMed] [Google Scholar]
- Galceran J, Miyashita-Lin EM, Devaney E, Rubenstein JL, Grosschedl R. Hippocampus development and generation of dentate gyrus granule cells is regulated by LEF1. Development. 2000;127:469–482. doi: 10.1242/dev.127.3.469. [DOI] [PubMed] [Google Scholar]
- Garda AL, Puelles L, Rubenstein JL, Medina L. Expression patterns of Wnt8b and Wnt7b in the chicken embryonic brain suggest a correlation with forebrain patterning centers and morphogenesis. Neuroscience. 2002;113:689–698. doi: 10.1016/s0306-4522(02)00171-9. [DOI] [PubMed] [Google Scholar]
- Hashimoto-Torii K, Motoyama J, Hui CC, Kuroiwa A, Nakafuku M, Shimamura K. Differential activities of Sonic hedgehog mediated by Gli transcription factors define distinct neuronal subtypes in the dorsal thalamus. Mech Dev. 2003;120:1097–1111. doi: 10.1016/j.mod.2003.09.001. [DOI] [PubMed] [Google Scholar]
- Ishibashi M, McMahon AP. A sonic hedgehog-dependent signaling relay regulates growth of diencephalic and mesencephalic primordia in the early mouse embryo. Development. 2002;129:4807–4819. doi: 10.1242/dev.129.20.4807. [DOI] [PubMed] [Google Scholar]
- Jho EH, Zhang T, Domon C, Joo CK, Freund JN, Costantini F. Wnt/beta-catenin/Tcf signaling induces the transcription of Axin2, a negative regulator of the signaling pathway. Mol Cell Biol. 2002;22:1172–1183. doi: 10.1128/MCB.22.4.1172-1183.2002. [DOI] [PMC free article] [PubMed] [Google Scholar]
- Joksimovic M, Yun BA, Kittappa R, Anderegg AM, Chang WW, Taketo MM, McKay RD, Awatramani RB. Wnt antagonism of Shh facilitates midbrain floor plate neurogenesis. Nat Neurosci. 2009;12:125–131. doi: 10.1038/nn.2243. [DOI] [PubMed] [Google Scholar]
- Jones EG. The thalamus. New York: Cambridge University Press; 2007. [Google Scholar]
- Kataoka A, Shimogori T. Fgf8 controls regional identity in the developing thalamus. Development. 2008;135:2873–2881. doi: 10.1242/dev.021618. [DOI] [PubMed] [Google Scholar]
- Kaufman MH. Atlas of mouse development. San Diego: Academic Press; 1992. [Google Scholar]
- Kiecker C, Lumsden A. Hedgehog signaling from the ZLI regulates diencephalic regional identity. Nat Neurosci. 2004;7:1242–1249. doi: 10.1038/nn1338. [DOI] [PubMed] [Google Scholar]
- Kobayashi D, Kobayashi M, Matsumoto K, Ogura T, Nakafuku M, Shimamura K. Early subdivisions in the neural plate define distinct competence for inductive signals. Development. 2002;129:83–93. doi: 10.1242/dev.129.1.83. [DOI] [PubMed] [Google Scholar]
- Lee SM, Tole S, Grove E, McMahon AP. A local Wnt-3a signal is required for development of the mammalian hippocampus. Development. 2000;127:457–467. doi: 10.1242/dev.127.3.457. [DOI] [PubMed] [Google Scholar]
- Lei Q, Jeong Y, Misra K, Li S, Zelman AK, Epstein DJ, Matise MP. Wnt signaling inhibitors regulate the transcriptional response to morphogenetic Shh-Gli signaling in the neural tube. Dev Cell. 2006;11:325–337. doi: 10.1016/j.devcel.2006.06.013. [DOI] [PubMed] [Google Scholar]
- Liu C, Wang Y, Smallwood PM, Nathans J. An essential role for Frizzled5 in neuronal survival in the parafascicular nucleus of the thalamus. J Neurosci. 2008;28:5641–5653. doi: 10.1523/JNEUROSCI.1056-08.2008. [DOI] [PMC free article] [PubMed] [Google Scholar]
- Louvi A, Yoshida M, Grove EA. The derivatives of the Wnt3a lineage in the central nervous system. J Comp Neurol. 2007;504:550–569. doi: 10.1002/cne.21461. [DOI] [PubMed] [Google Scholar]
- Maretto S, Cordenonsi M, Dupont S, Braghetta P, Broccoli V, Hassan AB, Volpin D, Bressan GM, Piccolo S. Mapping Wnt/beta-catenin signaling during mouse development and in colorectal tumors. Proc Natl Acad Sci U S A. 2003;100:3299–3304. doi: 10.1073/pnas.0434590100. [DOI] [PMC free article] [PubMed] [Google Scholar]
- Megason SG, McMahon AP. A mitogen gradient of dorsal midline Wnts organizes growth in the CNS. Development. 2002;129:2087–2098. doi: 10.1242/dev.129.9.2087. [DOI] [PubMed] [Google Scholar]
- Nakagawa Y, O’Leary DD. Combinatorial expression patterns of LIM-homeodomain and other regulatory genes parcellate developing thalamus. J Neurosci. 2001;21:2711–2725. doi: 10.1523/JNEUROSCI.21-08-02711.2001. [DOI] [PMC free article] [PubMed] [Google Scholar]
- Puelles L, Rubenstein JL. Forebrain gene expression domains and the evolving prosomeric model. Trends Neurosci. 2003;26:469–476. doi: 10.1016/S0166-2236(03)00234-0. [DOI] [PubMed] [Google Scholar]
- Quinlan R, Graf M, Mason I, Lumsden A, Kiecker C. Complex and dynamic patterns of Wnt pathway gene expression in the developing chick forebrain. Neural Dev. 2009;4:35. doi: 10.1186/1749-8104-4-35. [DOI] [PMC free article] [PubMed] [Google Scholar]
- Robertson CP, Braun MM, Roelink H. Sonic hedgehog patterning in chick neural plate is antagonized by a Wnt3-like signal. Dev Dyn. 2004;229:510–519. doi: 10.1002/dvdy.10501. [DOI] [PubMed] [Google Scholar]
- Salinas PC, Nusse R. Regional expression of the Wnt-3 gene in the developing mouse forebrain in relationship to diencephalic neuromeres. Mech Dev. 1992;39:151–160. doi: 10.1016/0925-4773(92)90042-i. [DOI] [PubMed] [Google Scholar]
- Ulloa F, Itasaki N, Briscoe J. Inhibitory Gli3 activity negatively regulates Wnt/beta-catenin signaling. Curr Biol. 2007;17:545–550. doi: 10.1016/j.cub.2007.01.062. [DOI] [PubMed] [Google Scholar]
- Vieira C, Garda AL, Shimamura K, Martinez S. Thalamic development induced by Shh in the chick embryo. Dev Biol. 2005;284:351–363. doi: 10.1016/j.ydbio.2005.05.031. [DOI] [PubMed] [Google Scholar]
- Vue TY, Aaker J, Taniguchi A, Kazemzadeh C, Skidmore JM, Martin DM, Martin JF, Treier M, Nakagawa Y. Characterization of progenitor domains in the developing mouse thalamus. J Comp Neurol. 2007;505:73–91. doi: 10.1002/cne.21467. [DOI] [PubMed] [Google Scholar]
- Vue TY, Bluske K, Alishahi A, Yang LL, Koyano-Nakagawa N, Novitch B, Nakagawa Y. Sonic hedgehog signaling controls thalamic progenitor identity and nuclei specification in mice. J Neurosci. 2009;29:4484–4497. doi: 10.1523/JNEUROSCI.0656-09.2009. [DOI] [PMC free article] [PubMed] [Google Scholar]
- Wang Y, Thekdi N, Smallwood PM, Macke JP, Nathans J. Frizzled-3 is required for the development of major fiber tracts in the rostral CNS. J Neurosci. 2002;22:8563–8573. doi: 10.1523/JNEUROSCI.22-19-08563.2002. [DOI] [PMC free article] [PubMed] [Google Scholar]
- Zechner D, Muller T, Wende H, Walther I, Taketo MM, Crenshaw EB, III, Treier M, Birchmeier W, Birchmeier C. Bmp and Wnt/beta-catenin signals control expression of the transcription factor Olig3 and the specification of spinal cord neurons. Dev Biol. 2007;303:181–190. doi: 10.1016/j.ydbio.2006.10.045. [DOI] [PubMed] [Google Scholar]
- Zhou CJ, Pinson KI, Pleasure SJ. Severe defects in dorsal thalamic development in low-density lipoprotein receptor-related protein-6 mutants. J Neurosci. 2004;24:7632–7639. doi: 10.1523/JNEUROSCI.2123-04.2004. [DOI] [PMC free article] [PubMed] [Google Scholar]
- Zhou L, Bar I, Achouri Y, Campbell K, De Backer O, Hebert JM, Jones K, Kessaris N, de Rouvroit CL, O’Leary D, Richardson WD, Goffinet AM, Tissir F. Early forebrain wiring: genetic dissection using conditional Celsr3 mutant mice. Science. 2008;320:946–949. doi: 10.1126/science.1155244. [DOI] [PMC free article] [PubMed] [Google Scholar]
- Zhou L, Qu Y, Tissir F, Goffinet AM. Role of the atypical cadherin Celsr3 during development of the internal capsule. Cereb Cortex. 2009;19(Suppl 1):i114–9. doi: 10.1093/cercor/bhp032. [DOI] [PubMed] [Google Scholar]