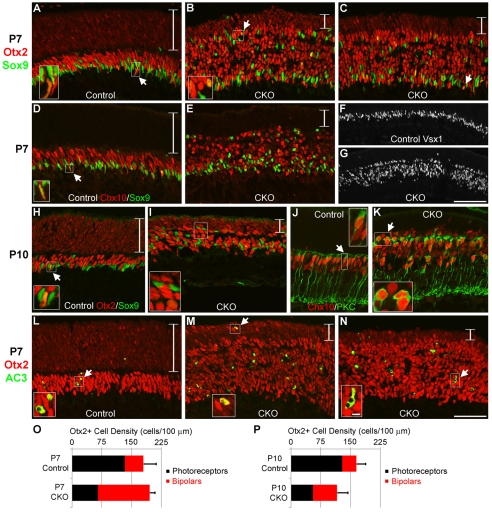
Fig. 4.
Otx2+ cells in Blimp1 CKO mice switch from photoreceptor to bipolar fate. All panels show peripheral retina. (A-C) P7 control (A) and CKO (B,C) retinas stained for Otx2 (red) and Sox9 (green). The small, fainter Otx2+ nuclei are photoreceptors and the large, bright nuclei are bipolar cells. The photoreceptor layer (bracketed) is much thinner in CKO mice and there is a proportional increase in the number of bipolar cells. In both control and CKO sections, several Sox9+ cells co-express Otx2 (arrows). CKO mice also have more Sox9+ cells (mostly glia), which are scattered throughout the retina. (D,E) P7 control (D) and CKO (E) sections stained for Chx10 (red) and Sox9 (green). CKO mice have more Chx10+ bipolars and Sox9+ cells. The arrow shows a double-labeled Müller cell. (F,G) P7 control (F) and CKO (G) retinas stained for Vsx1. There are many more Vsx1+ bipolars in CKO mice and their distribution is broader. (H,I) P10 control (H) and CKO (I) sections stained for Otx2 (red) and Sox9 (green). At this stage, the ONL (bracketed) is much thinner in CKO mice and there are fewer excess bipolars and glia than seen at P7. Otx2+/Sox9+ cells were detected (arrow). (J,K) P10 control (J) and CKO (K) mice stained for Chx10 (red) and PKC (green) to label bipolars. (J) All rod bipolars express PKC and Chx10 (arrow), forming a row in the INL. In CKO mice (K), there are more PKC- and Chx10-labeled bipolars (arrow). (L-N) P7 control (L) and CKO (M,N) retinas stained for Otx2 (red) and activated caspase 3 (AC3) (green). Most of the dying cells in controls and CKO mice are in the bipolar cell area rather than in the photoreceptor area (bracketed). CKO mice have ∼3-fold more dying cells than controls, some of which are still Otx2+ (arrows). (O,P) Otx2+ photoreceptor (black) and bipolar (red) cell density measured at P7 (O) and P10 (P). At P7 there is an approximately one-to-one fate shift in the CKO Otx2+ population. The error bars indicate the s.d. of the total Otx2+ cells counted. Scale bars: 50 μm, except 100 μm in F,G and 5 μm in insets.

