Abstract
Background
— Pulmonary artery size is a crucial determinant of hemodynamic energy loss in total cavopulmonary connections (TCPC). We investigate the impact of aortic arch reconstruction on left pulmonary artery size based on their anatomical proximity.
Methods
— 32 Fontan patients – 16 hypoplastic left heart syndrome (HLHS) and 16 non-hypoplastic left heart syndrome (NHLHS) were selected from the multi-center Fontan MRI database at Georgia Institute of Technology. The 16 datasets were consecutive with full anatomic reconstructions of the TCPC and aortic arch with no artifacts. The size of the aorta along the transverse arch and LPA size in region below the aortic arch was quantified using a previously validated skeletonization technique.
Results
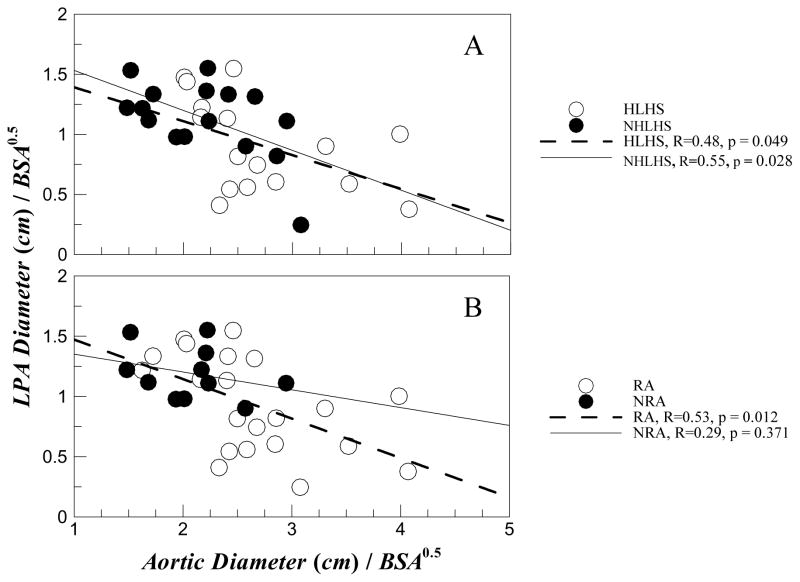
—The transverse aortic and LPA measurements (median, max, and min) for NHLHS was (2.2, 3.1, 1.5) and (1.2, 1.6, and 0.2) respectively compared to (2.5, 4.1, 2.0) and (0.9, 1.5, 0.4) for HLHS patients. Thus transverse aortic diameter of HLHS patients was on an average 24% greater than that for NHLHS patients (p<0.05), while the LPA diameter of HLHS patients was smaller than that of NHLHS patients (p<0.05). Regression analysis showed a significant negative correlation (p<0.05) between aortic and LPA diameter in both HLHS and NHLHS groups. However, when the study group was re-grouped into reconstructed aorta (RA) and non-reconstructed aorta (NRA) groups, the negative correlation was only significant for patients with RA regardless of ventricular pathology (p<0.02).
Conclusions
— Stage 1 aortic reconstruction procedures that result in a large aorta limits left pulmonary artery (LPA) size in Fontan patients.
Keywords: LPA stenosis, energy, dissipation, norwood, fontan
INTRODUCTION
Pulmonary artery stenosis is a common lesion that limits the efficacy of Fontan surgery1–3, particularly because patients with single ventricle (SV) Fontan physiology need an energy efficient circulatory system for minimizing the work load on the single ventricle4, 5. While there exist several studies that focus on characterizing the hemodynamics of various stages leading to the Fontan physiology 4–7, there is yet no possible explanation to the cause of pulmonary artery stenosis. Our previous paper8 and Senzaki et al.9 showed that a limiting pulmonary artery causes significant energy losses that impact the resting cardiac output or ventricular afterload.
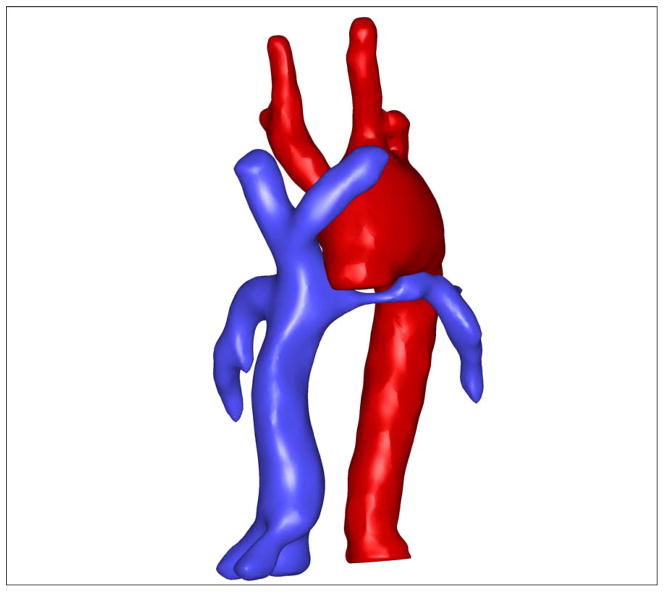
With the large anatomical database of Fontan patients available at Georgia Tech, it is now possible to study how various vessels may interact with one another with respect to their complex anatomies. The present work focuses on a possible physical interaction between the left pulmonary artery (LPA) and aortic arch as the two structures are intimately close and connected – i.e. the aortic arch passes over the LPA as depicted in the full anatomical reconstruction shown in Figure 1. Noticing that the aorta shown in Figure 1 is large and has been reconstructed during the first stage of the three Fontan operations, we hypothesize that stenosis in LPA may be caused by sheer physical constraints placed on the LPA by the reconstructed aortic geometry. The present work tests this hypothesis in two distinct classes of single ventricle patients – those with hypolastic left heart syndrome (HLHS) and those without (NHLHS) – as aortic reconstruction is performed in both of these groups. The results of this work demonstrate how the three stages of the Fontan surgery and their outcomes are not entirely independent. Specifically, while the aortic reconstruction may be optimal at the time of surgery, it may diminish the efficacy of a surgery at a later stage calling for a more sophisticated planning of the entire course of palliation.
Figure 1.
Example of a reconstructed aorta overlaying a narrowed LPA.
METHODS
Thirty-two patients, 16 each of HLHS and NHLHS, were selected from an MRI database of Fontan patients [http://fontan.bme.gatech.edu]. The database is part of an NIH-funded ongoing study for understanding Fontan hemodynamics. All patients were imaged either at Children’s Hospital of Philadelphia (CHOP) or at Emory University/Children’s Healthcare of Atlanta (CHOA). Informed consent was obtained from all patients and all study protocols complied with the Institutional Review Boards of participating hospitals and the Georgia Institute of Technology. The inclusion criteria for this study were: (1) availability of axial MRI images to reconstruct the TCPC and Aortic arch; and (2) availability of clinical information necessary to categorize each study group. Anatomic reconstructions with visible artifacts (some geometries had loss of magnetic resonance imaging (MRI) signal due to the presence of “clips” in the vessels from surgery) were excluded from the study group.
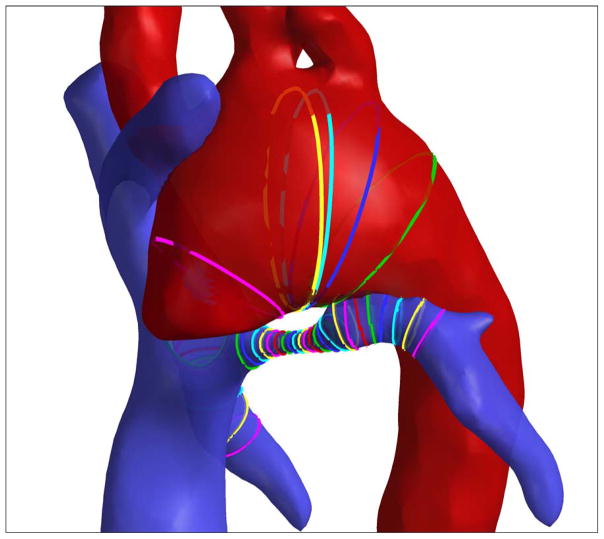
Clinical details of the studied patient population are provided in Table 1. While the Fontan database has over 200 MRI datasets, this study was limited to the first 16 HLHS and NHLHS datasets which proved to be statistically sufficient. While each patient has their unique diagnosis (see Table 1), the HLHS/NHLHS status grouping differentiates them with respect to the underlying congenital defect as done previously8, 10, 11. For all 32 patients the anatomy of the total cavopulmonary connection and the aortic arch were reconstructed using standard segmentation and reconstruction techniques12, 13. The impact of aortic arch on LPA was quantified by measuring the cross-sectional areas of the two vessels at the closest approach in the arch. The diameter at the cross-section is defined as the diameter of a circular cross-section for that area. This was performed using the skeletonization method as depicted in Figure 2. The skeletonization method has been previously used to study the geometric characteristics of the TCPC10.
Table 1.
Clinical diagnosis of the 32 patients selected in this study.
| Patient # | Diagnosis | Aortic Reconstruction | BSA (m2) | Age (Yrs) |
|---|---|---|---|---|
|
HYPOPLASTIC LEFT HEART PATIENTS | ||||
| 1 | DO-RV, MA, HLHS | YES | 1.22 | 12 |
| 2 | HLHS | YES | 1.68 | 14 |
| 3 | TGA, SLL, L AVV atresia, severe sub-PS with LPA occlusion | NO: | 1.30 | 19 |
| 4 | HLHS | YES | 0.94 | 8 |
| 5 | HLHS, ASD, LSVC to CS, clotted RSVC | YES | 1.43 | 17 |
| 6 | D transposition, LV hypoplasia, Left SVC to coronary sinus | YES | 1.9 | 16 |
| 7 | HLHS, ASD | YES | 1.23 | 12 |
| 8 | HLHS | YES | 1.358 | 16 |
| 9 | HLHS | YES | 0.994 | 10 |
| 10 | DO-RV, subaortic VSD, PS, hypoplastic MV and LV | YES | 2.05 | 19 |
| 11 | LTGA, SLL, DO-RV, VSD, PS | YES | 0.69 | 9 |
| 12 | HLHS | YES | 0.83 | 6 |
| 13 | HLHS | YES | 0.963 | 9 |
| 14 | HLHS | YES | 0.81 | 5 |
| 15 | HLHS, bilateral SVC | YES | 0.91 | 7 |
| 16 | HLHS, ASD | YES | 0.83 | 6 |
|
NON-HYPOPLASTIC LEFT HEART PATIENTS | ||||
| 17 | HRHS, Ebstein’s anomaly of tricuspid | NO | 1.02 | 8 |
| 18 | TA, VSD | NO | 1.32 | 10 |
| 19 | SV-with subaortic and aortic valve stenosis | YES | 1.045 | 10 |
| 20 | TA, pulmonary stenosis, transposition | NO | 1.9 | 24 |
| 21 | HRV, TA, TGA, VSD | YES | 0.88 | 8 |
| 22 | TA, VSD, bilateral SVC | NO | 1.84 | 20 |
| 23 | HRV, TA | NO | 0.69 | 5 |
| 24 | HRV, TGA, TA, VSD, LPA hypoplasia | NO | 0.58 | 2 |
| 25 | TA, VSD | NO | 0.872 | 7 |
| 26 | PA, IVS | NO | 1.177 | 11 |
| 27 | SV DI-LV, VPS-TGA | YES | 1.064 | 9 |
| 28 | SV-PA, IVS, HRV | NO | 1.04 | 12 |
| 29 | sub pulmonary stenosis, HRV, TGA, VSD | YES | 0.813 | 6 |
| 30 | TA, D-transposition, hypoplastic arch, small VSD | YES | 0.74 | 7 |
| 31 | Pulmonary atresia, HRV | NO | 1.49 | 15 |
| 32 | Single ventricle-DORV, VSD, Aortic Arch Hypoplasia | YES | 1.41 | 14 |
AA - aortic arch; ASD - atrial septal defect; AV - atrioventricular; BDG - bidirectional glenn; DI - double inlet; DO - Double Outlet; DX – dextrocardia; Hemi - hemi-Fontan; HLHS - hypoplastic left heart syndrome; HRV - hypoplastic right ventricle; IVS - intact ventricular septum; LV - left ventricle; MA -Mitral Atresia; PA - pulmonary atresia; PS – pulmonary stenosis; RV - right ventricle; SV - single ventricle; TA - tricuspid atresia; TGA - transposition of great arteries; VSD - ventricular septal defect.
Figure 2.
Skeletonization view of the Aorta-LPA overlap region. Ribbons are cross-sections of the respective vessels. Minimum LPA area was located followed by the area of the transverse aortic cross-section closest to the minimum LPA location.
Statistical Analysis
Since the data were non-normally distributed and corresponded to a two-sample population (HLHS vs. NHLHS or reconstructued aorta (RA) vs. non-reconstructed aorta (NRA)), the non-parametric Mann-Whitney test was used to examine statistical significance among the various geometric parameters evaluated. Differentiating factors are considered statistically significant for p values < 0.05.
RESULTS
The results consist of statistical analysis of the aorta and LPA diameter measurements of the 32 patients normalized by square root of patient body surface area (BSA) based on available allometric relationship14. The data is analyzed between the HLHS vs. NHLHS patient groups and also simultaneously between reconstructed aorta (RA) vs. non reconstructed aorta (NRA) groups. We define RA as the reconstruction of that involves the aortic arch from the ascending portion to the the ductus insertion region. For instance, a repair of an aortic coarctation is not defined as RA. This is necessary to precisely determine whether or not RA is a factor in LPA narrowing independent of underlying ventricular abnormality.
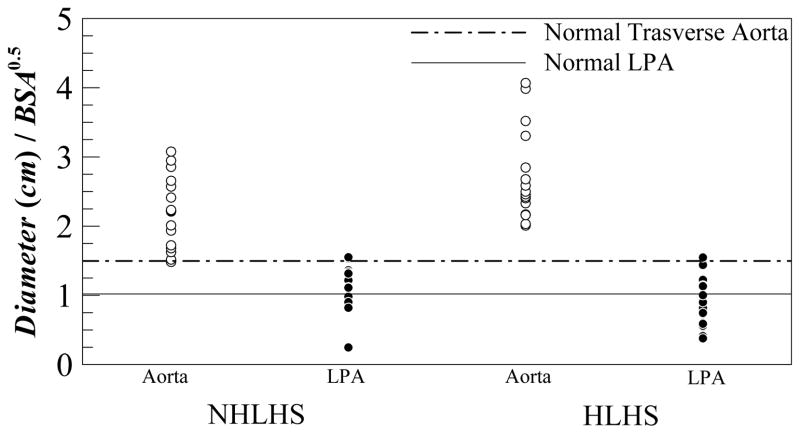
Figure 3 shows a scatter plot of the transverse aortic and LPA diameters normalized by BSA½ for all the patients. The figure also compares these data against average values for healthy children (about 1.0 cm/m for LPA and 1.5 cm/m for transverse aorta)14. For the NHLHS patient group the (median, max, and min) values in cm/m for the aortic and LPA measurements was (2.2, 3.1, 1.5) and (1.2, 1.6, and 0.2) respectively. For the HLHS patient group these scatter characteristics were (2.5, 4.1, 2.0) and (0.9, 1.5, 0.4) for the aortic and LPA measurements, respectively.
Figure 3.
Scatter plot of measured transverse aortic and LPA diameters for NHLHS and HLHS patient groups. Solid line and dashed line represent normal LPA and transverse aortic dimensions in healthy children.
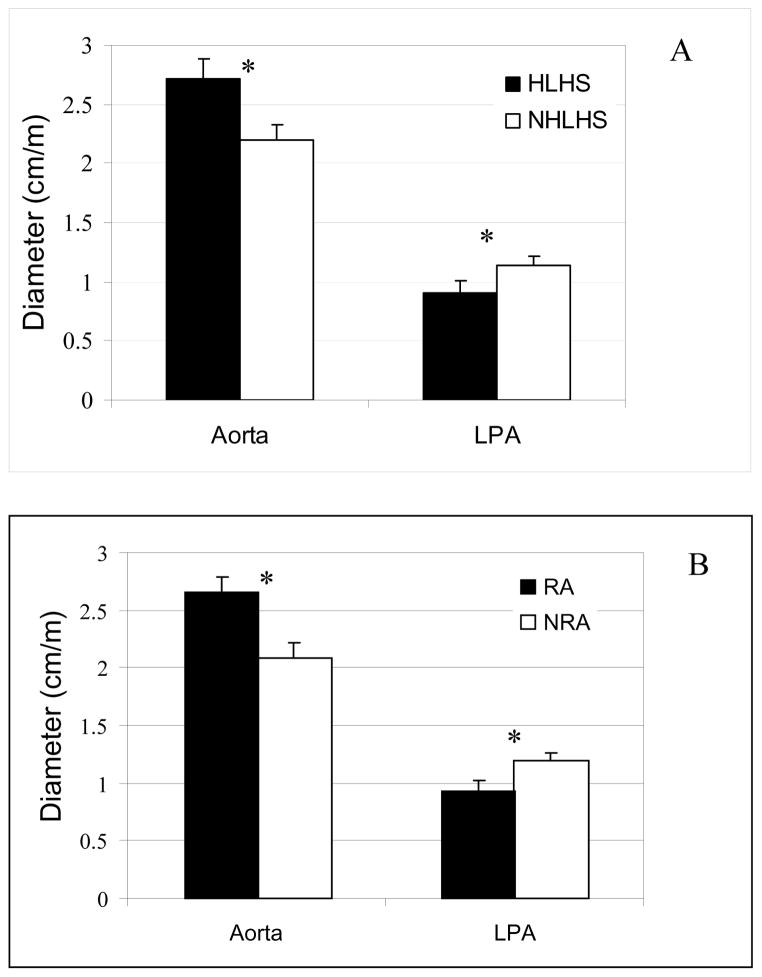
The mean of the normalized aortic and LPA diameters are shown in Figure 4 and are compared statistically. The aortic diameter for HLHS patient group was statistically greater (p<0.05) than NHLHS patient group by about 24%. The figure also shows that LPA diameter for HLHS patient group is smaller than that for NHLHS patient group (p<0.05). Figure 4b shows the same comparison between aortic and LPA diameters between patients for RA vs. NRA groups. Aortic diameter is statistically greater and LPA diameter is statistically smaller in patients with RA vs. NRA.
Figure 4.
Comparison between Aortic and LPA sizes at the junction across: (A) HLHS and NHLHS patient groups; and (B) Patients with RA and NRA respectively. * indicated p<0.05.
Figure 5 depicts results from regression analysis of the data between HLHS vs. NHLHS and RA vs. NRA groups respectively where the LPA diameter is plotted as a function of the aortic diameter. Figure 5a shows that in both HLHS and NHLHS groups there is a statistically significant (p<0.05) association between increasing aortic diameter causing decreasing LPA diameter. Figure 5b however shows that NRA group does not have any statistically significant association between increasing aortic diameter with decreasing LPA diameter. In addition, the p value for statistical significance for RA group is the smallest (p=0.012).
Figure 5.
Indexed LPA diameter plotted against indexed aortic diameter at the junction with regression analysis shown for (A) HLHS and NHLHS patient groups; and (B) patients with RA and NRA respectively.
DISCUSSION
Figure 1 and 2 clearly depict the possible impact a large aorta may have on the LPA that is anatomically situated right below the arch. Note that all of these reconstructions are blood volumes only, i.e. the surfaces in Figures 1 and 2 are the inner walls of the lumen. Therefore the small gap seen between the aorta and the LPA in Figure 2 is in fact occupied by the vessel wall thickness. Examination of the raw MRI images confirmed this. From Figure 3, notice that almost all the patients have aortas bigger than that in a healthy child14 while the LPA is distributed equally about the normal for HLHS and skewed in NHLHS patients. To give a feel for the range of aortic sizes, the smallest aorta in the entire data set was the most normal (i.e. healthy) with a size of 1.5 cm/m (same as for healthy patients14) while the largest aorta was 2.7 times bigger at 4.1 cm/m. This implies that this enlarged aorta provides 7.5 times more flow area. The maximum aorta was 3.7 cm (patient BSA was 0.83m2) and the patient would have 225% more flow area when adult (based on an adult aorta of 2.5cm). An enlarged aorta of such proportions itself creates significant energy losses owing to the expansion and contraction of the aortic flow thus further increasing the energetic load on the single ventricle. The smallest LPA was 0.2 cm/m, which provides roughly 25 times lower flow area than in a healthy LPA. The scatter of LPA in NHLHS group shows that there was one patient with abnormally low LPA while the rest were skewed above the normal healthy value. For the HLHS group the LPA scatter was about equally distributed about the healthy/normal value.
Statistical analysis represented in Figure 4 clearly shows that the aortic diameter was larger for the HLHS group when compared to NHLHS group (p<0.05). Analysis also showed that the aortic diameter was larger in the RA group compared to the NRA group (p<0.01). This may be explained as the data set also showed it is more probable that a HLHS patient has a reconstructed aorta with a probability of 93.75%. In stark comparison, the probability that an NHLHS patient has RA is only 37.50%. Therefore, the statistical significance for larger aorta in Figure 4a is due to the confounding variable of whether or not the aorta was reconstructed or not reconstructed.
However, this still leaves the question “Does an enlarged aorta constrict LPA?” To answer this question, we performed regression analysis as depicted in Figure 5. Figure 5a shows that in both HLHS and NHLHS groups increased aorta size resulted in decreased LPA size. However, as shown in Figure 5b, increased aorta resulted in a statistically significant reduction in LPA size only for the RA patient group (p=0.012). Moreover, for the NRA group there was no statistically significant correlation with a high p value of 0.37. This implies that narrowing of the LPA is only related to reconstructed aortas and the underlying defect (HLHS or NHLHS) does not play a role.
While this study shows how important stage 1 reconstruction can be on the development of LPA in Fontan patients, it also brings to attention the question : What is a good aortic reconstruction size? Although this study does not provide a direct answer, we do want to mention that enlarged aortas such as those discussed above with a cross-sectional area more than twice the size of a typical adult transverse aorta will contribute to increased hemodynamic energy loss. Given that, we recommend that the reconstructed aorta be no larger than a healthy adult aorta. An additional parameter that can mitigate the constriction of the LPA by the aorta is the length of the aortic arch. A longer length would force the arch to shift in the superior direction thus relatively moving away from the LPA.
CONCLUSION AND SIGNIFICANCE
It has been shown that aortic reconstruction which takes place in stage 1 of the 3 palliative surgical procedures that result in the Fontan physiology play a crucial role on LPA growth. Specifically, an enlarged aorta may contribute to diminished LPA possibly due to imposed spatial constraints. Reconstructed aortas with over twice the flow area of an adult aorta were noted in these young patients and demonstrate that there needs to be an upper limit placed on the allowable size of a reconstructed aorta in pediatric patients. An enlarged aorta may not only cause LPA stenosis but also in itself create significant energy losses owing to the expansion and contraction of the flow thus further increasing the energetic load on the single ventricle.
Acknowledgments
The authors gratefully acknowledge the Bioengineering Research Partnership (BRP) grant from NIH (HL67622).
Footnotes
Publisher's Disclaimer: This is a PDF file of an unedited manuscript that has been accepted for publication. As a service to our customers we are providing this early version of the manuscript. The manuscript will undergo copyediting, typesetting, and review of the resulting proof before it is published in its final citable form. Please note that during the production process errors may be discovered which could affect the content, and all legal disclaimers that apply to the journal pertain.
References
- 1.Disessa TG, Yeatman LA, Williams RG, Lois JF, Friedman WF, Laks H. THROMBOSIS COMPLICATING BALLOON ANGIOPLASTY OF LEFT PULMONARY-ARTERY STENOSIS AFTER FONTAN PROCEDURE - SUCCESSFUL TREATMENT WITH INTRAVENOUS STREPTOKINASE. American Journal of Cardiology. 1985;55(5):610–611. doi: 10.1016/0002-9149(85)90271-1. [DOI] [PubMed] [Google Scholar]
- 2.Lock JE, Castanedazuniga WR, Fuhrman BP, Bass JL. BALLOON DILATION ANGIOPLASTY OF HYPOPLASTIC AND STENOTIC PULMONARY-ARTERIES. Circulation. 1983;67(5):962–967. doi: 10.1161/01.cir.67.5.962. [DOI] [PubMed] [Google Scholar]
- 3.Pekkan K, Kitajima HD, de Zelicourt D, Forbess JM, Parks WJ, Fogel MA, Sharma S, Kanter KR, Frakes D, Yoganathan AP. Total cavopulmonary connection flow with functional left pulmonary artery stenosis - Angioplasty and fenestration in vitro. Circulation. 2005;112(21):3264–3271. doi: 10.1161/CIRCULATIONAHA.104.530931. [DOI] [PubMed] [Google Scholar]
- 4.Senzaki H, Masutani S, Kobayashi J, Kobayashi T, Sasaki N, Asano H, Kyo S, Yokote Y, Ishizawa A. Ventricular afterload and ventricular work in Fontan circulation - Comparison with normal two-ventricle circulation and single-ventricle circulation with Blalock-Taussig shunts. Circulation. 2002;105(24):2885–2892. doi: 10.1161/01.cir.0000018621.96210.72. [DOI] [PubMed] [Google Scholar]
- 5.Sundareswaran KS, Pekkan K, Dasi LP, Whitehead K, Sharma S, Kanter KR, Fogel MA, Yoganathan AP. The total cavopulmonary connection resistance: a significant impact on single ventricle hemodynamics at rest and exercise. Am J Physiol Heart Circ Physiol. 2008;295(6):H2427–2435. doi: 10.1152/ajpheart.00628.2008. [DOI] [PMC free article] [PubMed] [Google Scholar]
- 6.Pekkan K, Dasi L, de Zélicourt D, Sundareswaran K, Fogel M, Kanter K, Yoganathan A. Hemodynamic Performance of Stage-2 Univentricular Reconstruction: Glenn vs. Hemi-Fontan Templates. Annals of Biomedical Engineering. 2009;37(1):50–63. doi: 10.1007/s10439-008-9591-z. [DOI] [PMC free article] [PubMed] [Google Scholar]
- 7.Whitehead KK, Pekkan K, Kitajima HD, Paridon SM, Yoganathan AP, Fogel MA. Nonlinear power loss during exercise in single-ventricle patients after the Fontan - Insights from computational fluid dynamics. Circulation. 2007;116(11):I165–I171. doi: 10.1161/CIRCULATIONAHA.106.680827. [DOI] [PubMed] [Google Scholar]
- 8.Dasi LP, KrishnankuttyRema R, Kitajima HD, Pekkan K, Sundareswaran K, Fogel M, Sharma S, Whitehead K, Kanter K, Yoganathan AP. Fontan hemodynamics: Importance of pulmonary artery diameter. Journal of Cardiovascular and Thoracic Surgery. 2008 doi: 10.1016/j.jtcvs.2008.04.036. Accepted article: [DOI] [PMC free article] [PubMed] [Google Scholar]
- 9.Senzaki H, Isoda T, Ishizawa A, Hishi T. RECONSIDERATION OF CRITERIA FOR THE FONTAN OPERATION - INFLUENCE OF PULMONARY-ARTERY SIZE ON POSTOPERATIVE HEMODYNAMICS OF THE FONTAN OPERATION. Circulation. 1994;89(1):266–271. doi: 10.1161/01.cir.89.1.266. [DOI] [PubMed] [Google Scholar]
- 10.KrishnankuttyRema R, Dasi LP, Pekkan K, Sundareswaran K, Fogel M, Sharma S, Kanter K, Spray T, Yoganathan AP. Quantitative analysis of extracardiac versus intraatrial Fontan anatomic geometries. Annals of Thoracic Surgery. 2008;85(3):810–817. doi: 10.1016/j.athoracsur.2007.11.082. [DOI] [PubMed] [Google Scholar]
- 11.Sundareswaran KS, Kanter KR, Kitajima HD, Krishnankutty R, Sabatier JF, Parks WJ, Sharma S, Yoganathan AP, Fogel M. Impaired power output and cardiac index with hypoplastic left heart syndrome: A magnetic resonance imaging study. Annals of Thoracic Surgery. 2006;82(4):1267–1277. doi: 10.1016/j.athoracsur.2006.05.020. [DOI] [PubMed] [Google Scholar]
- 12.Frakes DH, Conrad CP, Healy TM, Monaco JW, Fogel M, Sharma S, Smith MJT, Yoganathan AP. Application of an adaptive control grid interpolation technique to morphological vascular reconstruction. Ieee Transactions on Biomedical Engineering. 2003;50(2):197–206. doi: 10.1109/TBME.2002.807651. [DOI] [PubMed] [Google Scholar]
- 13.Frakes DH, Smith MJT, Parks J, Sharma S, Fogel M, Yoganathan AP. New techniques for the reconstruction of complex vascular anatomies from MRI images. Journal of Cardiovascular Magnetic Resonance. 2005;7(2):425–432. doi: 10.1081/jcmr-200053637. [DOI] [PubMed] [Google Scholar]
- 14.Sluysmans T, Colan SD. Theoretical and empirical derivation of cardiovascular allometric relationships in children. Journal of Applied Physiology. 2005;99(2):445–457. doi: 10.1152/japplphysiol.01144.2004. [DOI] [PubMed] [Google Scholar]


