Abstract
Objective
This study compared the area of the regurgitant orifice, as measured by the use of multidetector-row CT (MDCT), with the severity of aortic regurgitation (AR) as determined by the use of echocardiography for AR.
Materials and Methods
In this study, 45 AR patients underwent electrocardiography-gated 40-slice or 64-slice MDCT and transthoracic or transesophageal echocardiography. We reconstructed CT data sets during mid-systolic to enddiastolic phases in 10% steps (20% and 35-95% of the R-R interval), planimetrically measuring the abnormally opened aortic valve area during diastole on CT reformatted images and comparing the area of the aortic regurgitant orifice (ARO) so measured with the severity of AR, as determined by echocardiography.
Results
In the 14 patients found to have mild AR, the ARO area was 0.18±0.13 cm2 (range, 0.04-0.54 cm2). In the 15 moderate AR patients, the ARO area was 0.36 ± 0.23 cm2 (range, 0.09-0.81 cm2). In the 16 severe AR patients, the ARO area was 1.00 ± 0.51 cm2 (range, 0.23-1.84 cm2). Receiver-operator characteristic curve analysis determined a sensitivity of 85% and a specificity of 82%, for a cutoff of 0.47 cm2, to distinguish severe AR from less than severe AR with the use of CT (area under the curve = 0.91; 95% confidence interval, 0.84-1.00; p < 0.001).
Conclusion
Planimetric measurement of the ARO area using MDCT is useful for the quantitative evaluation of the severity of aortic regurgitation.
Keywords: Computed tomography (CT), Echocardiography, Aortic regurgitation, Planimetry
Echocardiography is the most frequently used imaging modality for the initial evaluation of valvular regurgitation (1). Echocardiography utilizes multiple parameters to assess the severity of valvular regurgitation, and this modality has been found to be clinically reliable in most circumstances (2-8). However, echocardiographic assessment of valvular regurgitation can be challenging in patients with restricted acoustic windows, arrhythmia, or an eccentric regurgitant jet.
Recent technical advances in the use of multidetector-row CT (MDCT) have allowed improved visualization of the morphological details of the heart, including the cardiac valves (9-22). MDCT provides an alternative diagnostic opportunity for the evaluation of the aortic valve (10-22). However, data on grading the severity of aortic valve regurgitation by using MDCT to measure the aortic regurgitant orifice (ARO) area are still insufficient for this purpose (17-22).
In this study, we aimed to establish diagnostic MDCT ARO criteria for grading the severity of aortic valve regurgitation by comparing it to the results of echocardiography, the gold standard for measuring AR severity.
MATERIALS AND METHODS
Between May 2005 and March 2008, we retrospectively enrolled 45 patients with aortic regurgitation (AR), who had been referred for an MDCT examination of the aorta and coronary arteries, into the study. The patients consisted of 23 men and 22 women (mean age, 53 years; age range, 17-82 years). All 45 patients underwent echocardiography and electrocardiography-gated MDCT. The mean interval between echocardiography and CT examination was 18 days (range, 0-60 days). The hospital Institutional Review Board approved this study.
Echocardiography
Forty-three patients underwent transthoracic echocardiography (TTE), while the remaining two patients underwent transesophageal echocardiography. Experienced cardiologists performed the echocardiography examinations. Findings were interpreted according to the recommended criteria for determining severity of AR (3). Transthoracic probes (2.0 to 4.0 MHz) and transesophageal probes (7.0 MHz) equipped with pulsed wave, continuous wave, and color Doppler capabilities were used (IE 33, Philips Medical Systems, Bothell, WA; Vivid 7 Dimension; GE Vingmed Ultrasound, Horton, Norway; C256, Sequoia, Siemens Medical Systems, Mountain View, CA). B-mode and Mmode echocardiography, combined with a color Doppler examination, was performed according to the guidelines of the American Society of Echocardiography (3). The severity of aortic regurgitation was graded as mild, moderate, or severe according to the width of the aortic regurgitant jet in the parasternal and apical views, the pressure halftime of the aortic regurgitant jet, the diastolic reversal flow in the descending aorta, the vena contracta (VC) width, and the effective regurgitant orifice (ERO) area as measured by the flow convergence method (2-8).
Multidetector-Row CT
We performed MDCT using a 40-slice CT scanner (Brilliance 40, Philips Medical Systems, Best, The Netherlands) for 20 patients and a 64-slice CT scanner (Aquilion 64, Toshiba Medical Systems, Tokyo, Japan) for 25 patients. Patients with high heart rates (> 65 beats per minute) received an oral beta-blocker (50-100 mg metoprolol) one hour before their CT examination. Patients received an injection of nonionic contrast material (iomeprol 300 mg I/ml; Bracco, Milan, Italy) via a power injector (rate: 3.5 or 4.0 ml/sec) and 18-gauge needle into a superficial vein in the antecubital fossa or forearm: 100 ml for the 40-slice CT and 65 ml for the 64-slice CT. The contrast medium bolus was followed by a 30 ml saline chaser bolus, administered at the same flow rate. We initiated CT scanning upon reaching an attenuation value of 200 HU in a selected region of interest in the ascending aorta. During data acquisition for the 40-slice CT, we used a section thickness of 0.9 mm, with a 0.45 mm increment and a pitch value of 0.2. For the 64-slice CT, we used a 0.5 mm slice thickness, with a 0.4 mm increment and a pitch value of 0.2. The X-ray tube rotation time was 0.42 sec for the 40-slice CT and 0.4 sec for the 64-slice. The X-ray tube potential was 120 kV, and the effective tube current was 700 mAs for the 40-slice CT and 400 mA for the 64-slice CT. We did not apply radiation dose modulation using the electrocardiography-pulsing technique. Transverse CT images were reconstructed using a section thickness of 1 mm and an increment of 0.2 mm for the 40-slice CT and a section thickness of 0.5 mm and an increment of 0.4 mm for the 64-slice CT. The reconstructed field of view was individually fitted to the actual cardiac size for each patient. The CT scanning range included the entire heart and the proximal ascending aorta. The effective radiation dose for the 40-slice CT was 15.7 mSv, as measured by thermoluminescent dosimetry. The effective radiation dose for the 64-slice CT was 16.1 mSv, as measured via ion chamber dosimetry.
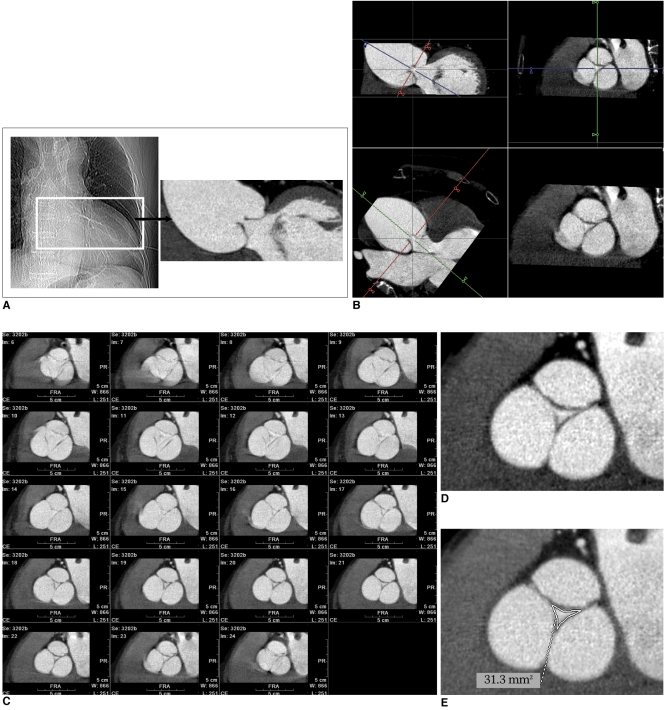
The CT data sets were reconstructed from mid-systolic to end-diastolic phases (20%, 35%, 45%, 55%, 65%, 75%, 85%, and 95% of the R-R interval). Multicycle data were used for patients with high heart rates. Two radiologists experienced in the practice and interpretation of cardiac CT analyzed the CT images in consensus. First, the cardiac phase with the largest aortic valve regurgitant area was selected from among the multiple diastolic phases. Then the abnormally open aortic valve area in the diastolic phase was planimetrically measured three times along short-axis images of the aortic valve using an Aquarius workstation (version 3.6.2.3, TeraRecon, San Mateo, CA), and the smallest area among all the measurements was used as the ARO area (Fig. 1). In a patient with right coronary cusp prolapse, an oblique coronal reformatted image was reconstructed for visualizing the ARO. Then another oblique axial image, tangential to the previous image, was reconstructed for measuring the ARO. Quantitative variables were expressed as mean ± standard deviation (SD). The ARO area, as determined on CT, was compared to the AR severity (mild, moderate, or severe) as assessed by echocardiography. Two observers also assessed the valve morphology on multiplanar reformatted and virtual angioscopic images, generated via a commercial workstation (ADW version 4.0, GE Medical Systems, Milwaukee, WI).
Fig. 1.
Demonstration of CT raw data reconstruction and aortic regurgitant orifice measurement at workstation, in 71-year-old male patient with moderate aortic regurgitation shown by transthoracic echocardiography. In this particular patient, image reconstruction was performed in 5% steps instead of 10% steps of our CT protocol.
A. Aortic valve area was chosen from CT scout image to reconstruct images of multiple cardiac phases.
B. Short-axial images of aortic valve, showing exact regurgitant orifice area produced from two orthogonal aortic longitudinal planes.
C. Resultant aortic valve short-axial images in multiple planes (5-95% in 5% steps) show almost same regurgitant areas of aortic valve during diastolic phases. Image quality is excellent during mid-diastole (65-85%).
D, E. In this case, aortic regurgitant orifice area via CT measured 0.31 cm2. Vena contracta, effective regurgitant orifice, and pressure half-time at echocardiography were 0.44 cm, 0.30 cm2, and 272 ms, respectively.
The reformatted CT images were scored from 1 to 4 on the quality of their depiction of the aortic valves. Valve images showing a well-delineated commissure margin without discrete blurring, motion artifacts, and stair-step artifacts were assigned score 4. Valve images showing minimal blurring and mild motion artifacts, without any stair-step artifacts, were scored 3. Those images showing high levels of blurring and motion artifacts with mild stair-step artifacts were scored 2. Finally, those showing inadequately delineated commissures and severe stair-step artifacts were scored 1. We considered images with a score of 3 or 4 to be adequately diagnostic for AR assessment.
Statistical Analysis
Data are presented as mean ± SD. The Kruskal-Wallis test and Mann-Whitney U test were used to identify differences in the ARO areas measured via MDCT (AROCT), the VC widths, the pressure halftimes, and the echocardiographic left ventricular (LV) ejection fractions among subjects classified as having mild, moderate, and severe AR by means of echocardiography. The Mann-Whitney U test was used to compare ERO areas determined by echocardiography among patients with moderate AR and severe AR. Pearson correlation coefficients were calculated to compare the AROCT with the VC width. To determine the cutoff values for differentiating severe AR from mild/moderate AR and mild AR from moderate/severe AR, we performed receiver operation characteristic curve (ROC) analyses, using GraphPad Prism (version 4.0, GraphPad Software, San Diego, CA).
RESULTS
In all patients, the MDCT was successful and the image quality was adequate for aortic valve evaluation (score 3, 78%; score 4, 22%). Mean heart rate during CT scanning was 65 ± 12 beats/min (range, 48-83 beats/min). Every patient had a tricuspid aortic valve. We obtained all echocardiographic parameters for AR grading all patients, except for the ERO, which we measured in only eight patients experiencing moderate or severe AR.
In 22 patients, the AR was caused by dilatation of the aortic root, while the remaining 23 patients had abnormalities of the valve leaflets. Additional diagnoses were as follows: annuloaortic ectasia in 15 patients, Marfan syndrome in four patients, Takayasu's arteritis in three patients, and coarctation of the aorta in one patient. Nine of 23 patients with abnormalities of the valve leaflets had concomitant aortic stenosis, but the other 14 patients had only AR. Twenty patients had valvular thickening, and 12 of these 20 patients also had valvular calcifications. One patient had prolapse of the aortic cusp. MDCT showed vegetation of the aortic valve in one patient with infective endocarditis.
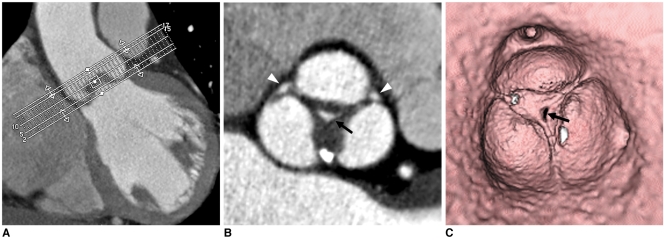
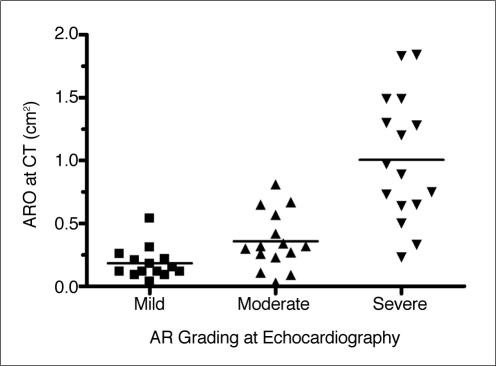
On echocardiography, 14 patients had mild AR, 15 patients had moderate AR, and 16 patients had severe AR (Figs. 2-5). In these 14 patients with mild AR, the planimetrically-measured ARO area was 0.18 ± 0.13 cm2 (range, 0.04-0.54 cm2). For the 15 patients with moderate AR, the ARO area was 0.36 ± 0.23 cm2 (range, 0.09-0.81 cm2). For the 16 patients with severe AR, the ARO area was 1.0 ±0.50 cm2 (range, 0.23-1.84 cm2) (Fig. 6). Fourteen of the 16 severe AR patients were treated surgically. For these patients, the ARO area was 0.96 ± 0.49 cm2 (range, 0.23-1.84 cm2).
Fig. 2.
60-year-old male with mild central aortic regurgitation shown by transthoracic echocardiography.
A. Image shows batch reconstruction of aortic valve short-axial images in 1 mm thicknesses and 1 mm intervals.
B. Resultant image visualizes central coaptation failure zone of 0.17 cm2 (arrow) and fusion of left and noncoronary cusps. Small areas of coaptation failure in peripheral commissure of aortic valve were suspected (arrowheads).
C. Virtual angioscopic image confirms central regurgitation area (arrow). However, there was no evidence of commissural incompetency in periphery.
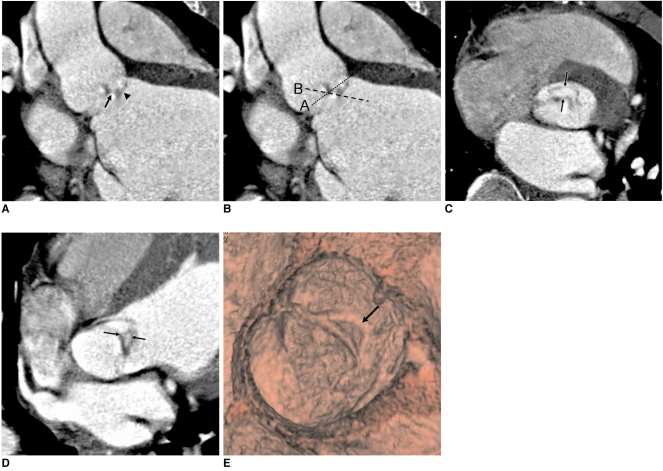
Fig. 5.
38-year-old male with right coronary cusp prolapse and eccentric aortic regurgitation.
A. Reformatted image shows prolapsed right coronary cusp (arrowhead) and coaptation failure of aortic valve (arrow).
B. Dotted lines A and B indicate image reconstruction planes for central aortic regurgitation and eccentric aortic regurgitation with prolapsed cusp, respectively.
C. Image reconstructed along plane A shows ovoid area (between arrows), indicating prolapsed part of right coronary cusp, not aortic regurgitant orifice.
D. Image reconstructed along plane B shows aortic regurgitant orifice (between arrows).
E. Virtual angioscopic image shows eccentric aortic regurgitant orifice (arrow).
Fig. 6.
Scatter plot of data shows significant difference in aortic regurgitant orifice area via CT between patients with severe AR and those with mild to moderate AR, determined with use of transthoracic echocardiography. AR = aortic regurgitation, ARO = aortic regurgitant orifice
As determined by MDCT, the ARO area was significantly different among three patient groups (mild, moderate, or severe AR) as compared by means of the Kruskal-Wallis test (p < 0.001, Table 1). The Mann-Whitney U test revealed significant differences in ARO areas between patients with mild AR and moderate AR (p < 0.05) and between patients with moderate AR and severe AR (p < 0.001). However, there was some overlap of the individual AROs among the three patient groups.
Table 1.
Quantitative Measurement of Aortic Regurgitation Determined with Transthoracic Echocardiography and MDCT
Note.-Values are means ± SD. MDCT = multidetector-row CT, LV = left ventricular, TTE = transthoracic echocardiography, NA = not assessed
aThree groups were compared by use of Kruskal-Wallis test.
bTwo groups were compared by use of Mann-Whitney U test.
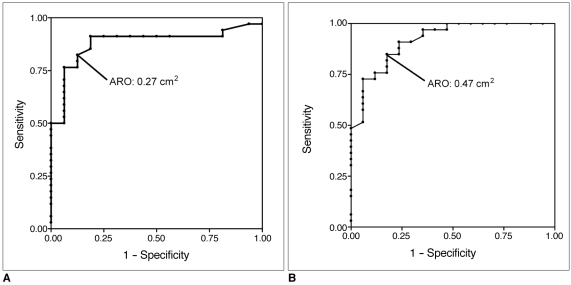
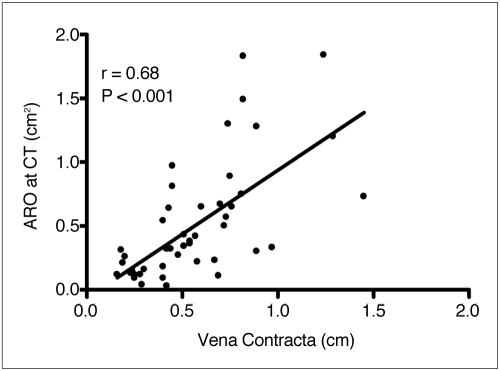
Receiver operation characteristic curve (ROC) analysis showed a cutoff of 0.27 cm2 had a sensitivity of 82% and a specificity of 88% for differentiating mild from moderate to severe AR via CT (area under the curve [AUC] = 0.88; 95% confidence interval, 0.78-0.98; p < 0.001) (Fig. 7). A similar analysis found a cutoff of 0.47 cm2 demonstrated a sensitivity of 0.85 and a specificity of 0.82 for distinguishing mild to moderate AR from severe AR (AUC = 0.91; 95% confidence interval, 0.84-1.00; p < 0.001). The VC width was significantly different among the three patient groups (p < 0.001). The correlation coefficient between ARO area and VC width was 0.68 (p < 0.001) (Fig. 8).
Fig. 7.
Receiver operation characteristic curve analysis shows accuracy of aortic regurgitant orifice area via CT in discriminating mild aortic regurgitation from moderate to severe aortic regurgitation (A) and mild to moderate aortic regurgitation from severe aortic regurgitation (B). Optimal cutoff values for mid aortic regurgitation and severe aortic regurgitation were 0.27 cm2 and 0.47 cm2, respectively. ARO = aortic regurgitant orifice
Fig. 8.
Correlation between aortic regurgitant orifice area via CT and vena contracta width shown by transthoracic echocardiography (r = 0.68, p < 0.001). ARO = aortic regurgitant orifice
DISCUSSION
Our study demonstrated that measurement of ARO area by the use of MDCT is highly feasible and that ARO area is well correlated with AR severity as determined by the use of echocardiography.
Echocardiographic Assessment of Aortic Regurgitation
In our clinical practice, AR is primarily assessed by means of echocardiography, which provides qualitative and semiquantitative assessment of aortic regurgitation by determining AR jet width, pressure halftime of aortic regurgitant continuous wave Doppler signal, degree of diastolic flow reversal in the descending or abdominal aorta, and ERO area by use of the flow convergence method. Although ERO calculated by the flow convergence proximal isovelocity surface area (PISA) method is hemodynamically the most quantitative, it is less feasible and more difficult to perform compared to mitral regurgitation, due to difficulty in obtaining high quality images of the flow convergence region in the aorta. Moreover, when this method is used, ascending aortic aneurysms, which deform the valve plane, may lead to underestimation of AR (3, 23), and either a poor acoustic window or eccentric jet characteristics (24-26) can limit echocardiographic evaluation of AR. In such clinical situations, MDCT can be an adjunct to, or alternative diagnostic modality in place of echocardiography, since MDCT provides reliable data on valve morphology and quantitative measurement of the ARO area at appropriate valve planes, regardless of the size of the ascending aorta or presence of an eccentric jet.
Multidetector-Row CT Determination of the Aortic Regurgitant Orifice Area and Its Correlation with Echocardiography
The anatomic regurgitant area represents the actual regurgitant orifice and most reliably quantifies the severity of AR. In a study by Ozkan et al. (27), the average enddiastolic anatomic AR areas measured planimetrically by transesophageal echocardiography were 0.15 ± 0.05 cm2 for mild AR (n = 45), 0.30 ± 0.08 cm2 for moderate AR (n = 31), and 0.68 ± 0.33 cm2 for severe AR (n = 14), using angiographic grading of aortic regurgitation as the reference technique. In a study by Alkadhi et al. (17), the investigators applied the results of classification via TTE to ARO area measurements by means of CT. Results in the present study for the mean ARO areas in mild or moderate AR were similar to corresponding results in these studies by Ozkan et al. (27) and Alkadhi et al. (17), and the mean ARO area for severe AR in the latter study was slightly higher than that determined in the present study. However, the average anatomic ARO areas determined by the use of MDCT reported by Jassal et al. (18) were lower than the average anatomic ARO areas determined in our study. In this study by Jassal et al, (18) ARO areas determined via CT were 0.04 ± 0.03 cm2 for mild AR, 0.09 ± 0.05 cm2 for moderate AR, and 0.27 ± 0.16 cm2 for severe AR. In Li et al. (20), 11 patients with mild AR had a mean ARO of 0.25 ± 0.16 cm2, 19 patients with moderate AR had a mean ARO of 0.44 ± 0.28 cm2, and four patients with severe AR had a mean ARO of 1.05 ± 0.8 cm2. The difference between these results might be due to differences in the diastolic phases when the ARO area was measured and variability in the grading of AR via echocardiography that was performed in these studies. The number of patients in the previous MDCT studies (17-20) was low (30-42 patients), and there were less than 12 patients with severe AR in each study.
In a study on 42 patients by Goffinet et al. (19), MDCT had a 91% (10 of 11) sensitivity and 94% (29 of 31) specificity for detecting severe AR at an optimal cutoff value of 0.37 cm2 ARO and a 78% (21 of 27) sensitivity and 100% (15 of 15) specificity for the detection of moderate AR at an optimal cutoff value of 0.25 cm2 ARO. The cutoff values for moderate and severe AR (0.27 cm2 and 0.47 cm2) in our study were slightly higher than those in their study.
Techniques for Multidetector-Row CT Evaluation of the Aortic Regurgitant Orifice Area
Alkadhi et al. (17) observed the maximum regurgitant orifice area in mid-diastole, at an average of 62 ± 10% of the cardiac cycle (median, 60%; range, 40-75%). According to Jassal et al. (18), the optimal diastolic phase, which demonstrates the largest regurgitant orifice area as determined by CT, was at 65% of the cardiac cycle for 35 patients, at 55% of the cardiac cycle for five patients, and at 85% of the cardiac cycle in one patient. However, the difference in the regurgitant orifice area among the diastolic cardiac phases seems to be negligible, since the aortic valve closes quickly as the diastolic phase begins and maintains the orifice until the end of diastole. Technically, the mid-diastolic phases are most optimal for the evaluation of cardiac structures, including coronary arteries, since there are fewer motion artifacts then as compared to the early or late diastolic phases.
The ideal approach for the assessment of aortic valve evaluation using MDCT is to reconstruct raw data images at a 5% R-R interval. The range of image reconstruction should preferably be confined to the aortic valve area, to reduce the total number of cardiac images. Then, short-axial and longitudinal planes of the aortic valve in the diastolic phases can be observed for assessing the degree of AR, including the ARO area measurement. We recommend determining the cardiac phase that exhibits the largest ARO area and subsequently measuring the smallest ARO area in the reconstructed images of the selected diastolic phase at the workstation. Batch reconstruction of short-axial and longitudinal images of the aortic valve during the selected diastolic phase for a 1-2 mm slice thickness and a 1-2 mm reconstruction interval may be helpful for archiving images as a further reference.
Limitations of Multidetector-Row CT in Measuring the Aortic Regurgitant Orifice Area
In the planimetric evaluation of ARO area via CT, deformities of aortic valves may lead to erroneous underestimation or overestimation of AR severity, especially in cases with eccentric AR. In these situations, virtual angioscopic views of the valves can help to assess the morphology of an incompetent aortic valve and determine the ARO more clearly. However, ARO area measurement is not possible in the virtual angioscopic approach, as this technique exaggerates valve thickness and calcifications. The technique also requires good image quality with adequate contrast enhancement. Pitfalls in the interpretation of cross-sectional CT images with regard to measurement of the ARO area include prolapse of the coronary cusp and valve perforation. In patients with coronary cusp prolapse, the prolapsed portion simulates an ARO as seen on a cross-sectional image of the aortic valve. In such cases, the reconstruction plane parallel to the regurgitation orifice is used for planimetry of the ARO (19). In patients with infective endocarditis, aortic valve vegetations and perivalvular abscesses can be evaluated through the use of multiplanar reconstruction images. However, in cases with valve perforation, ARO evaluation may be difficult using CT, due to CT's limited contrast and spatial resolution.
Phase-contrast cine MR imaging enables direct quantification of the aortic regurgitation fraction. The use of a perpendicularly-oriented imaging plane just below the diseased valve is the most appropriate approach to quantifying valve regurgitation (28). Gelfand et al. (29) sought to define the MR imaging regurgitant fractions that best correlated with qualitative mild, moderate, and severe regurgitation by the use of color Doppler echocardiography, developing thresholds for an initial cohort of patients with 55 regurgitant valves. These thresholds were subsequently tested on a later cohort of patients with 52 regurgitant valves, including 24 aortic valves. The regurgitation fraction (RF) limits optimized the concordance of the MR imaging, and the echocardiography severity grades were similar for mitral and aortic regurgitations, as follows: mild < 15%, moderate 16-25%, moderate-severe 26-48%, and severe > 48%. Kutty et al. (30) compared echocardiography and MR imaging for AR grading in 43 patients. There was significant overlap of the objective regurgitation fraction between subjective grades, and echocardiography was less reliable in identifying more severe AR. Quantitative MR imaging was a potentially useful supplement to echocardiography for management decisions, and assessments of medical and surgical therapies in children and young adults with AR. Goffinet et al. (19) compared planimetered ARO by MDCT and MRI to ERO and regurgitant volume by PISA TTE and phase contrast MRI. In their study, MDCT-derived (r = 0.87, p < 0.001) and MRI-derived ARO (r = 0.81, p < 0.001) correlated well with TTE-derived ERO, but Bland-Altman plots demonstrated that ARO by MDCT (0.27 ± 0.15 cm2) significantly overestimated the ERO by PISA (0.22 ± 0.11 cm2, p < 0.001 by t test). In contrast, MRI-derived ARO (0.23 ± 0.13 cm2, p < 0.001) did not differ significantly from the ERO by PISA (p = 0.58).
In conclusion, planimetric measurements of the ARO area using MDCT are feasible for quantitatively evaluating AR severity. However, one should be careful in the evaluation of ARO using MDCT in cases with eccentric AR or prolapse of the aortic valve cusp. Based on our results, we propose the following CT grading scheme for AR severity based on ARO area: mild AR corresponds to an ARO area < 0.3 cm2, moderate AR corresponds to an ARO area from 0.3 cm2 to less than 0.5 cm2, and severe AR corresponds to an ARO area of 0.5 cm2 and greater.
Fig. 3.
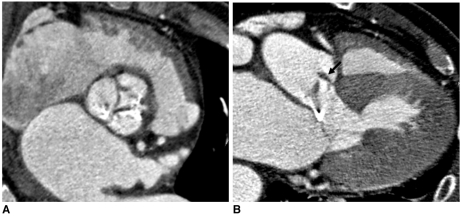
76-year-old male with infective endocarditis and moderate eccentric aortic regurgitation and stenosis shown by transthoracic echocardiography.
A. Reformatted image shows diastolic coaptation failure with valvular thickening and calcifications. Aortic regurgitant orifice at CT was 0.64 cm2.
B. Long-axial image of aortic valve demonstrates 0.5 cm-vegetation (arrow) attached to valve leaflet. Vena contracta was 0.43 cm, and pressure half-time measured 183 ms at echocardiography.
Fig. 4.
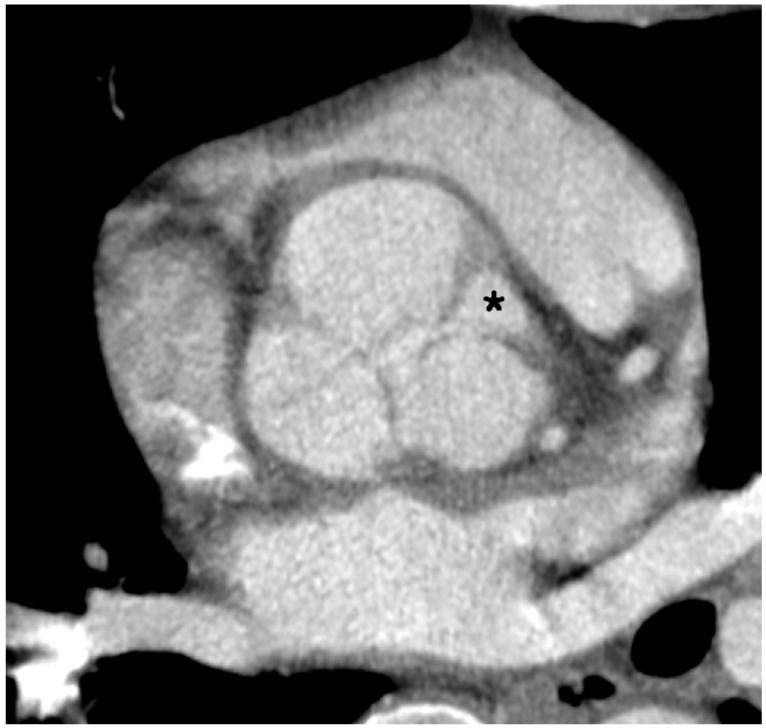
37-year-old male with severe aortic regurgitation shown by transthoracic echocardiography. Reformatted CT image shows large area (asterisk) of commissural incompetency between right and left coronary cusps. Aortic regurgitant orifice area via CT measured 1.49 cm2. Effective regurgitant orifice area was 0.82 cm2 and pressure half-time, 259 ms at echocardiography.
Abbreviations
- AR
aortic regurgitation
- ARO
aortic regurgitant orifice
- AROCT
aortic regurgitant orifice area via CT
- ERO
effective regurgitant orifice
- LV
left ventricular
- MDCT
multidetector-row CT
- PISA
proximal isovelocity surface area
- TTE
transthoracic echocardiography
- VC
vena contracta
References
- 1.Enriquez-Sarano M, Tajik AJ. Clinical practice. Aortic regurgitation. N Engl J Med. 2004;351:1539–1546. doi: 10.1056/NEJMcp030912. [DOI] [PubMed] [Google Scholar]
- 2.Bekeredjian R, Grayburn PA. Valvular heart disease: aortic regurgitation. Circulation. 2005;112:125–134. doi: 10.1161/CIRCULATIONAHA.104.488825. [DOI] [PubMed] [Google Scholar]
- 3.Zoghbi WA, Enriquez-Sarano M, Foster E, Grayburn PA, Kraft CD, Levine RA, et al. Recommendations for evaluation of the severity of native valvular regurgitation with two-dimensional and Doppler echocardiography. J Am Soc Echocardiogr. 2003;16:777–802. doi: 10.1016/S0894-7317(03)00335-3. [DOI] [PubMed] [Google Scholar]
- 4.Tribouilloy CM, Enriquez-Sarano M, Bailey KR, Seward JB, Tajik AJ. Assessment of severity of aortic regurgitation using the width of the vena contracta: a clinical color Doppler imaging study. Circulation. 2000;102:558–564. doi: 10.1161/01.cir.102.5.558. [DOI] [PubMed] [Google Scholar]
- 5.Eren M, Eksik A, Gorgulu S, Norgaz T, Dagdeviren B, Bolca O, et al. Determination of vena contracta and its value in evaluating severity of aortic regurgitation. J Heart Valve Dis. 2002;11:567–575. [PubMed] [Google Scholar]
- 6.Mascherbauer J, Rosenhek R, Bittner B, Binder J, Simon P, Maurer G, et al. Doppler echocardiographic assessment of valvular regurgitation severity by measurement of the vena contracta: an in vitro validation study. J Am Soc Echocardiogr. 2005;18:999–1006. doi: 10.1016/j.echo.2005.03.021. [DOI] [PubMed] [Google Scholar]
- 7.Fang L, Hsiung MC, Miller AP, Nanda NC, Yin WH, Young MS, et al. Assessment of aortic regurgitation by live three-dimensional transthoracic echocardiographic measurements of vena contracta area: usefulness and validation. Echocardiography. 2005;22:775–781. doi: 10.1111/j.1540-8175.2005.00171.x. [DOI] [PubMed] [Google Scholar]
- 8.Mizushige K, Nozaki S, Ohmori K, Matsuo H. Evaluation of effective aortic regurgitant orifice area and its effect on aortic regurgitant volume with Doppler echocardiography. Angiology. 2000;51:241–246. doi: 10.1177/000331970005100308. [DOI] [PubMed] [Google Scholar]
- 9.Alkadhi H, Wildermuth S, Bettex DA, Plass A, Baumert B, Leschka S, et al. Mitral regurgitation: quantification with 16-detector row CT-initial experience. Radiology. 2006;238:454–463. doi: 10.1148/radiol.2381042216. [DOI] [PubMed] [Google Scholar]
- 10.Gilkeson RC, Markowitz AH, Balgude A, Sachs PB. MDCT evaluation of aortic valvular disease. AJR Am J Roentgenol. 2006;186:350–360. doi: 10.2214/AJR.04.1463. [DOI] [PubMed] [Google Scholar]
- 11.Alkadhi H, Wildermuth S, Plass A, Bettex D, Baumert B, Leschka S, et al. Aortic stenosis: comparative evaluation of 16-detector row CT and echocardiography. Radiology. 2006;240:47–55. doi: 10.1148/radiol.2393050458. [DOI] [PubMed] [Google Scholar]
- 12.Habis M, Daoud B, Roger VL, Ghostine S, Caussin C, Ramadan R, et al. Comparison of 64-slice computed tomography planimetry and Doppler echocardiography in the assessment of aortic valve stenosis. J Heart Valve Dis. 2007;16:216–224. [PubMed] [Google Scholar]
- 13.Feuchtner GM, Müller S, Bonatti J, Schachner T, Velik-Salchner C, Pachinger O, et al. Sixty-four slice CT evaluation of aortic stenosis using planimetry of the aortic valve area. AJR Am J Roentgenol. 2007;189:197–203. doi: 10.2214/AJR.07.2069. [DOI] [PubMed] [Google Scholar]
- 14.Pouleur AC, le Polain de Waroux JB, Pasquet A, Vanoverschelde JL, Gerber BL. Aortic valve area assessment: multidetector CT compared with cine MR imaging and transthoracic and transesophageal echocardiography. Radiology. 2007;244:745–754. doi: 10.1148/radiol.2443061127. [DOI] [PubMed] [Google Scholar]
- 15.Vogel-Claussen J, Pannu H, Spevak PJ, Fishman EK, Bluemke DA. Cardiac valve assessment with MR imaging and 64-section multi-detector row CT. Radiographics. 2006;26:1769–1784. doi: 10.1148/rg.266065035. [DOI] [PubMed] [Google Scholar]
- 16.Ryan R, Abbara S, Colen RR, Arnous S, Quinn M, Cury RC, et al. Cardiac valve disease: spectrum of findings on cardiac 64-MDCT. AJR Am J Roentgenol. 2008;190:W294–W303. doi: 10.2214/AJR.07.2936. [DOI] [PubMed] [Google Scholar]
- 17.Alkadhi H, Desbiolles L, Husmann L, Plass A, Leschka S, Scheffel H, et al. Aortic regurgitation: assessment with 64-section CT. Radiology. 2007;245:111–121. doi: 10.1148/radiol.2451061523. [DOI] [PubMed] [Google Scholar]
- 18.Jassal DS, Shapiro MD, Neilan TG, Chaithiraphan V, Ferencik M, Teague SD, et al. 64-slice multidetector computed tomography (MDCT) for detection of aortic regurgitation and quantification of severity. Invest Radiol. 2007;42:507–512. doi: 10.1097/RLI.0b013e3180375556. [DOI] [PubMed] [Google Scholar]
- 19.Goffinet C, Kersten V, Pouleur AC, le Polain de Waroux JB, Vancraeynest D, Pasquet A, et al. Comprehensive assessment of the severity and mechanism of aortic regurgitation using multidetector CT and MR. Eur Radiol. 2010;20:326–336. doi: 10.1007/s00330-009-1544-x. [DOI] [PubMed] [Google Scholar]
- 20.Li X, Tang L, Zhou L, Duan Y, Yanhui S, Yang R, et al. Aortic valves stenosis and regurgitation: assessment with dual source computed tomography. Int J Cardiovasc Imaging. 2009;25:591–600. doi: 10.1007/s10554-009-9456-z. [DOI] [PubMed] [Google Scholar]
- 21.Feuchtner GM, Dichtl W, Müller S, Jodocy D, Schachner T, Klauser A, et al. 64-MDCT for diagnosis of aortic regurgitation in patients referred to CT coronary angiography. AJR Am J Roentgenol. 2008;191:W1–W7. doi: 10.2214/AJR.07.3432. [DOI] [PubMed] [Google Scholar]
- 22.Feuchtner GM, Dichtl W, Schachner T, Müller S, Mallouhi A, Friedrich GJ, et al. Diagnostic performance of MDCT for detecting aortic valve regurgitation. AJR Am J Roentgenol. 2006;186:1676–1681. doi: 10.2214/AJR.05.0967. [DOI] [PubMed] [Google Scholar]
- 23.Tribouilloy CM, Enriquez-Sarano M, Fett SL, Bailey KR, Seward JB, Tajik AJ. Application of the proximal flow convergence method to calculate the effective regurgitant orifice area in aortic regurgitation. J Am Coll Cardiol. 1998;32:1032–1039. doi: 10.1016/s0735-1097(98)00356-8. [DOI] [PubMed] [Google Scholar]
- 24.Zoghbi WA, Farmer KL, Soto JG, Nelson JG, Quinones MA. Accurate noninvasive quantification of stenotic aortic valve area by Doppler echocardiography. Circulation. 1986;73:452–459. doi: 10.1161/01.cir.73.3.452. [DOI] [PubMed] [Google Scholar]
- 25.Bartunek J, De Bacquer D, Rodrigues AC, De Bruyne B. Accuracy of aortic stenosis severity assessment by Doppler echocardiography: importance of image quality. Int J Card Imaging. 1995;11:97–104. doi: 10.1007/BF01844707. [DOI] [PubMed] [Google Scholar]
- 26.Danielsen R, Nordrehaug JE, Vik-Mo H. Factors affecting Doppler echocardiographic valve area assessment in aortic stenosis. Am J Cardiol. 1989;63:1107–1111. doi: 10.1016/0002-9149(89)90087-8. [DOI] [PubMed] [Google Scholar]
- 27.Ozkan M, Ozdemir N, Kaymaz C, Kirma C, Deligönül U. Measurement of aortic valve anatomic regurgitant area using transesophageal echocardiography: implications for the quantitation of aortic regurgitation. J Am Soc Echocardiogr. 2002;15:1170–1174. doi: 10.1067/mje.2002.122354. [DOI] [PubMed] [Google Scholar]
- 28.Masci PG, Dymarkowski S, Bogaert J. Valvular heart disease: what does cardiovascular MRI add? Eur Radiol. 2008;18:197–208. doi: 10.1007/s00330-007-0731-x. [DOI] [PMC free article] [PubMed] [Google Scholar]
- 29.Gelfand EV, Hughes S, Hauser TH, Yeon SB, Goepfert L, Kissinger KV, et al. Severity of mitral and aortic regurgitation as assessed by cardiovascular magnetic resonance: optimizing correlation with Doppler echocardiography. J Cardiovasc Magn Reson. 2006;8:503–507. doi: 10.1080/10976640600604856. [DOI] [PubMed] [Google Scholar]
- 30.Kutty S, Whitehead KK, Natarajan S, Harris MA, Wernovsky G, Fogel MA. Qualitative echocardiographic assessment of aortic valve regurgitation with quantitative cardiac magnetic resonance: a comparative study. Pediatr Cardiol. 2009;30:971–977. doi: 10.1007/s00246-009-9490-6. [DOI] [PubMed] [Google Scholar]


