Abstract
Protein quantification in a complex protein mixture presents a daunting task in biochemical analysis. Antibody-based immunoassays are traditional methods for protein quantification. However, there are issues associated with accuracy and specificity in these assays, especially when the changes are small (e.g., < 2-fold). With recent developments in mass spectrometry, monitoring a selected peptide, thus protein, in a complex biological sample has become possible. In this study, we demonstrate a simple mass spectrometry-based method for selective measurement of a moderately low abundant protein, superoxide dismutase 1 (SOD1), in cisplatin-sensitive and cisplatin-resistant human ovarian cancer cells. Selected-reaction-monitoring (SRM) technology was employed to specifically analyze the target peptides in a pair of human ovarian cancer cell lines: 2008/2008-C13*5.25 (cisplatin-sensitive/cisplatin-resistant, respectively). The observed 1.47 fold higher expression in the resistant cell line is consistent with findings by other approaches. This robust liquid chromatography/mass spectrometry (LC/MS) method provides a powerful tool for targeted proteomic verification and/or validation studies.
Keywords: Superoxide dismutase 1, Ovarian cancer, Cisplatin Drug resistance, Mass spectrometry, Selected-Reaction-Monitoring
1. Introduction
Ovarian cancer ranks first among gynecological cancers in number of deaths, but its cause remains unknown [1]. While surgery is currently the intervention of choice, chemotherapy has progressed considerably during the last decade [2], including a platinum-based drug treatment [3–5]. However, drug resistance has become one of the major obstacles to the successful chemotherapeutic treatment of human cancers [4]. A recent study [6] and other previously published reports [7, 8] have elucidated that superoxide dismutase 1 (SOD1, SwissProt number - P00441) plays a pivotal role in the defense of cells against the toxic effects of reactive oxygen species (ROS), such as superoxide radicals, which are generated during cancer drug treatment. It therefore has been suggested that SOD1 suppresses apoptosis in cultured human ovarian cell lines [9, 10]. It has been demonstrated that platinum-based drug treatment increases the level of ROS in cancer cells [11]. Thus SOD1, as an antioxidant, protects the cells from apoptosis by scavenging ROS in the cellular system. Therefore, quantitative measurement of SOD1 in cancer cells would help in understanding the potential mechanisms of drug resistance at the molecular level.
Traditionally, antibody-based methods such as western blotting are used for relative quantitative measurements [12]. However, these methods are often not capable of measuring small changes in protein expression (e.g., <2-fold). In addition, development of a specific antibody for a particular protein of interest could be tedious and labor intensive. Therefore, seeking an alternative method to quantitatively compare the protein expression levels under different biological conditions has become a critically important part of technological innovations in biomarker discovery and validation.
Tandem mass spectrometry (MS/MS) combined with liquid chromatography provides an excellent opportunity for quantitative analysis of proteins in complex biological systems, even though it is still considered one of the most challenging tasks in proteomics [13]. Due to limitations in technology, low abundant proteins or peptides are still often not detectable by mass spectrometry [13]. Recently, more sensitive and selective SRM technology has gradually increased in popularity as a way to specifically detect target peptides from a complex biological mixture based on mass-to-charge ratio of a precursor ion and its collision-induced MS/MS pattern [14, 15]. This approach allows for the analysis of a particular peptide in a complex peptide mixture. Its high sensitivity and selectivity give this method great potential for becoming a powerful tool for quantitative protein and peptide analysis, avoiding the tedious process of developing antibodies to novel targets [14, 15]. In the present work, we demonstrate an SRM-based assay for accurately measuring the relative quantities of SOD1 under different biological conditions.
2. Experimental
2.1 Chemicals and reagents
Urea (99.5%), Dithiothreitol (DTT), iodoacetamide, acetonitrile, and ammonium bicarbonate were all purchased from Sigma-Aldrich (St. Louis, MO). Modified trypsin was purchased from Promega (Madison, WI). Heat-inactivated Fetal Bovine Serum Premium was purchased from Atlanta Biologicals (Lawrenceville, GA).
2.2 Cell culture
A pair of human ovarian cancer lines, 2008 (cisplatin-sensitive) and 2008-C13*5.25 (cisplatin-resistant), were used in this study. They were obtained from Dr. Stephen B. Howell of University of California-San Diego, La Jolla, CA [16–19]. All cell lines were handled under identical conditions and maintained at 37°C in a humidified incubator containing 5% CO2 in RPMI-1640 media supplemented with 15% fetal bovine serum. Upon 80% confluence, cells (1×10⁷) were detached from the plates by trypsinization, washed three times with 5 mL of ice-cold PBS buffer and stored at −80°C for future use.
2.3 Sample Preparation
Frozen cells were thawed and homogenized using 100 μL of freshly made lysis buffer (8 M urea, 10 mM DTT). Protein concentrations were determined by the Bradford Protein Assay (Bio-Rad) [20]. The same lysis buffer was used for the background reference of the protein assay and for the buffer of the protein standards (bovine serum albumin). Resulting cell lysates (100 μg) supplemented with 0.5 μg of chicken lysozyme were reduced and alkylated by 10 mM DTT and 55 mM iodoacetamide, and then digested by trypsin (1:50 molar ratio). The resulting solutions were filtered through Durapore PVDF 0.45 μm centrifugal tubes (Millipore, Billerica, MA) before mass spectrometric measurements.
2.4 Mass Spectrometric Analysis
All mass spectrometric analyses were performed on a Thermo-Fisher Scientific LTQ linear ion-trap mass spectrometer (Thermo-Fisher Scientific, Waltham, MA) interfaced with an HPLC system containing a binary pump and thermostated autosampler. Liquid chromatography (LC) was performed on an X-Bridge™ C18 column (Waters, 2.1 × 50 mm). Peptides were eluted with a linear gradient from 5 to 25% acetonitrile developed over 50 min at a flow rate of 200 μL/min, and effluent was electro-sprayed into the LTQ mass spectrometer. The source lenses were set by maximizing the ion current for the M+2H+ charge state of angiotensin. Chromatographic data acquisition, peak integration and quantification were carried out using Xcalibur 2.0 package from Thermo-Fisher Scientific. Three SRM transitions for SOD1 were monitored: (SOD1_A) m/z 751.3 (M+2H+) → m/z 665.5, (SOD1_B) m/z 751.3 (M+2H+) → m/z 778.5, and (SOD1_C) m/z 751.3 (M+2H+) → m/z 948.5. We also monitored two transitions for a selected internal standard (40S ribosomal protein S12): m/z 524.24 (M+2H+) → m/z 878.44 and m/z 524.24 (M+2H+) → m/z 935.47. Additionally, we monitored three transitions for a spiked external standard (chicken lysozyme): m/z 877.5 (M+2H+) → m/z 730.4, m/z 877.5 (M+2H+) → m/z 900.5 and m/z 877.5 (M+2H+) → m/z 1063.5.
2.5 Post-column Infusion
Post-column infusion (PCI) experiments were performed by connecting a tee union after the column to allow a 5 μL/min syringe pump infusion of a 0.1 nM and 0.5 nM SOD1 standard peptide (GDGPVQGIINFEQK), respectively, into the mobile phase stream. Injections of cell extracts, mixture of cell extracts and SOD1 standard peptide, and SOD1 standard peptide alone were scheduled while monitoring SOD1 target peptide by MS/MS.
3. Results and Discussion
It is critically important to pay special attention to sample preparation in quantitative protein analysis since multiple biases could be introduced from both technical and biological sources [21, 22]. In this study, all samples were handled under identical procedures and under identical conditions. The protein concentrations were measured by Bradford assay (Bio-Rad), whereas peptide concentrations from each sample were determined by Bicinchoninic Acid (BCA) assay (Thermo-Fisher Scientific). Typically, the measured protein concentrations are in the range of 2–4 mg/mL under the experimental conditions used in this study. All samples were normalized to 1 mg/mL using the same lysis buffer (8 M urea, 10 mM DTT) before HPLC injection.
3.1 SRM Transition Development
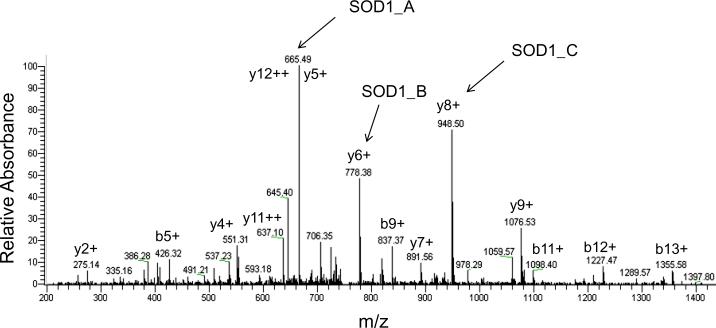
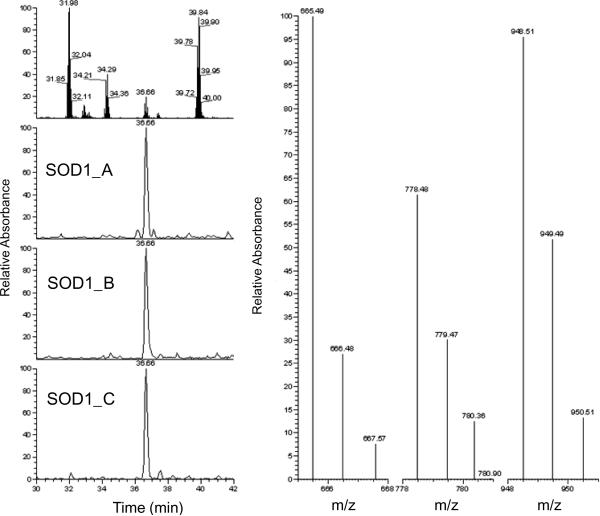
Because of the issues of peptide co-elution in liquid chromatography and the broad protein dynamic ranges in whole cell lysates, identification and quantification of low abundant proteins become experimentally prohibitive in global proteomic studies [23, 24]. A more sensitive and selective SRM-based targeted proteomic strategy provides an outstanding platform for characterization of target molecules [25]. For SRM transition development, three major parameters need to be taken into account: 1) matching to theoretical value; 2) optimal signal intensity; and 3) free of contamination from other interference transitions. Although in silico predictions of the SRM transitions can be accomplished, high quality SRM transitions observed from actual experiment are desired for quantitative measurements. A global proteomic study using the same cell lines has been previously performed [6], so we selected several potential SOD1-specific peptides that were experimentally observed in this global study. To confirm these peptides, we repeated a global proteomic analysis using a smaller sample size (n=2) per condition. A unique SOD1 peptide 11GDGPVQGIINFEQK24 was consistently observed in every previous [6] and current MS run. Fig. 1 shows the MS/MS spectra of this target peptide, confirming the correct peptide identification and rationale for SRM transition selection. A total ion chromatogram (TIC) for all chosen SRM transitions and an extracted ion chromatogram (XIC) for three individual transitions are shown in Fig. 2. In both TIC and XIC, we found no other interfering signals. Theoretically, three individual transitions would give a very similar result when comparing the same protein from two cell lines. As shown in Fig. 2, the same trend and quantity from each transition was observed.
Figure 1.
Tandem mass spectrum of the peptide 11GDGPVQGIINFEQK24 for SOD1. The y5, y6, and y8 product ions give the strongest signals among the product ions for this peptide. The best MRM transitions for this peptide were chosen: (SOD1_A) m/z 751.3 Th (precursor ion, M+2H+) → m/z 665.5 Th (product ion, M+H+), (SOD1_B) m/z 751.3 Th (precursor ion, M+2H+) → m/z 778.4 Th (product ion, M+H+), and (SOD1_C) m/z 751.3 Th (precursor ion, M+2H+) → m/z 948.5 Th (product ion, M+H+).
Figure 2.
Total ion chromatogram (TIC, top of left panel) and extracted ion chromatogram (XIC, bottom three of left panel) traces for three MRM transitions of SOD1 (11GDGPVQGIINFEQK24). Right panel shows product ions of the three SRM transitions.
During the SRM experiments, we used X-Bridge™ C18 column (Waters, 2.1 × 50 mm, 2.5 μm) to get better resolution instead of Zorbax 300SB-C18 (Agilent, 1.0 × 150 mm, 3.5 μm). We tried to use various flow rates and lower ionization voltage to reduce signal suppression effects; however, very little improvement was observed in this regard, and we therefore used 200 μL/min flow rate and 4 kV voltage in both global and SRM experiments.
3.2 Specificity of the SRM Transitions
Due to isotope peaks and possible mass shifts, a broad mass range was set for transition collection in order to reduce the possibility of mis-detection. We used an m/z range of 3.0 Th for each precursor and product ion, respectively. During the entire sample run, isotope peaks were observed in the selected m/z windows, which indicate the accuracy of the measurements. In this study, interfering background was not detected, implicating the purity of each SRM transition. A simple one-dimensional liquid chromatographic peptide separation approach was applied to quantitatively monitor SOD1 peptides from each ovarian cancer cell line. For more complex samples and transitions that may be interfered with by other transitions and/or contaminants (e.g., post-translationally modified species of other peptides with the same precursor ions and product ions), a multi-dimensional separation and/or affinity-based enrichment step may be required for selective monitoring of defined SRM transitions.
3.3 Quantitation of the Target Peptides
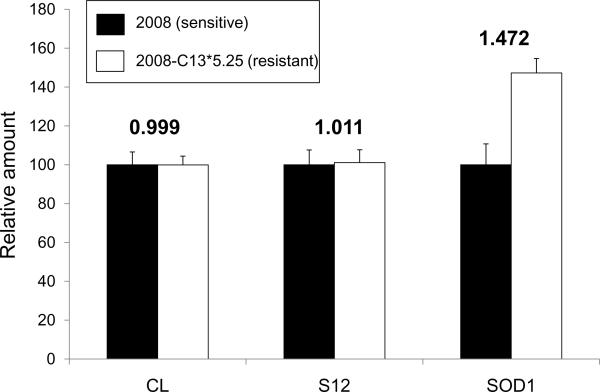
Peptide abundance was calculated from the measured ion current that is linear over a dynamic range of greater than five orders of magnitude on the LTQ. The relative quantification was obtained from chromatographic data since the integrated ion current is proportional to the peptide concentration under identical conditions. All chromatographic acquisition, smoothing, and peak integration were performed using the Xcalibur 2.0 software package. The observed shift of retention time in an entire sample group was less than 30 seconds. It was therefore not necessary for chromatographic alignment. Fig. 3 illustrates the relative fold-change in concentrations of the spiked external standard (chicken lysozyme), the internal standard (40S ribosomal protein S12), and SOD1. As expected, both standards maintain a constant ratio of 1 between sensitive and resistant sample groups, while SOD1 had 1.47-fold higher expression in the resistant cell line. These quality assurance (QA) and quality control (QC) procedures assure a high level of confidence in our quantification studies.
Figure 3.
Relative fold-changes for the external standard — chicken lysozyme (CL) (64NTDGSTDYGILQINSR79), internal standard — 40S ribosomal protein S12 (S12) (85LGEWVGLCK93), and SOD1 (11GDGPVQGIINFEQK24).
3.4 Internal and External Standards
In addition to an external standard (ES) of chicken lyzosome, an internal standard (IS) was intentionally employed to ensure that the difference in measured SOD1 levels was not due to artifacts (e.g., biased sample loading). A unique peptide (85LGEWVGLCK93) from 40S ribosomal protein S12 was quantitatively monitored simultaneously during the SRM measurement of SOD1. We calculated the relative amounts of IS peptide based on two individual transitions: m/z 524.24 Th (precursor ion, M+2H+) → m/z 878.44 Th (product ion, M+H+) and m/z 524.24 Th (precursor ion, M+2H+) → m/z 935.47 Th (product ion, M+H+), which should be constant in both cell lines as we observed in our previous global proteomic study [6]. In Fig. 3, an increasing amount of SOD1 is shown in the resistant cell line; while, both the IS (1.011) and the ES (0.999) remain constant, indicating that the significant change we observed in SOD1 concentration is not due to technical variations but to the acquired drug resistance.
3.5 Matrix Effects
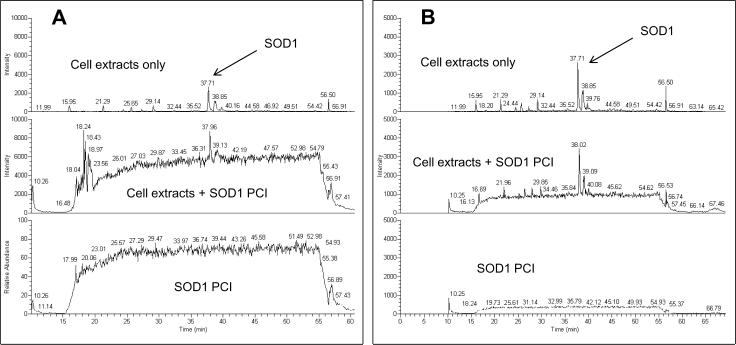
To assess the matrix effects and ion-suppression that could potentially affect the results of the study, post-column infusion (PCI) experiments were performed. SOD1 target peptide signal from PCI after injections of cell extracts showed no significant suppression or interference at the expected retention time of the SOD1 target peptide peak (Fig. 4).
Figure 4.
Post-column infusion (PCI) experiments for the assessment of the matrix effects. (A), 0.5 nM SOD1 target peptide (GDGPVQGIINFEQK); (B), 0.1 nM of the same peptide.
3.6 Limit of Detection (LOD)
To determine the LOD for each transition of SOD1 (SOD1_A, SOD1_B and SOD1_C), an SOD1 target peptide (GDGPVQGIINFEQK) was serially diluted from 125 pmol/μL until peptide signal faded away (which is at 1.25 pmol/μL). We then evaluated 10 injections of 1.25 pmol/μL mixture of SOD1 peptide (GDGPVQGIINFEQK) spiked in albumin-depleted human plasma and 10 injections of human plasma alone, respectively. The mean signal of these injections and their standard deviations (SD) were calculated for determination of the LOD, which was calculated as the concentration corresponding to response based on the following equation:
where z = 2 as in 2 SD
This value was considered the minimum response that could be distinguished from zero at 95% confidence. The LOD for each transition of SOD1 (SOD1_A, SOD1_B and SOD1_C) were 0.47, 0.30 and 1.70 pmol/μL, respectively,
3.7 Stability and Reproducibility of the Assay
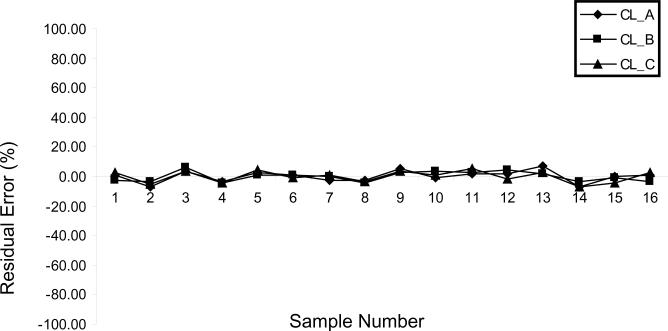
To determine the stability and reproducibility of SRM scanning of target peptides from a highly complex biological sample, spiked external standard peptide of chicken lysozyme (precursor ion m/z 877.5) was monitored. As shown in Fig. 5, residual errors of the three SRM transitions are less than 5%, indicating reliable sample handling and reproducible MS measurements. Furthermore, when the same strategy was used to analyze each transition of SOD1 (SOD1_A, SOD1_B, and SOD1_C), p<0.001 was observed (data not shown). This suggests that the observed fold-change in SOD1 expression between sensitive and resistant cell lines is statistically significant. When SRM transitions for the ES and IS were compared between the two cell lines, there were no significant differences.
Figure 5.
Stability and reproducibility assessment of SRM measurements. Residual errors for the quantitation of three transitions of the spiked external standard, chicken lysozyme. Individual error of less than 5% was observed in each sample, indicating reliable sample handling and reproducible SRM measurements.
4. Conclusion
We present here a mass spectrometry-based method for determination of a targeted protein expression in a complex biological sample under different physiologic conditions. This strategy has gradually become platform-of-choice in quantitation of a selected protein of interest. The same strategy could also be applied to the validation of clinically useful biomarkers. The advantage of this method relies on its specificity, throughput, and assay development time (normally 3–6 months). The innovative approach of ruling-in and ruling-out candidate biomarkers using this method is more efficient than reagent-based methods. Utilization of this method can also be expanded to monitor a panel of biomarkers in a multiplexed fashion.
Acknowledgments
This work is supported in part by National Cancer Institute (CPTAC program).
Footnotes
Publisher's Disclaimer: This is a PDF file of an unedited manuscript that has been accepted for publication. As a service to our customers we are providing this early version of the manuscript. The manuscript will undergo copyediting, typesetting, and review of the resulting proof before it is published in its final citable form. Please note that during the production process errors may be discovered which could affect the content, and all legal disclaimers that apply to the journal pertain.
References
- 1.Landis SH, Murray T, Bolden S, Wingo PA. CA. Cancer J. Clin. 1999;49:8. doi: 10.3322/canjclin.49.1.8. [DOI] [PubMed] [Google Scholar]
- 2.Markman M. Ther. Clin. Risk Manag. 2009;5:161. doi: 10.2147/tcrm.s4186. [DOI] [PMC free article] [PubMed] [Google Scholar]
- 3.Auersperg N, Edelson MI, Mok SC, Johnson SW, Hamilton TC. Semin. Oncol. 1998;25:281. [PubMed] [Google Scholar]
- 4.Johnson SW, Laub PB, Beesley JS, Ozols RF, Hamilton TC. Cancer Res. 1997;57:850. [PubMed] [Google Scholar]
- 5.Zamble DB, Lippard SJ. Trends Biochem. Sci. 1995;20:435. doi: 10.1016/s0968-0004(00)89095-7. [DOI] [PubMed] [Google Scholar]
- 6.Fitzpatrick DPG, You J, Bemis KG, Wery J-P, Ludwig JR, Wang M. Proteomics - Clin Appli. 2007;1:246. doi: 10.1002/prca.200600768. [DOI] [PubMed] [Google Scholar]
- 7.Noor R, Mittal S, Iqbal J. Med. Sci. Monit. 2002;8:RA210. [PubMed] [Google Scholar]
- 8.Rao AK, Ziegler YS, McLeod IX, Yates JR, Nardulli AM. Mol. Endocrinol. 2008;22:1113. doi: 10.1210/me.2007-0381. [DOI] [PMC free article] [PubMed] [Google Scholar]
- 9.Kanekura K, Hashimoto Y, Kita Y, Sasabe J, Aiso S, Nishimoto I, Matsuoka M. J. Biol. Chem. 2005;280:4532. doi: 10.1074/jbc.M410508200. [DOI] [PubMed] [Google Scholar]
- 10.Tanaka M, Mokhtari GK, Terry RD, Balsam LB, Lee KH, Kofidis T, Tsao PS, Robbins RC. Circulation. 2004;110:11200. doi: 10.1161/01.CIR.0000138390.81640.54. [DOI] [PubMed] [Google Scholar]
- 11.Plasencia C, Martinez-Balibrea E, Martinez-Cardus A, Quinn DI, Abad A, Neamati N. Int. J. Oncol. 2006;29:225. doi: 10.3892/ijo.29.1.225. [DOI] [PubMed] [Google Scholar]
- 12.N. Burnette W. Methods Mol. Biol. 2009;536:5. doi: 10.1007/978-1-59745-542-8_2. [DOI] [PubMed] [Google Scholar]
- 13.Yates JR, Ruse CI, Nakorchevsky A. Annu. Rev. Biomed. Eng. 2009;11:49. doi: 10.1146/annurev-bioeng-061008-124934. [DOI] [PubMed] [Google Scholar]
- 14.Onorato JM, Henion JD, Lefebvre PM, Kiplinger JP. Anal. Chem. 2001;73:119. doi: 10.1021/ac000845t. [DOI] [PubMed] [Google Scholar]
- 15.Schiess R, Wollscheid B, Aebersold R. Mol. Oncol. 2009;3:33. doi: 10.1016/j.molonc.2008.12.001. [DOI] [PMC free article] [PubMed] [Google Scholar]
- 16.Katano K, Kondo A, Safaei R, Holzer A, Samimi G, Mishima M, Kuo YM, Rochdi M, Howell SB. Cancer Res. 2002;62:6559. [PubMed] [Google Scholar]
- 17.Samimi G, Katano K, Holzer AK, Safaei R, Howell SB. Mol. Pharmacol. 2004;66:25. doi: 10.1124/mol.66.1.25. [DOI] [PubMed] [Google Scholar]
- 18.Holzer AK, Samimi G, Katano K, Naerdemann W, Lin X, Safaei R, Howell SB. Mol. Pharmacol. 2004;66:817. doi: 10.1124/mol.104.001198. [DOI] [PubMed] [Google Scholar]
- 19.Holzer AK, Katano K, Klomp LW, Howell SB. Clin. Cancer Res. 2004;10:6744. doi: 10.1158/1078-0432.CCR-04-0748. [DOI] [PubMed] [Google Scholar]
- 20.Bradford MM. Anal. Biochem. 1976;72:248. doi: 10.1006/abio.1976.9999. [DOI] [PubMed] [Google Scholar]
- 21.Sherman J, McKay MJ, Ashman K, Molloy MP. Proteomics. 2009;9:1120. doi: 10.1002/pmic.200800577. [DOI] [PubMed] [Google Scholar]
- 22.Duncan MW, Yergey AL, Patterson SD. Proteomics. 2009;9:1124. doi: 10.1002/pmic.200800739. [DOI] [PMC free article] [PubMed] [Google Scholar]
- 23.Panchaud A, Scherl A, Shaffer SA, von Haller PD, Kulasekara HD, Miller SI, Goodlett DR. Anal. Chem. 2009 Jul 2; doi: 10.1021/ac900888s. [Epub ahead of print] [DOI] [PMC free article] [PubMed] [Google Scholar]
- 24.Ahmed FE. J. Sep. Sci. 2009;32:771. doi: 10.1002/jssc.200800622. [DOI] [PubMed] [Google Scholar]
- 25.Schiess R, Wollscheid B, Aebersold R. Mol. Oncol. 2009;3:33. doi: 10.1016/j.molonc.2008.12.001. [DOI] [PMC free article] [PubMed] [Google Scholar]


