

Abstract
Principal neurons of the medial superior olive (MSO) compute azimuthal sound location by integrating phase-locked inputs from each ear. While previous experimental and modeling studies have proposed that voltage-gated sodium channels (VGSCs) play an important role in synaptic integration in the MSO, these studies appear at odds with the unusually weak active backpropagation of action potentials into the soma and dendrites. To understand the spatial localization and biophysical properties of VGSCs, we isolated sodium currents in MSO principal neurons in gerbil brainstem slices. Nucleated and cell-attached patches revealed that VGSC density at the soma is comparable to that of many other neuron types, but channel expression is largely absent from the dendrites. Further, while somatic VGSCs activated with conventional voltage dependence (V1/2 = −30 mV), they exhibited an unusually negative range of steady-state inactivation (V1/2 = −77 mV), leaving ∼92% of VGSCs inactivated at the resting potential (approximately −58 mV). In current-clamp experiments, non-inactivated VGSCs were sufficient to amplify subthreshold EPSPs near action potential threshold, counterbalancing the suppression of EPSP peaks by low voltage-activated potassium channels. EPSP amplification was restricted to the perisomatic region of the neuron, and relatively insensitive to preceding inhibition. Finally, computational modeling showed that the exclusion of VGSCs from the dendrites equalizes somatic EPSP amplification across synaptic locations and lowered the threshold for bilateral versus unilateral excitatory synaptic inputs. Together, these findings suggest that the pattern of sodium channel expression in MSO neurons contributes to these neurons' selectivity for coincident binaural inputs.
Introduction
The medial superior olive (MSO) is a brainstem nucleus that processes binaural cues used for sound localization. Principal neurons of the MSO compute differences in the time required for sounds to propagate to each ear. To extract these submillisecond interaural time delays (ITDs), principal neurons of the MSO detect convergence in the timing of binaural excitatory inputs segregated onto each limb of the neurons' bipolar dendritic trees (Stotler, 1953; Lindsey, 1975). The integration of these excitatory inputs, which are phase locked to frequencies up to 2 kHz, is further influenced by phase-locked inhibition restricted to the soma (Brand et al., 2002; Kapfer et al., 2002). MSO neurons integrate these inputs, modulating their firing rate in response to changes in ITD (Goldberg and Brown, 1969; Yin and Chan, 1990; Spitzer Semple, 1995; Brand et al., 2002).
Voltage-gated sodium channels (VGSCs) expressed in the soma and dendrites of neurons propagate action potentials, mediate local electrogenic events and shape synaptic integration. These voltage-gated channels, comprised of an α subunit with four homologous domains, typically associate with one or more auxiliary β subunits (for review, see Catterall, 2000). Several α subunits, Nav1.1, Nav1.2 and Nav1.6, are broadly expressed in mammalian central neurons, while others, Nav1.3 and Nav1.7, are expressed less commonly. Somatic VGSCs typically propagate axonally generated action potentials into the soma yielding action potentials that overshoot 0 mV. In the dendrites there is considerable heterogeneity in the density of VGSCs and the efficacy of action potential backpropagation across neurons (Stuart et al., 1997). VGSCs in the dendrites of some neurons are even able to mediate local, fast sodium spikes, facilitating the contribution of distal excitatory inputs to somatic depolarization (for review, see Häusser et al., 2000; Larkum and Nevian, 2008). In addition, these channels are able to shape synaptic integration by enhancing subthreshold EPSPs in either the soma or dendrites, particularly when evoked at depolarized potentials (Stuart and Sakmann, 1995; Urban et al., 1998; Andreasen and Lambert, 1999; González-Burgos and Barrionuevo, 2001).
In MSO neurons, axonally initiated action potentials appear unusually small at the soma and undergo strong attenuation as they backpropagate into the dendrites (Scott et al., 2005, 2007). In addition MSO dendrites do not exhibit the strong electrogenesis found in many cell types (Scott et al., 2005). While low voltage-activated potassium channels contribute to the small size of action potentials measured at the soma, somatic action potentials do not overshoot 0 mV even after potassium channels are blocked. These findings suggest MSO neurons express a low density of VGSCs in their somas and dendrites.
In the present study, we used voltage- and current-clamp experiments to explore sodium channel function in MSO principal neurons. Our results reveal that VGSCs are restricted to the soma and proximal dendrites, and exhibit an unusually hyperpolarized steady-state inactivation range. While VGSC inactivation results in small action potential amplitudes at the soma, the density of channels is nevertheless sufficient to amplify subthreshold synaptic potentials, providing compensation for the sublinear summation of EPSPs mediated by low voltage-activated potassium channels.
Materials and Methods
Slice preparation.
Mongolian gerbils (Meriones unguiculatus) were obtained from Charles River Laboratories or bred at the University of Texas at Austin Animal Resource Center. Procedures were approved by the University of Texas at Austin Institutional Animal Care and Use Committee. Current-clamp recordings were made in brain slices from gerbils between postnatal day (P) 16 and 19, within the first week after hearing onset (∼P12). Voltage-clamp recordings were made in brain slices from animals between P15 and 18.
Gerbils were anesthetized via the inhalation of halothane. Animals were decapitated and the brain was removed while submerged in artificial CSF (ACSF, in mm: 125 NaCl, 2.5 KCl, 2 CaCl2, 1 MgSO4, 25 NaHCO3, 1.25 NaH2PO4, 25 glucose; pH 7.45 with NaOH) saturated with 95% O2/5% CO2. Horizontal sections (200 μm) were cut at 32°C using an oscillating tissue slicer (Leica VT-1000S) and then transferred to an incubating chamber containing oxygenated ACSF at 35°C. After 30 min, slices were held at room temperature until recording. Individual slices were transferred to a recording stage and bathed with oxygenated ACSF. MSO neurons were visualized using infrared differential interference contrast microscopy (Zeiss Axioskop 2FS Plus) in combination with a Newvicon tube camera (Dage-MTI).
Whole-cell current-clamp recordings.
Whole-cell patch recordings were made using heat-polished borosilicate patch pipettes (1.65 mm OD, World Precision Instruments) with open tip resistances of 2–4 MΩ (somatic electrodes) and 6–10 MΩ (dendritic electrodes). The internal solution in whole-cell patch pipettes contained the following (in mm): 115 potassium gluconate, 20 KCl, 10 sodium phosphocreatine, 0.5 EGTA, 4 MgATP, 0.3 NaGTP, 10 HEPES, pH 7.3 with KOH. Biocytin (0.1%) was also included in the internal solution for subsequent morphological analyses of the recorded cells. During recordings the bath solution was maintained at 35°C. Tetrodotoxin (TTX; 1 μm) was bath applied to block VGSCs. Somatic and dendritic recordings were made with Dagan BVC-700A amplifiers in current-clamp mode using bridge balance and capacitance compensation. In a few experiments, inhibitory synaptic conductances (IPSGs) were implemented in dynamic clamp using commercial software (SM-2; Cambridge Conductance) controlling a DSP board at 50 kHz (Toro-8; Innovative Integration). The identification of recorded cells was made on the basis of their location in the slice, cell body shape, and responses to depolarizing current steps. Additionally, most cells were successfully labeled with biocytin and their morphology was examined after recordings (see below). Individual experiments were included if the series resistance was <15 MΩ at the soma and <40 MΩ for dendritic recordings. Data were low-pass filtered at 5 kHz (soma) and acquired at 50–100 kHz using custom macros in IgorPro (WaveMetrics). Simulated EPSCs and IPSCs (sEPSCs and sIPSCs, respectively) consisted of a dual exponential waveform (sEPSCs: 0.2 ms rise and 0.2 ms decay; sIPSCs: 0.45 ms rise and 2 ms decay). Synaptically evoked EPSPs were elicited with a 100 μs constant current pulse delivered through a glass pipette with a tip diameter of ∼10 μm.
Nucleated patch recordings.
Nucleated patches were pulled from the soma of morphologically identified MSO neurons using protocols described previously (Sather et al., 1992). Briefly, the cell was first patched in a whole-cell configuration. Then, light suction (0.3–0.5 psi) was applied to the recording pipette (3–4 MΩ tip resistance) and a slow, vertical movement was used to draw the nucleus up with the pipette. Upon resealing of the membrane behind the nucleus, a patch was deemed stable if the input resistance exceeded 1 GΩ (measured using a 3 mV step from a holding potential of −60 mV). The diameter of the patch was between 7 and 9 μm, corresponding to a surface membrane area of ∼154–254 μm2. The internal solution used for nucleated patches contained the following (in mm): 135 CsCl, 5 EGTA, 10 sodium phosphocreatine, 4 MgATP, 0.3 NaGTP, 10 HEPES, pH 7.3 with CsOH. To isolate Na+ currents, normal ACSF additionally included ZD7288 (50 μm), TEA (10 mm), CoCl2 (200 μm) and NiCl (50 μm), blockers of hyperpolarization-activated channels, potassium channels, and voltage-gated calcium channels, respectively. CNQX (10 μm) and d-AP5 (50 μm) were added to the bath to block AMPA and NMDA receptors. Recordings were made using an Axopatch 200B voltage-clamp amplifier (Molecular Devices) at room temperature (25°C). Pipettes were wrapped with Parafilm to reduce stray capacitance. Remaining pipette capacitance, whole-cell capacitance and series resistance (≥80%) was compensated online. Data was low pass filtered at 10 kHz and acquired at 100 kHz using custom macros programmed in IgorPro.
Cell-attached recordings.
Somatic and dendritic cell-attached patch recordings were made using normal ACSF. The pipette solution contained the following (in mm): 150 NaCl, 3 KCl, 10 HEPES, 2 CaCl2 and 1 MgCl. In addition, 10 mm TEA and 100 μm 4-AP were included in the pipette to reduce voltage-dependent potassium conductances. In a few recordings a small hyperpolarization-activated cation current (Ih) was observed, but these currents were too slow to affect peak Na+ currents. Ih channel blockers were not used because they significantly changed the resting membrane potential in a time-dependent manner. Recordings were made at room temperature (25°C). To record the relative density of VGSCs along the soma and dendrites, recording pipettes were restricted to those with open-tip resistances of 6–7 MΩ to limit patch-to-patch variation in membrane area. Pipette capacitance neutralization and data acquisition were performed in the same manner as in nucleated-patch recordings.
Analysis.
All electrophysiological analyses were completed in IgorPro. Somatic action potential amplitude was measured from the inflection point, defined as the local minimum of the second derivative of voltage within the rising phase of the action potential. EPSP amplitudes were measured relative to rest. The amount of subthreshold EPSP amplification was measured as the difference between EPSP amplitudes in control and TTX conditions at a voltage just below action potential threshold. Means are presented ±SEM and compared using two-tailed paired Student's t test.
Anatomy.
Slices with biocytin-labeled cells were fixed in 4% paraformaldehyde and subsequently processed using an ABC kit (nickel-enhanced DAB reaction; Vector Laboratories). MSO principal neurons were verified by their location in the slice, and by cell morphology. Cells were traced at 40× using an Axioskop FS2 with a camera lucida.
Computational modeling.
A three-dimensional reconstruction of a biocytin-filled MSO neuron was made using Neurolucida (MBF Bioscience) in semiautomated mode. Simulations using this morphological reconstruction were performed in the NEURON simulation environment (version 6.0; Hines and Carnevale, 1997). The time step used was 5 μs. Passive parameters were uniform in all compartments and were: Ra = 150 Ωcm, and Cm = 1 μF/cm2. The resting membrane properties of the model were tuned by adjusting two active conductances; a low voltage-activated potassium conductance and a hyperpolarization-activated cation conductance (gK-LVA and gH) and a leak conductance (gLEAK). The respective densities of gK-LVA and gH were balanced to maintain a resting potential near −60 mV, a membrane time constant within the range found experimentally in P16–P19 gerbils (300–1000 μs; Scott et al., 2005), and the voltage-dependent EPSP sharpening found in MSO neurons. In the model, gK-LVA was expressed at greatest density in the soma (0.06 S/cm2), and at a lower, linearly declining density from proximal to distal dendrites (0.003–0.00015 S/cm2), approximating the experimentally determined gradient of gK-LVA found in MSO neurons (Mathews et al., 2008). In addition, gLEAK was added to the dendrites at a uniform density (0.00005 S/cm2, reversal potential at −60). Because the dendritic density of gH is not known, a uniform density of gH was added to the soma and dendrites (0.001 S/cm2), but extra gLEAK (0.0004 S/cm2, reversal potential at −60) was required at the soma to achieve the characteristic sharpening of EPSPs as a function of voltage. The initial segment was defined as the first 25 μm of the axon, based on Scott et al. (2007), and included gK-LVA, gH, and gLEAK at densities of 0.025, 0.0005 and 0.00005 S/cm2, respectively. Only gK-LVA and gH were included in the main axon (0.001 and 0.0005 S/cm2, respectively).
The gating of gH was modeled based on direct fits to voltage-clamp data, and exhibited both fast and slow activation components (Khurana and Golding, unpublished results). The time constants for these components were based on fits to activating currents between −110 and −50 mV. The model descriptions of gNa and gK-LVA were based on the present dataset and data from Mathews et al. (2008). For each conductance, current families from 4 to 6 experiments were simultaneously fit for both the amplitude and kinetics of recorded currents using Neurofit software (Willms, 2002). The individual fits were then averaged to obtain the parameters for the simulated conductances. The mean time constants for gK-LVA and gNa gating were obtained from fits of currents between −70 and 40 mV and −60 and 20 mV, respectively, with equations that matched the data in that range. During simulations, membrane voltages stayed between −70 and −10 mV, within the voltage range well described by the electrophysiological data for these two conductances. The full set of equations governing channel gating and kinetics are provided in the Appendix and are shown in supplemental Figure 2 (available at www.jneurosci.org as supplemental material). To match experimental data, all simulations were performed at 35°C, and when necessary channel kinetics were adjusted using a temperature coefficient (Q10) of 3. Further analysis and display of simulation results were done in IgorPro (WaveMetrics). The waveform of the synaptic conductance introduced at the soma or dendrites was described by an α function (g = gmax * (t/τsyn) * exp(1 − t/τsyn)), with τsyn = 0.2 ms and Vrev = 0 mV. All simulations included a one second settling period before the onset of the synaptic conductance(s).
Results
To determine the expression level and properties of VGSCs in MSO neurons, pharmacologically isolated sodium currents were recorded in nucleated patches pulled from the soma (Fig. 1A). Surprisingly, MSO neurons exhibited substantial TTX-sensitive sodium current in nucleated patches (average density: 22 ± 4.2 pS/μm2), only 26% less than estimates of sodium current density made in hippocampal neurons using similar techniques (30 pS/μm2 average density in nucleated patches; Martina and Jonas, 1997). Channel activation was measured by stepping to voltages between −70 and +20 mV from a −120 mV prepulse (Fig. 1B). Sodium currents activated rapidly (τact < 100 μs) and inactivated rapidly as well (τinact < 2 ms). These currents were maximal at –10 mV, and both the voltage of half-activation and slope of Boltzmann fits were comparable to those found in other neurons (−30.9 ± 1.3 mV and 7.5 ± 0.3, respectively; Fig. 1C,D). The reversal potential measured by linear extrapolation was +62.1 ± 2.0 mV, close to the theoretical equilibrium potential for Na+ ions of +69 mV predicted under these recording conditions (see Materials and Methods; data not shown). These results are consistent with the movement of ions through a VGSC channel.
Figure 1.

Kinetic properties of VGSCs in nucleated patches from MSO neurons. A, A nucleated patch pulled from the soma of a MSO principal neuron, viewed with DIC microscopy and 160× magnification. B, Nucleated patch recordings of somatic Na+ currents in response to voltage steps between −70 and +40 mV from a −120 mV prepulse. Na+ currents isolated pharmacologically (see Materials and Methods). Bottom, Na+ currents were blocked by 1 μm TTX. C, Current versus voltage plots of Na+ currents produced in control and 1 μm TTX (Control n = 12, 1 μm TTX n = 3). D, Normalized mean conductance versus voltage plot of VGSC activation. Line represents average Boltzmann fit to data: V1/2 = −30.9 ± 1.3 mV and k = 7.5 ± 0.3.
The substantial amplitude of somatic sodium currents was unexpected considering the small amplitude of somatic action potentials in MSO neurons observed in previous studies (Scott et al., 2005, 2007). To assess how steady-state inactivation impacts somatic VGSC availability during action potential propagation, we stepped nucleated patches to −10 mV from holding voltages between −120 and −20 mV. The voltage of half steady-state inactivation (V1/2), −77.4 ± 1.4 mV, is more hyperpolarized than that for typical neuronal VGSCs (Martina and Jonas, 1997; Ming and Wang, 2003; Hu et al., 2009; Kuba and Ohmori, 2009) (Fig. 2A,B). A similar voltage dependence was measured in cell-attached patch recordings, indicating the relatively negative voltage range of steady-state inactivation was not a dialysis-related phenomenon. This left-shifted curve indicates that ∼90% of VGSCs are inactivated at the resting potential for MSO neurons, approximately −60 mV (92% and 89% inactivation in nucleated and cell-attached patches, respectively). To further characterize inactivation properties, sodium channel recovery from inactivation was measured in nucleated patches by varying the time interval between two depolarizing step pulses (steps to −10 mV, 10 and 30 ms duration; Fig. 2C). Sodium channels recovered rapidly from inactivation when held at negative voltages between pulses (Fig. 2D). With a holding voltage of −120 mV, 50% of the current was recovered in ∼0.7 ms. Recovery from inactivation was considerably slower at a holding voltage of −70 mV, as currents reached 50% peak amplitude in ∼4.5 ms.
Figure 2.

VGSC steady-state inactivation and recovery from inactivation. A, Currents recorded using the nucleated patch (left) or cell attached (right) configuration. Currents were elicited by voltage steps between −70 and +40 mV from a −120 mV (75 ms) prepulse. (Currents isolated as detailed in Materials and Methods.) B, There was no significant difference in steady-state inactivation between nucleated patch (V1/2 = −77.4 ± 1.4 mV, k = −7.4 ± 0.5, n = 6) and cell-attached (V1/2 = −76.9 ± 1.3, k = −6.9 ± 0.5, n = 8) configurations (p = 2.4). The cell attached curve was shifted by the average difference between estimated membrane potential and that of the measured membrane potentials (2.8 mV). Activation curve recorded from nucleated patches (light gray) illustrates an unusually small window current. C, Example traces showing the recovery time course of sodium currents recorded in nucleated patches using a –120 mV holding voltage and –10 mV inactivating and recovery pulses (10 and 30 ms, respectively). D, Plots of current recovery as a function of interstimulus interval (Δt) for holding voltages of –120 and –70 mV, fit with dual exponentials. Sodium currents recovered more quickly at –120 mV (τfast = 0.59 ms, τslow = 4.7 ms, n = 5) than –70 mV (τfast = 3.0 ms, τslow = 9.7 ms, n = 6). Inset shows time course over the first 5 ms.
Our previous finding that action potentials propagate poorly into MSO dendrites raises the question as to the density of sodium currents in this compartment. To determine current density along the soma and dendrites, pharmacologically isolated voltage-gated sodium currents were recorded in cell-attached patches at room temperature with a step pulse from −120 to −10 mV (Fig. 3). The resting membrane potential was measured after each recording to ensure the potential was close to that of the estimated value (−50 mV with ion channel blockers in the bath). Recording pipette size was kept as uniform as possible to minimize membrane area differences between patches. Somatic patches averaged 6.42 ± 1.82 pA of sodium current, whereas current density decreased rapidly in the dendrites as a function of distance from the soma.
Figure 3.

Density of Na+ currents decreases along the dendrites of MSO neurons. A, Na+ currents recorded in cell-attached patches from the soma and dendrites of MSO principal neurons using a step pulse to −100 mV from a presumed −120 mV prepulse. After each recording the membrane was ruptured and the resting potential immediately measured (−52.8 ± 0.27 mV). B, Scatter plot of somatic (n = 18) and dendritic (n = 30) cell-attached recordings illustrating the overall decrease in current density as a function of distance from the center of the soma. Filled square indicates somatic average (−6.42 ± 1.82 pA).
In addition to generating action potentials, VGSCs also amplify EPSPs in the subthreshold range in many neuron types. To test whether VGSCs influence subthreshold excitation in the MSO, dual somatic and dendritic current-clamp recordings of MSO principal neurons were made in response to a series of simulated EPSC waveforms (sEPSCs) injected at either recording site. The amount of VGSC-dependent amplification was assessed by comparing the just-subthreshold EPSP amplitude during control conditions and bath application of 1 μm TTX. In these experiments 20.9 ± 3.3% VGSC-dependent amplification of the subthreshold EPSP was observed at the soma, whereas in the dendrites amplification was nearly absent (3.4 ± 2.0%; n = 5; Fig. 4A–C). EPSP amplification at the soma did not require the presence of an intact axon. Even when an action potential could not be evoked with a large depolarization and recovered morphology indicated the axon was severed near the soma during slicing, EPSP amplification still occurred at the soma but not in the dendrites (n = 3; data not shown). Interestingly, the EPSC-EPSP relationship was sublinear during TTX application, indicating sodium channels contribute to the construction of a linear input-output function in the subthreshold voltage range. While the contribution of VGSCs to near-threshold EPSP amplitude was not large (2.36 ± 0.44 mV), blocking VGSCs imposed a requirement for substantially more current to reach threshold (716 ± 258 pA; Fig. 4B,C). To determine whether such a linear input-output relationship occurs under more physiological conditions, synaptic stimulation was used to evoke responses from independent populations of synapses (Fig. 4D). Input independence was ascertained using a 5-pulse synaptic depression paradigm to show that prior depression of one synaptic input population (4 pulses at 500 Hz) did not significantly affect the EPSP evoked from the second synaptic input population (data not shown). The summation of independent synaptic responses was near the arithmetic sum, showing that a linear input-output relationship is maintained with physiological stimuli.
Figure 4.
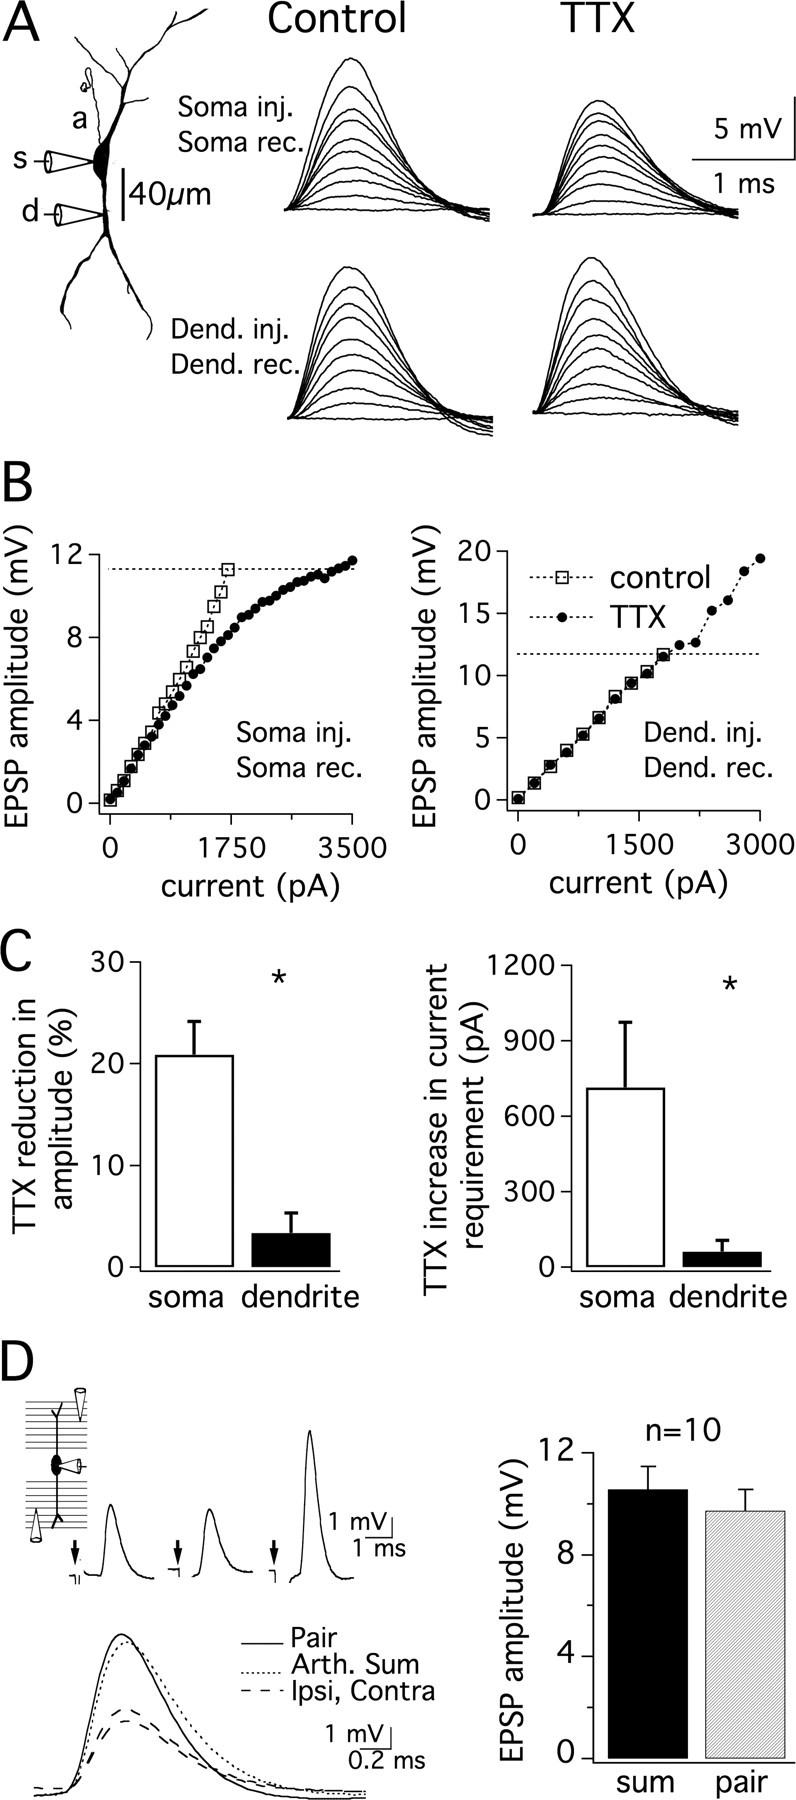
VGSC-dependent amplification of subthreshold EPSPs occurs at the soma but not in the dendrites. A, Dual somatic and dendritic (40 μm, lateral) recordings from a single neuron (P17; Vrest = −60 mV). Responses to a series of EPSCs injected and recorded at the soma (upper traces, 0–1700 pA, 200 pA steps) or injected and recorded at the dendritic site (lower traces, 0–1800 pA, 200 pA steps). Bath application of 1 μm TTX revealed VGSC amplification of somatic but not dendritic EPSPs. B, Plot of EPSP amplitude measured from rest with respect to EPSC amplitude. Open and closed symbols indicate responses before and after the application of 1 μm TTX, respectively. AP thresholds (dotted lines) were set at control values for both control and TTX conditions. The percentage reduction of control EPSP amplitude by 1 μm TTX was determined at the current producing a just-subthreshold response. C, Mean values for the percentage reduction in EPSP amplitude at somatic (open bars) and dendritic (30–55 μm; closed bars) recording sites by the application of TTX reveal much less influence of TTX in the dendrite than in the soma (left; n = 5; p < 0.005). TTX application substantially increased the current required to reach the amplitude of a just-subthreshold EPSP at the soma but not in the dendrite (right; n = 5; p < 0.05). *Statistically significant difference (paired t test), with a criterion level of 0.05. D, Ipsilateral and contralateral stimulating electrodes evoked independent synaptic responses. Stimuli were delivered at the arrows (upper left diagram). The response to paired ipsilateral and contralateral stimulation was similar to the arithmetic sum of the responses to each stimulus delivered individually (lower left panel, right panel). Histograms show means + SEM.
As shown above, VGSCs in the perisomatic regions of MSO neurons are mostly inactivated at rest but show rapid recovery from inactivation at negative potentials. These findings raise the possibility that inhibitory synaptic activity could increase VGSC availability through recovery from inactivation, potentially enhancing amplification of subthreshold excitation. To test this hypothesis, IPSC- and EPSC-like waveforms were injected at the soma of MSO neurons during current-clamp recordings. A family of EPSCs was delivered 2.5 ms after the start of an IPSC, just after maximum hyperpolarization. The IPSC amplitude was set to evoke 7–10 mV IPSPs. EPSP amplitudes measured in control and TTX conditions revealed a similar magnitude of just-subthreshold EPSP amplification with and without leading inhibition (Fig. 5A–C). However, the voltage threshold for action potential initiation decreased ∼1.4 mV with leading inhibition (p < 0.002; n = 7). As such, VGSC recovery during the IPSP maintained a constant magnitude of near-threshold EPSP amplification despite also reducing the action potential voltage threshold and hence the voltage at which subthreshold amplification must have taken place. Independent of VGSCs, leading IPSPs increased the current required to reach threshold by ∼340 pA (p < 0.05, n = 7; Fig. 5D), thus decreasing subthreshold membrane sensitivity, or gain. To determine whether shunting provided by inhibitory conductances (IPSGs) altered somatic EPSP amplification more than IPSC-evoked IPSPs, three experiments were performed by injecting both IPSCs as well as IPSGs implemented in dynamic clamp at 50 kHz (see Materials and Methods). The percentage amplification of somatic EPSPs with preceding inhibition differed by 1% or less between IPSP conditions. Also, the voltage threshold for action potential initiation differed by <0.5 mV between conditions. As expected, leading 7–10 mV IPSG-evoked IPSPs raised the current threshold for action potential initiation 200–400 pA more than the same sized IPSC-evoked IPSPs. Together these findings show that when brief inhibition precedes excitation, linearity in the subthreshold input-output range is preserved (Fig. 5B).
Figure 5.
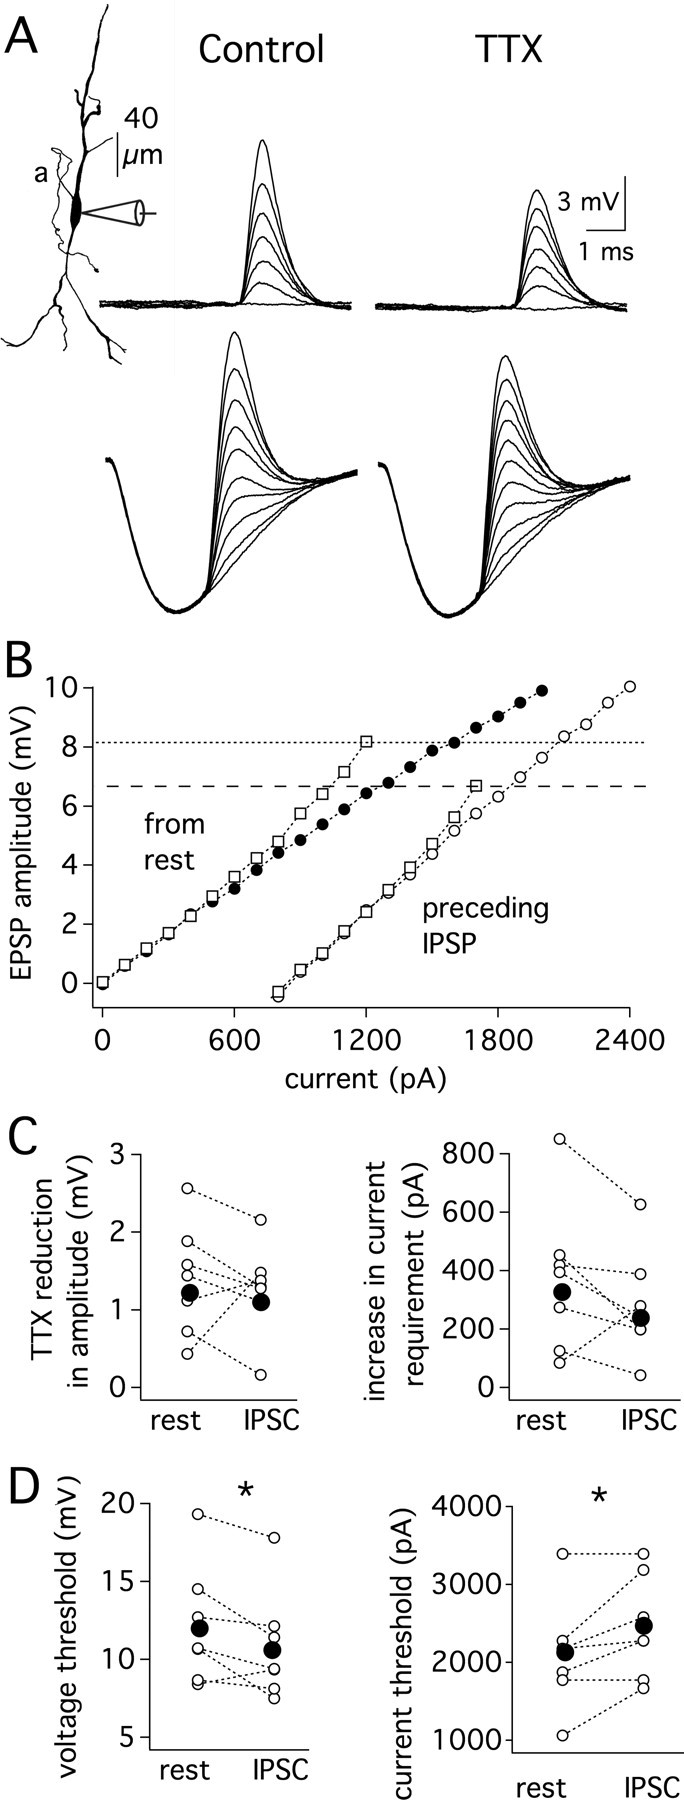
Leading inhibition alters subthreshold gain and lowers the threshold for action potential initiation, but the magnitude of just-subthreshold EPSP amplification by VGSCs remains relatively constant. A, Somatic recordings from a single neuron (P16; Vrest = −65 mV). Responses to a series of EPSCs delivered at rest (upper traces, 0–2.4 nA, 0.4 nA steps) or delivered 2.5 ms after the start of an IPSP (lower traces, 0–1.7 nA, 0.2 nA steps, 8.7 mV IPSP). With preceding IPSPs, peak amplitude measurements were limited to EPSPs large enough to have clear peaks. Bath application of 1 μm TTX reveals a similar magnitude of EPSP amplification in each condition. AP thresholds were set at control values for both control and TTX conditions. B, Plot of EPSP amplitude measured from rest versus EPSC amplitude. Squares and circles indicate responses before and after the application of 1 μm TTX, respectively (closed symbols, from rest; open symbols, from IPSP). Dotted lines indicate threshold for each condition. C, The reduction of EPSP amplitude by TTX determined at the current producing a just-subthreshold response in control conditions (left; p > 0.1). The TTX-induced increase in current required to reach the amplitude of a just-subthreshold EPSP (right; p < 0.1). D, The IPSP-induced decrease in action potential voltage threshold was significantly different with respect to control conditions (left; p < 0.002). The IPSP-induced increase in the current threshold for action potential generation was significantly greater after a preceding IPSP (right; p < 0.05). Mean, closed symbols; individual responses, open symbols (n = 7).
Since we observed that relatively little recovery from inactivation occurred during a single IPSP, we hypothesized that longer membrane hyperpolarizations, as might occur during trains of IPSPs, would increase subthreshold EPSP amplification. To test this hypothesis, EPSPs were delivered either alone or in the presence of a long, 7–10 mV hyperpolarization (80 ms step; Fig. 6A, insets). Prolonged membrane hyperpolarization lowered the voltage threshold for action potential initiation by ∼2.5 mV (n = 9, p < 5 × 10⁻⁵) but nevertheless increased the current required to reach threshold by ∼580 pA (Fig. 6A–D; n = 9, p < 0.05). Despite the long hyperpolarization, VGSCs provided the same magnitude of just-subthreshold EPSP amplification as in resting conditions (n = 9; p > 0.1). Thus, as for the single IPSC, when a long hyperpolarization precedes excitation near spike threshold, enhanced VGSC amplification is precluded by a concomitant reduction in voltage threshold for spike initiation. Under the conditions of these experiments, the primary influence of preceding inhibition is to increase the excitability of the axon and action potential initiation. At the same time, the linearity of subthreshold gain is preserved over a reduced subthreshold voltage range.
Figure 6.

Prolonged membrane hyperpolarization lowers the voltage threshold for action potential initiation and shifts resting conductances, but VGSCs provide the same magnitude of just-subthreshold EPSP amplification as in resting conditions. A, Somatic recordings from a single neuron (P16; Vrest = −62 mV). Responses to a series of EPSCs delivered at rest (upper traces, 0–2.8 nA, 0.4 nA steps) or delivered 80 ms into a 100 ms hyperpolarizing step pulse (lower traces, 0–3.6 nA, 0.4 nA steps). Bath application of 1 μm TTX revealed similar amplitudes of just-subthreshold EPSP amplification in each condition. B, Plot of EPSP amplitude measured from rest versus EPSC amplitude. Square and circle symbols indicate responses before and after the application of 1 μm TTX, respectively. Closed symbols, from rest. Open symbols, from hyperpolarization. Dotted lines indicate AP threshold in the control condition (normal ACSF). C, The reduction of EPSP amplitude by TTX determined at the current producing a just-subthreshold response is similar from rest and from a hyperpolarizing pulse (left; n = 9; p > 0.1). The TTX-induced increase in current required to reach the amplitude of a just-subthreshold EPSP is similar in each condition (right; n = 9; p > 0.1). D, Hyperpolarization decreased action potential voltage threshold (left; n = 9, p < 5 × 10⁻⁵). Hyperpolarization increased the current threshold for action potential generation (right; n = 9, p < 0.05). Mean, closed symbols, and individual responses, open symbols. *Statistically significant difference (paired t test), with a criterion level of 0.05.
The finding that EPSP amplification still occurred at the soma when the axon is severed proximally suggests VGSCs at the soma may be specifically required for this amplification. To test this idea further, sodium currents were added into different compartments of a computational model. A Neurolucida reconstruction of an MSO neuron was used to generate a model in NEURON. The gK-LVA and gH properties were fit to currents isolated from MSO neurons (P. Mathews and S. Khurana, unpublished observations) and adjusted to match the input resistance, time constant, and dendrosomatic EPSP propagation characteristics recorded in MSO neurons (Fig. 7A). Subthreshold responses were evoked by an EPSG-like waveform inserted at the soma. Like MSO neurons in the presence of TTX, with no gNa added to the model there was a sublinear relationship in the input-output function (black trace; Fig. 7B, left). Incremental addition of gNa at the soma led to larger somatic EPSP amplitudes without distorting the shape of the EPSP. This amplification was even more prominent when the recording site was shifted to the axon initial segment (Fig. 7B, right). As there were no axonal VGSCs in this condition, the increased amplification was likely the result of the far lower capacitive load in the initial segment. When VGSCs were restricted to the initial segment, EPSPs were strongly amplified locally (Fig. 7C, right), but had little effect on the soma other than a slight broadening of EPSPs (Fig. 7C, left). The findings shown in Figure 7 were not altered by the use of EPSCs instead of EPSGs (data not shown). Moreover, axonal sodium channels did not amplify somatic EPSPs even when the density of gK-LVA and gH in the axon initial segment or in both the initial segment and soma was reduced by an order of magnitude (supplemental Fig. 1, available at www.jneurosci.org as supplemental material). Thus, our computational model predicts that somatic, and not axonal sodium currents are essential for the amplification of EPSPs at the soma and contribute to the linearity of the subthreshold gain.
Figure 7.
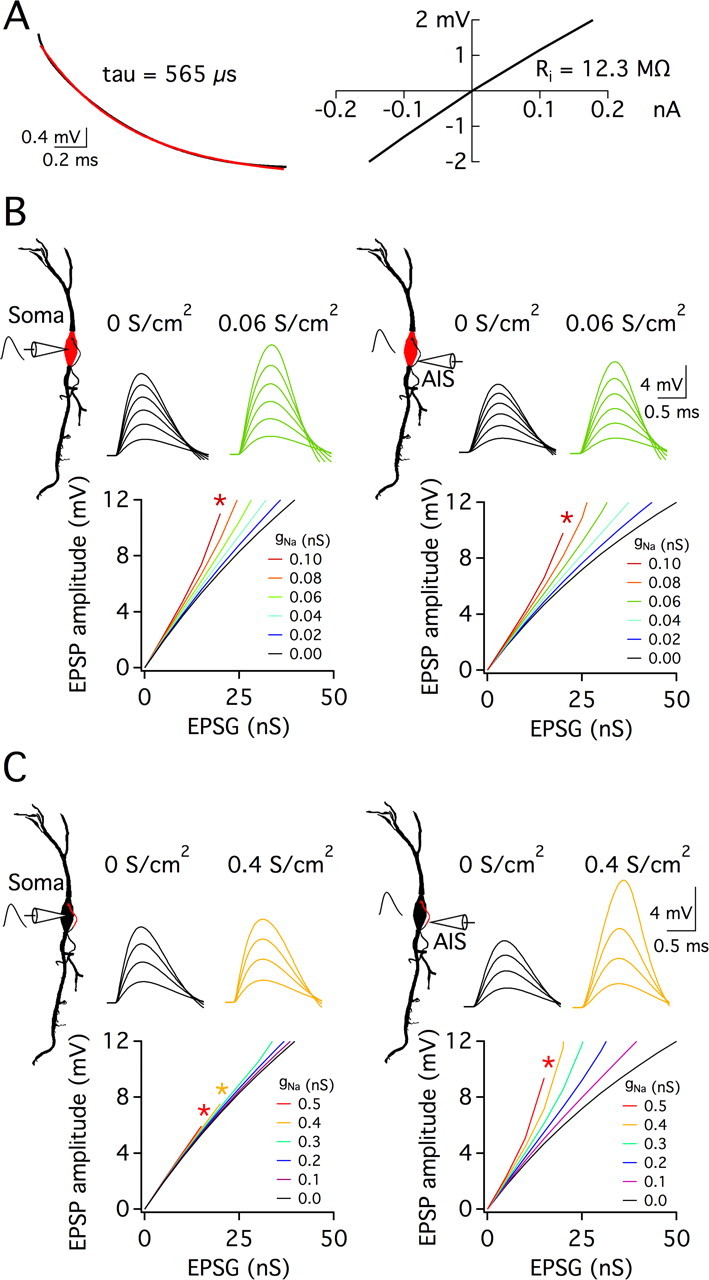
Subthreshold amplification of EPSPs by somatic VGSCs in a computational model of an MSO neuron. A, Membrane properties of a model neuron with gK-LVA, gleak, and gH, but no gNa. Step pulses (5 ms, −0.2 to 0.2 nA in 0.05 nA steps) were injected at the soma (Vrest = −61 mV). Left: A somatic response to a −200 pA step has a time constant of 565 μs. Right: The slope of a plot of maximal voltage responses versus current amplitudes indicates a somatic input resistance of 12.3 MΩ. B, C, For the same model cell as in A, four simulation configurations are indicated using a 2-dimensional morphological representation of the cell. In all cases, an EPSG-like waveform at the soma evoked responses. The electrode indicates the location, soma or the distal end of the axon initial segment) at which responses were recorded. Red indicates gNa insertion at either the soma (B) or axon initial segment (C). Sample EPSP traces show responses to EPSGs in 5 nS steps to threshold; a plot of EPSP amplitude versus EPSG amplitude (0–50 nS, 5 nS steps) is shown below. The amount of gNa is indicated by line or trace color (S/cm2). Threshold was set at a somatic potential of 12 mV to match the average somatic EPSP amplitude required for action potential generation. Spikes occurring at voltages <12 mV are indicated by asterisks. With all gNa absent (black traces), there is a sublinear relationship between peak EPSP amplitude and the underlying conductance both at the soma (left panels) and the axon initial segment (right panels). Somatic but not axonal gNa amplifies somatic EPSPs (compare B and C left panels). Both somatic and axonal gNa amplify depolarizations in the initial segment (right panels). *Statistically significant difference (paired t test), with a criterion level of 0.05.
In some neurons, subthreshold amplification of EPSPs relies upon persistent sodium current. The perisomatic sodium currents in MSO neurons have a small persistent component (<2%). To explore whether this persistent component is necessary for somatic EPSP amplification, we eliminated this component of the VGSC in our computational model. Sodium conductance with and without a persistent component was added incrementally to the soma, and EPSGs were injected at the soma. For VGSCs with and without a persistent component the threshold synaptic conductance and percentage amplification of just subthreshold somatic EPSPs both differed by <1.5% at all levels of total sodium conductance. As this implies, somatically located gNa with and without a small persistent component amplifies somatic EPSPs to the same extent.
The low density of sodium current and lack of EPSP amplification in the dendrites raises the question as to whether restricting amplification of EPSPs to the soma has a computational advantage in MSO neurons. To explore this question, dendritic synapses were attached to a model cell with either somatically restricted gNa or gNa distributed throughout the soma and dendrites (gNa reported as total conductance added to the model cell). Synapses were placed unilaterally or bilaterally on the dendrites either 50 or 100 μm from the soma (Fig. 8, A–C, shows findings for unilateral synapses at 50 μm). For select simulations EPSCs were substituted for synaptic EPSGs to ensure the following results were replicated in current-clamp. The action potential voltage threshold was set at a 12 mV above rest in the soma, the average threshold for action potential generation in MSO neurons. As expected, EPSPs at the site of the synapses were highly sensitive to the presence of local VGSCs and were amplified much less when VGSCs were restricted to the soma (Fig. 8B). Consistent with electrophysiological recordings of MSO neurons, when sodium channels were restricted to the soma large dendritic depolarizations did not elicit dendritic electrogenesis (data not shown). For unilateral synapses placed 50 μm from the soma, the amplification of somatic EPSPs appeared to be insensitive to the distribution of VGSCs (Fig. 8C). However, the inclusion of all synaptic conditions (unilateral and bilateral synapses placed at 50 or 100 μm from the soma) revealed a different conclusion. The percentage somatic EPSP amplification varied little when sodium channels were restricted to the soma but varied more widely when sodium channels were distributed throughout the soma and dendrites. Similar to what was seen in electrophysiological recordings of MSO neurons, somatic EPSPs were amplified by 19.9–20.8% when 45 S total gNa was confined to the soma (Fig. 8D). When 45 S of gNa was instead distributed throughout the soma and dendrites, somatic EPSP amplification became far more sensitive to the spatial arrangement of synaptic inputs, varying between 16.5 and 31.9% across the tested configurations (Fig. 8D). These findings indicate that restricting VGSCs to the soma improves the uniformity of EPSP amplitude and gain in the face of variable spatial patterns of synaptic excitation.
Figure 8.
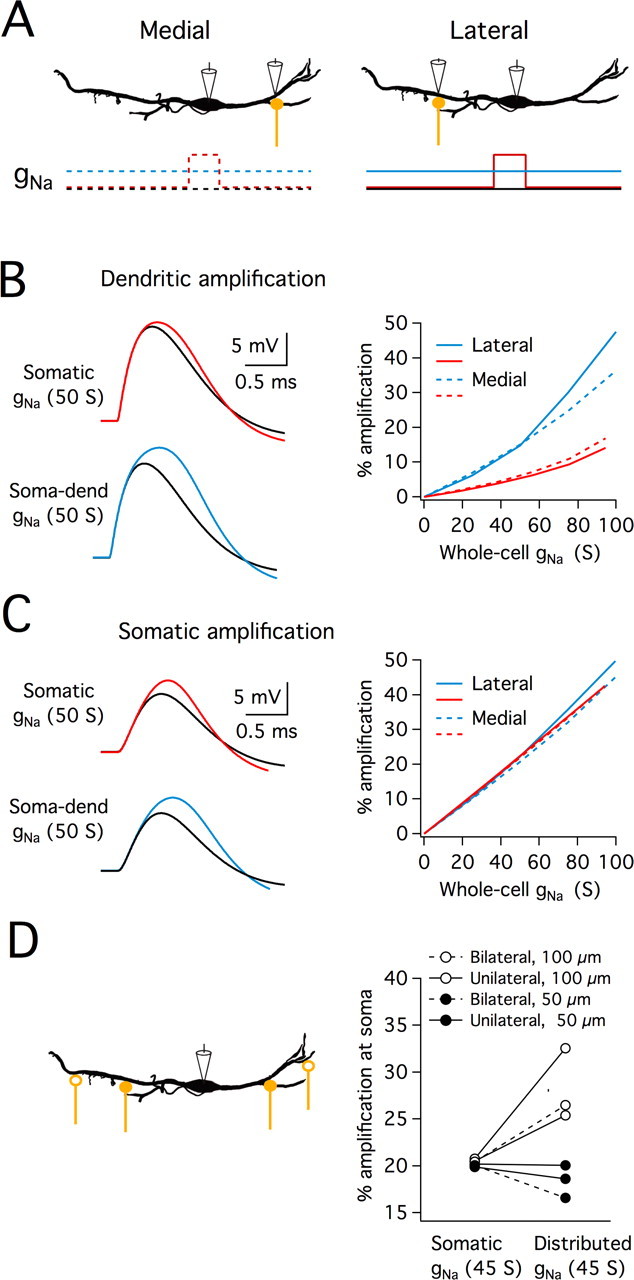
Restriction of VGSCs to the perisomatic region reduces variability of EPSP amplitude with changes in synapse location. A, Stimulus configuration and VGSC distribution of the computational model used in B and C. EPSG-like waveforms were injected 50 μm from the soma, either into the lateral or the medial dendrite, and the resulting EPSP was recorded at both the dendrite and soma. VGSCs were added incrementally, and distributed either in a restricted manner at the soma (red) or throughout the somatodendritic compartment (blue). The amount of gNa is reported as the total gNa added throughout the cell. Threshold was set at a somatic potential of 12 mV above rest to match the average somatic EPSP amplitude required for threshold action potential generation in MSO neurons. B, Upper left panel: traces of near-threshold EPSPs recorded in the lateral dendrite in a model with 50 S of gNa restricted to the soma (red traces) or throughout the soma and dendrites (blue traces). These EPSPs are contrasted with those evoked by the same synaptic conductance but in the absence of VGSCs (black traces). Right panel: the percentage amplification of just subthreshold EPSPs recorded at the synapse is plotted as a function of whole-cell gNa for medial and lateral synapses. Dendritic VGSCs lead to substantially more EPSP amplification at the synapse than somatic VGSCs. C, Left panel: traces of the same near-threshold EPSPs as in B, but recorded at the soma. Right panel: the percentage amplification of just subthreshold EPSPs at the soma is plotted as a function of whole-cell gNa for medial and lateral synapses. Both somatically located and somatodendritically located VGSCs amplified EPSPs at the soma. ∼45 S of somatic gNa provides a similar amount of somatic EPSP amplification as that found in MSO neurons. D, Top: schematic showing synapse location. All other aspects of the model were the same as in A-C. For the bilateral conditions, synapses at 50 or 100 μm from the soma were stimulated on opposite dendrites, whereas for the unilateral conditions, the 2 synapses on one dendrite were stimulated. Bottom: a scatter plot shows the percentage amplification of just subthreshold EPSPs recorded at the soma for each synaptic condition when 45 S of gNa was added either to the soma or throughout the soma and dendrites. When gNa was restricted to the soma, somatic EPSPs were amplified ∼20%, regardless of synapse location. Somatic EPSP amplification was not consistent when gNa was distributed throughout the somatodendritic compartment.
MSO neurons display far more sensitivity to binaural versus monaural inputs in vivo. Previous computational modeling by Agmon-Snir et al. (1998) has shown that the separation of excitatory inputs from each ear across different dendrites reduces sublinear summation of unilateral inputs within each dendrite. To explore how the distribution of VGSCs influences this sensitivity of MSO neurons to bilateral versus unilateral synapses, threshold conductances measured in the simulations outlined above were compared across VGSC distribution and synaptic input conditions. Consistent with Agmon-Snir et al. (1998), simulations run with gNa at the soma showed a lower threshold conductance for two bilateral synapses than for each synapse individually. With 45 S of gNa, bilateral thresholds were 5–11% lower at synapses 50 μm from the soma and 21–24% lower for synapses 100 μm from the soma. In contrast, thresholds for bilateral synapses were only 2–7% or 10–11% lower than thresholds for individual synapses when VGSCs were distributed over the soma and dendrites. To ascertain whether sodium channel distribution influenced this bilateral threshold advantage when the unilateral and bilateral conditions had the same number of synapses, simulations were run either with two unilateral or with two bilateral synapses placed at 50 and 100 μm from the soma (Fig. 9A). When 45 S of sodium conductance was inserted at the soma the threshold conductance was 5–11% (1–2.4 nS) less in the bilateral than the unilateral conditions (Fig. 9B). In contrast, when gNa was distributed throughout the soma and dendrites, the thresholds for the unilateral and bilateral conditions overlapped (Fig. 9B). Thus, restricting VGSCs to the soma enhances MSO neurons' selectivity for bilateral over unilateral coincident inputs.
Figure 9.
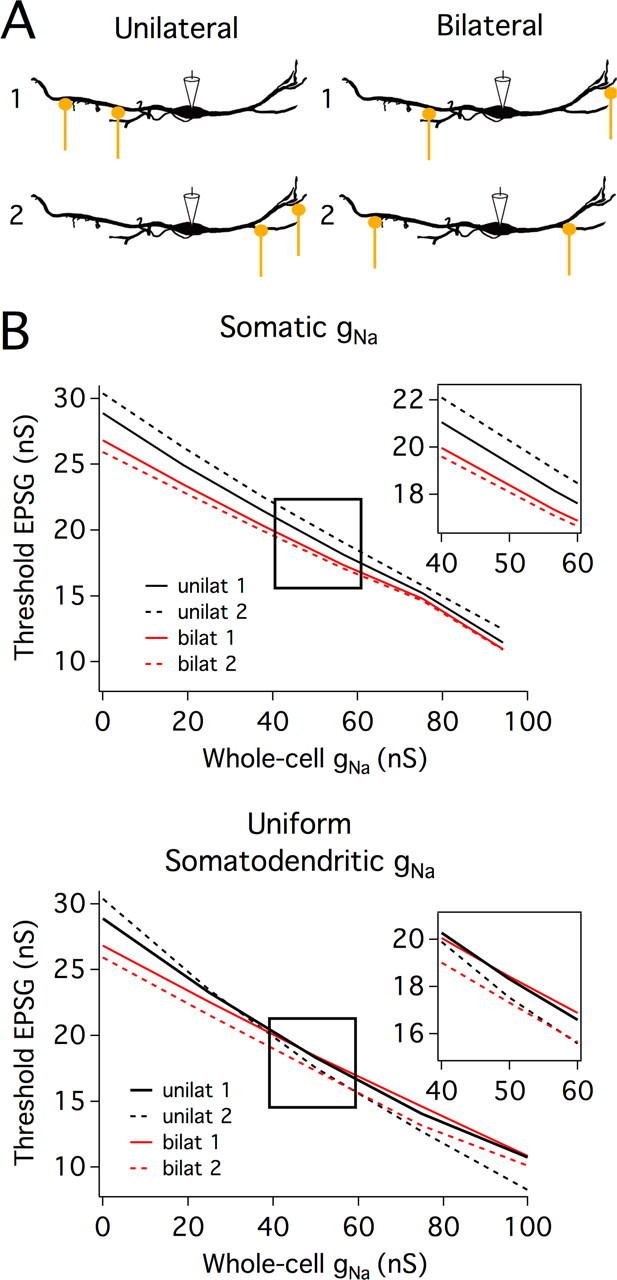
Restricting VGSCs to the soma enhances MSO neurons' sensitivity to bilateral versus unilateral coincident inputs. A, Stimulus configurations used in the computational model. Unilateral simulations (left schematics) were run with two synapses on either the lateral or medial dendrite (configurations 1 and 2 respectively), at positions 50 and 100 μm from the soma. Bilateral simulations (right schematics) were also run with two synapses at 50 and 100 μm, but these synapses were located on opposite dendrites (configurations 1 and 2 have proximal and distal positions reversed). B, The minimum synaptic conductance required for reaching action potential threshold, for bilateral (red) and unilateral (black) synapses plotted as a function of whole-cell gNa. Simulated EPSGs were injected at each synapse simultaneously, and the summed EPSPs were recorded at the soma. EPSG amplitude was increased until somatic EPSP amplitude reached action potential threshold, defined as 12 mV above rest at the soma (the average voltage threshold for action potential generation in MSO neurons). This procedure was repeated with different whole-cell levels of VGSCs, with channels either restricted to the soma (top graph) or distributed uniformly throughout the soma and dendrites (bottom graph). Insets show expanded views of thresholds for whole-cell gNa between 40 and 60 S, the range of gNa that closely reproduced EPSP amplification observed in experiments (Fig. 4). When gNa was restricted to the soma, threshold synaptic conductances were lower for bilateral than unilateral synapses at all levels of gNa. In contrast, when gNa was distributed throughout the soma and dendrites, the thresholds for the unilateral and bilateral conditions overlapped.
Discussion
The present findings indicate that in principal neurons of the MSO, voltage-gated sodium channels are restricted mainly to the perisomatic and axonal compartments. Somatic VGSCs in MSO neurons activate and inactivate quickly, allowing brief, sharply timed amplification of depolarizing synaptic inputs. The sharp decline in sodium current density along the dendrites limits the amplification of local dendritic EPSPs and accounts for our previous findings that action potential backpropagation and electrogenesis are severely limited in the dendrites of MSO neurons (Scott et al., 2005). The significant magnitude of somatic sodium current demonstrated in this report is paradoxical with our previous finding that action potentials are small at the soma. However, this discrepancy is explained by an unusually hyperpolarized voltage dependence for steady-state inactivation that limits somatic sodium current during action potential backpropagation. Instead, a major contribution of VGSCs in the somatic compartment is to amplify integrated synaptic inputs, compensating for the attenuating influence of voltage-gated potassium channels. In this way, somatic VGSCs are able to regulate the gain of integrated synaptic inputs in principal MSO neurons.
Steady-state inactivation
In cerebellar Purkinje neurons and both hippocampal pyramidal and fast-spiking neurons, where somatic sodium channel steady-state inactivation is more depolarized (V1/2 = −55 to −65 mV) and a substantial portion of VGSCs are available at rest, somatic VGSCs backpropagate large somatic action potentials that overshoot 0 mV (Martina and Jonas, 1997; Raman and Bean, 1997; Fricker et al., 1999). Though unusual for excitable mammalian cells, the left-shifted steady-state inactivation curve for somatic VGSCs in MSO neurons is not without precedent. Similar to MSO neurons, some neurons in the inferior colliculus (IC) have VGSCs with half steady-state inactivation at −75 mV (Liu and Li, 2004). Interestingly, IC neuron action potentials do not always overshoot. More extreme relationships between VGSC steady-state inactivation and resting potential also exist. In vestibular and immature auditory hair cells as well as in small dorsal root ganglion neurons, the voltage of half steady-state inactivation for transient VGSCs approaches −90 mV, substantially lower than the cells' resting potentials of −70 mV. Vestibular and immature auditory hair cells rarely elicit spikes with depolarizations from rest (Oliver et al., 1997; Chabbert et al., 2003; Marcotti et al., 2003; Wooltorton et al., 2007).
While unusual, the MSO VGSCs are unlikely to comprise novel VGSC subunits. The rapid gating kinetics and recovery from inactivation reported here are similar to those of Nav1.6-containing VGSCs expressed presynaptically and postsynaptically in the MNTB (Leão et al., 2005). In expression systems Nav1.6 channels exhibit a more negative steady-state inactivation range than Nav1.1 and 1.2 channels (Nav1.6: V1/2 approximately −53 mV (Isom et al., 1992; Smith and Goldin, 1998; Burbidge et al., 2002)), although not nearly as negative as that exhibited by MSO VGSCs. However, the small fraction of persistent current exhibited by MSO VGSCs (<2%) is more similar to homomeric Nav1.2 than Nav1.6 channels (Isom et al., 1992; Smith and Goldin, 1998; Burbidge et al., 2002). Since MSO VGSCs are not identical to any VGSCs recorded in heterologous expression systems, modulatory proteins likely play a role in shaping their properties. The Nav β1 accessory subunit, widely expressed in brain, negatively shifts the steady-state inactivation of heterologously expressed Nav currents closer to that of MSO VGSCs (Isom et al., 1992; Smith and Goldin, 1998; Burbidge et al., 2002). Other important structural and modulatory mechanisms include alternative splicing, glycosylation, calmodulin binding, phosphorylation, and the concentration of intracellular bicarbonate ions (Bruehl and Witte, 2003). With such diverse mechanisms shaping the functional properties of VGSCs, one Nav α-subunit isoform can give rise to currents with highly variable properties depending upon cell type and conditions (Pan and Beam, 1999; Cummins et al., 2001; Carr et al., 2003).
Recent studies of VGSC trafficking in neurons suggest that VGSCs are inserted into the plasma membrane throughout the cell. Endocytosis limits VGSC expression in the soma and dendrites but not in the axon initial segment, where a higher density of VGSCs is maintained via their association with ankyrin G (for review, see Cusdin et al., 2008). In MSO neurons, the hyperpolarized range of VGSC inactivation may serve to limit somatodendritic excitability beyond what is achieved through a reduction in channel density via endocytosis. Since large-amplitude action potentials typically generate strong, afterhyperpolarizations, the sharp reduction in the size of the action potential in the soma and dendrites may be advantageous for preventing spiking from distorting future cycles of ITD computations.
Role of VGSCs in dendritic integration
The present experiments indicate somatic VGSCs actively construct linear summation during synaptic integration in MSO neurons by counterbalancing the suppression of EPSP amplitudes by low voltage-activated potassium channels. The activation of both channel types during excitation results in a linear or slightly supralinear input-output relationship in the subthreshold range. Our computational modeling revealed that somatic VGSCs are essential for reproducing the EPSP amplification recorded experimentally. While these results do not preclude a significant contribution of axonal VGSCs to EPSP amplification, our models predict that these contributions would be restricted to the axon and not easily detected by somatic recordings. Subthreshold EPSPs also undergo amplification by somatic VGSCs in other neuron types, including prefrontal and somatosensory cortical neurons and hippocampal pyramidal neurons (Stuart and Sakmann, 1995; Lipowsky et al., 1996; Schwarz and Puil, 1997; Urban et al., 1998; Golding et al., 1999; González-Burgos and Barrionuevo, 2001). Several groups have postulated that this subthreshold EPSP amplification is generated by persistent VGSCs (Schwindt and Crill, 1995; Andreasen and Lambert, 1999). However, the persistent component of MSO VGSCs was not necessary for synaptic amplification in our computational model. MSO principal neurons also strongly differed from other cell types in the way that synaptic amplification by VGSCs affected synaptic timing. VGSC amplification typically increases the duration of excitation, causing a loss of temporal precision. However, in MSO neurons the timing of amplified EPSPs was maintained. Strong coactivation of low voltage-activated potassium channels expressed in high density in MSO principal neurons rapidly repolarizes both subthreshold EPSPs and action potentials (Svirskis et al., 2004; Scott et al., 2005, 2007). Thus, in MSO neurons, synaptic amplification by fast-inactivating VGSCs is well suited for improving membrane sensitivity without compromising temporal fidelity.
Our results provide direct experimental support for the idea that VGSCs can counterbalance inhibitory synaptic potentials, as first proposed by Zhou and Colburn (Zhou et al., 2005). However, our experiments reveal a complex interaction between somatic inhibition and VGSC populations in the soma and axon. During inhibitory events, linear membrane sensitivity in the subthreshold voltage range is preserved at the soma through VGSC amplification. Simultaneously, the voltage threshold for spike generation is decreased, presumably through the de-inactivation of sodium channels in the axon initial segment, the site of action potential initiation in binaural coincidence detector neurons (Scott et al., 2005, 2007; Kuba et al., 2006). While VGSCs in the soma undergo increased recovery from inactivation to maintain the same magnitude of EPSP amplification, the lowered spike threshold in the axon appears as the most consequential manifestation of inhibitory voltage changes on synaptic integration. These effects are consistent with the previous finding that action potentials in MSO neurons occur preferentially when excitation is preceded with brief hyperpolarizations during the course of mixed excitatory and inhibitory stimuli (Svirskis et al., 2004).
Although VGSCs are able to maintain EPSP amplification, leading inhibition still increases the amount of current needed to generate an action potential. Dodla et al. (2006) found that leading inhibition facilitated spiking, but such postinhibitory facilitation required a short inhibitory time constant (<1 ms). Our experiments used IPSC and IPSG durations similar to those reported by Magnusson et al. (2005), which are much longer than one millisecond. In keeping with the predictions made by Dodla and colleagues (2006), longer, more physiological IPSPs increased the overall current required to reach threshold in MSO neurons. Together, our results indicate that the interplay between inhibition and the dynamics of VGSC gating causes inhibitory inputs to adjust the gain of transformation between EPSPs and action potential output while maintaining the linearity of synaptic integration at the soma.
Our computational modeling experiments indicate that EPSP amplification by perisomatic VGSCs in MSO neurons is relatively insensitive to dendritic synapse location. Although models with dendritic VGSCs also boosted subthreshold EPSPs, the more distributed nature of the underlying sodium currents rendered amplification for action potential initiation more dependent on differences in input location. Our simulations also revealed lower conductance thresholds for bilateral inputs than unilateral inputs when VGSCs were excluded from the dendrites. Interestingly, a modeling study by Agmon-Snir et al. (1998) showed a larger driving force when excitation was distributed bilaterally versus unilaterally, resulting in more effective action potential initiation. Our current findings indicate that somatically located VGSCs preserve this bilateral advantage. Somatic VGSC amplification thus acts in concert with the bipolar dendritic morphology to further enhance MSO neuron sensitivity to temporally correlated patterns of bilateral excitation.
Appendix
For ionic currents, the unit for voltage is mV, current density is μA/cm2, gating variable time constants are in ms, and temperature is 35°C.
Ih:
g = gmax * r,
ih = gh * (v − eh),
eh = −39 mV
INa:
g = gmax * m4 * [(0.993 * h) + 0.007]
IK-LVA:
g = gmax * w4 * [(0.82 * z) + 0.18], iK = gK * (v − eK),eK = −90 mV.
 |
Footnotes
This work was supported by a grant from the National Institutes of Health (RO1 DC006788 to N.L.G.). L.L.S. and P.J.M. were supported by individual Ruth Kirschstein National Research Service Awards (DC007245 and DC008030, respectively). We thank Dr. Dan Johnston for the use of his Neurolucida system, and Drs. Sukant Khurana and Michael Roberts for critically reading this manuscript.
References
- Agmon-Snir H, Carr CE, Rinzel J. The role of dendrites in auditory coincidence detection. Nature. 1998;393:268–272. doi: 10.1038/30505. [DOI] [PubMed] [Google Scholar]
- Andreasen M, Lambert JD. Somatic amplification of distally generated subthreshold EPSPs in rat hippocampal pyramidal neurones. J Physiol. 1999;519:85–100. doi: 10.1111/j.1469-7793.1999.0085o.x. [DOI] [PMC free article] [PubMed] [Google Scholar]
- Brand A, Behrend O, Marquardt T, McAlpine D, Grothe B. Precise inhibition is essential for microsecond interaural time difference coding. Nature. 2002;417:543–547. doi: 10.1038/417543a. [DOI] [PubMed] [Google Scholar]
- Bruehl C, Witte OW. Relation between bicarbonate concentration and voltage dependence of sodium currents in freshly isolated CA1 neurons of the rat. J Neurophysiol. 2003;89:2489–2498. doi: 10.1152/jn.01083.2002. [DOI] [PubMed] [Google Scholar]
- Burbidge SA, Dale TJ, Powell AJ, Whitaker WR, Xie XM, Romanos MA, Clare JJ. Molecular cloning, distribution and functional analysis of the NA(V)1.6. Voltage-gated sodium channel from human brain. Brain Res Mol Brain Res. 2002;103:80–90. doi: 10.1016/s0169-328x(02)00188-2. [DOI] [PubMed] [Google Scholar]
- Carr DB, Day M, Cantrell AR, Held J, Scheuer T, Catterall WA, Surmeier DJ. Transmitter modulation of slow, activity-dependent alterations in sodium channel availability endows neurons with a novel form of cellular plasticity. Neuron. 2003;39:793–806. doi: 10.1016/s0896-6273(03)00531-2. [DOI] [PubMed] [Google Scholar]
- Catterall WA. From ionic currents to molecular mechanisms: the structure and function of voltage-gated sodium channels. Neuron. 2000;26:13–25. doi: 10.1016/s0896-6273(00)81133-2. [DOI] [PubMed] [Google Scholar]
- Chabbert C, Mechaly I, Sieso V, Giraud P, Brugeaud A, Lehouelleur J, Couraud F, Valmier J, Sans A. Voltage-gated Na+ channel activation induces both action potentials in utricular hair cells and brain-derived neurotrophic factor release in the rat utricle during a restricted period of development. J Physiol. 2003;553:113–123. doi: 10.1113/jphysiol.2003.043034. [DOI] [PMC free article] [PubMed] [Google Scholar]
- Cummins TR, Aglieco F, Renganathan M, Herzog RI, Dib-Hajj SD, Waxman SG. Nav1.3 sodium channels: rapid repriming and slow closed-state inactivation display quantitative differences after expression in a mammalian cell line and in spinal sensory neurons. J Neurosci. 2001;21:5952–5961. doi: 10.1523/JNEUROSCI.21-16-05952.2001. [DOI] [PMC free article] [PubMed] [Google Scholar]
- Cusdin FS, Clare JJ, Jackson AP. Trafficking and cellular distribution of voltage-gated sodium channels. Traffic. 2008;9:17–26. doi: 10.1111/j.1600-0854.2007.00673.x. [DOI] [PubMed] [Google Scholar]
- Dodla R, Svirskis G, Rinzel J. Well-timed, brief inhibition can promote spiking: postinhibitory facilitation. J Neurophysiol. 2006;95:2664–2677. doi: 10.1152/jn.00752.2005. [DOI] [PMC free article] [PubMed] [Google Scholar]
- Fricker D, Verheugen JA, Miles R. Cell-attached measurements of the firing threshold of rat hippocampal neurones. J Physiol. 1999;517:791–804. doi: 10.1111/j.1469-7793.1999.0791s.x. [DOI] [PMC free article] [PubMed] [Google Scholar]
- Goldberg JM, Brown PB. Response of binaural neurons of dog superior olivary complex to dichotic tonal stimuli: some physiological mechanisms of sound localization. J Neurophysiol. 1969;32:613–636. doi: 10.1152/jn.1969.32.4.613. [DOI] [PubMed] [Google Scholar]
- Golding NL, Ferragamo MJ, Oertel D. Role of intrinsic conductances underlying responses to transients in octopus cells of the cochlear nucleus. J Neurosci. 1999;19:2897–2905. doi: 10.1523/JNEUROSCI.19-08-02897.1999. [DOI] [PMC free article] [PubMed] [Google Scholar]
- González-Burgos G, Barrionuevo G. Voltage-gated sodium channels shape subthreshold EPSPs in layer 5 pyramidal neurons from rat prefrontal cortex. J Neurophysiol. 2001;86:1671–1684. doi: 10.1152/jn.2001.86.4.1671. [DOI] [PubMed] [Google Scholar]
- Häusser M, Spruston N, Stuart GJ. Diversity and dynamics of dendritic signaling. Science. 2000;290:739–744. doi: 10.1126/science.290.5492.739. [DOI] [PubMed] [Google Scholar]
- Hines ML, Carnevale NT. The NEURON simulation environment. Neural Comput. 1997;9:1179–1209. doi: 10.1162/neco.1997.9.6.1179. [DOI] [PubMed] [Google Scholar]
- Hu W, Tian C, Li T, Yang M, Hou H, Shu Y. Distinct contributions of Na(v)1.6 and Na(v)1.2 in action potential initiation and backpropagation. Nat Neurosci. 2009;12:996–1002. doi: 10.1038/nn.2359. [DOI] [PubMed] [Google Scholar]
- Isom LL, De Jongh KS, Patton DE, Reber BF, Offord J, Charbonneau H, Walsh K, Goldin AL, Catterall WA. Primary structure and functional expression of the beta 1 subunit of the rat brain sodium channel. Science. 1992;256:839–842. doi: 10.1126/science.1375395. [DOI] [PubMed] [Google Scholar]
- Kapfer C, Seidl AH, Schweizer H, Grothe B. Experience-dependent refinement of inhibitory inputs to auditory coincidence-detector neurons. Nat Neurosci. 2002;5:247–253. doi: 10.1038/nn810. [DOI] [PubMed] [Google Scholar]
- Kuba H, Ohmori H. Roles of axonal sodium channels in precise auditory time coding at nucleus magnocellularis of the chick. J Physiol. 2009;587:87–100. doi: 10.1113/jphysiol.2008.162651. [DOI] [PMC free article] [PubMed] [Google Scholar]
- Kuba H, Ishii TM, Ohmori H. Axonal site of spike initiation enhances auditory coincidence detection. Nature. 2006;444:1069–1072. doi: 10.1038/nature05347. [DOI] [PubMed] [Google Scholar]
- Larkum ME, Nevian T. Synaptic clustering by dendritic signalling mechanisms. Curr Opin Neurobiol. 2008;18:321–331. doi: 10.1016/j.conb.2008.08.013. [DOI] [PubMed] [Google Scholar]
- Leão RM, Kushmerick C, Pinaud R, Renden R, Li GL, Taschenberger H, Spirou G, Levinson SR, von Gersdorff H. Presynaptic Na+ channels: locus, development, and recovery from inactivation at a high-fidelity synapse. J Neurosci. 2005;25:3724–3738. doi: 10.1523/JNEUROSCI.3983-04.2005. [DOI] [PMC free article] [PubMed] [Google Scholar]
- Lindsey BG. Fine structure and distribution of axon terminals from the cochlear nucleus on neurons in the medial superior olivary nucleus of the cat. J Comp Neurol. 1975;160:81–103. doi: 10.1002/cne.901600106. [DOI] [PubMed] [Google Scholar]
- Lipowsky R, Gillessen T, Alzheimer C. Dendritic Na+ channels amplify EPSPs in hippocampal CA1 pyramidal cells. J Neurophysiol. 1996;76:2181–2191. doi: 10.1152/jn.1996.76.4.2181. [DOI] [PubMed] [Google Scholar]
- Liu Y, Li X. Effects of salicylate on voltage-gated sodium channels in rat inferior colliculus neurons. Hear Res. 2004;193:68–74. doi: 10.1016/j.heares.2004.03.006. [DOI] [PubMed] [Google Scholar]
- Magnusson AK, Kapfer C, Grothe B, Koch U. Maturation of glycinergic inhibition in the gerbil medial superior olive after hearing onset. J Physiol. 2005;568:497–512. doi: 10.1113/jphysiol.2005.094763. [DOI] [PMC free article] [PubMed] [Google Scholar]
- Marcotti W, Johnson SL, Rusch A, Kros CJ. Sodium and calcium currents shape action potentials in immature mouse inner hair cells. J Physiol. 2003;552:743–761. doi: 10.1113/jphysiol.2003.043612. [DOI] [PMC free article] [PubMed] [Google Scholar]
- Martina M, Jonas P. Functional differences in Na+ channel gating between fast-spiking interneurones and principal neurones of rat hippocampus. J Physiol. 1997;505:593–603. doi: 10.1111/j.1469-7793.1997.593ba.x. [DOI] [PMC free article] [PubMed] [Google Scholar]
- Mathews PJ, Jercog PE, Rinzel JR, Golding N. A Dendritic Gradient of Kv1 Channels Shapes Excitation in Principal Neurons of the Medial Superior Olive. Soc Neurosci Abstr. 2008;29 664.17. [Google Scholar]
- Ming G, Wang LY. Properties of voltage-gated sodium channels in developing auditory neurons of the mouse in vitro. Chin Med Sci J. 2003;18:67–74. [PubMed] [Google Scholar]
- Oliver D, Plinkert P, Zenner HP, Ruppersberg JP. Sodium current expression during postnatal development of rat outer hair cells. Pflugers Arch. 1997;434:772–778. doi: 10.1007/s004240050464. [DOI] [PubMed] [Google Scholar]
- Pan F, Beam KG. The absence of resurgent sodium current in mouse spinal neurons. Brain Res. 1999;849:162–168. doi: 10.1016/s0006-8993(99)02060-0. [DOI] [PubMed] [Google Scholar]
- Raman IM, Bean BP. Resurgent sodium current and action potential formation in dissociated cerebellar Purkinje neurons. J Neurosci. 1997;17:4517–4526. doi: 10.1523/JNEUROSCI.17-12-04517.1997. [DOI] [PMC free article] [PubMed] [Google Scholar]
- Sather W, Dieudonné S, MacDonald JF, Ascher P. Activation and desensitization of N-methyl-d-aspartate receptors in nucleated outside-out patches from mouse neurones. J Physiol. 1992;450:643–672. doi: 10.1113/jphysiol.1992.sp019148. [DOI] [PMC free article] [PubMed] [Google Scholar]
- Schwarz DW, Puil E. Firing properties of spherical bushy cells in the anteroventral cochlear nucleus of the gerbil. Hear Res. 1997;114:127–138. doi: 10.1016/s0378-5955(97)00162-7. [DOI] [PubMed] [Google Scholar]
- Schwindt PC, Crill WE. Amplification of synaptic current by persistent sodium conductance in apical dendrite of neocortical neurons. J Neurophysiol. 1995;74:2220–2224. doi: 10.1152/jn.1995.74.5.2220. [DOI] [PubMed] [Google Scholar]
- Scott LL, Mathews PJ, Golding NL. Posthearing developmental refinement of temporal processing in principal neurons of the medial superior olive. J Neurosci. 2005;25:7887–7895. doi: 10.1523/JNEUROSCI.1016-05.2005. [DOI] [PMC free article] [PubMed] [Google Scholar]
- Scott LL, Hage TA, Golding NL. Weak action potential backpropagation is associated with high-frequency axonal firing capability in principal neurons of the gerbil medial superior olive. J Physiol. 2007;583:647–661. doi: 10.1113/jphysiol.2007.136366. [DOI] [PMC free article] [PubMed] [Google Scholar]
- Smith RD, Goldin AL. Functional analysis of the rat I sodium channel in Xenopus oocytes. J Neurosci. 1998;18:811–820. doi: 10.1523/JNEUROSCI.18-03-00811.1998. [DOI] [PMC free article] [PubMed] [Google Scholar]
- Spitzer MW, Semple MN. Neurons sensitive to interaural phase disparity in gerbil superior olive: diverse monaural and temporal response properties. J Neurophysiol. 1995;73:1668–1690. doi: 10.1152/jn.1995.73.4.1668. [DOI] [PubMed] [Google Scholar]
- Stotler WA. An experimental study of the cells and connections of the superior olivary complex of the cat. J Comp Neurol. 1953;98:401–431. doi: 10.1002/cne.900980303. [DOI] [PubMed] [Google Scholar]
- Stuart G, Sakmann B. Amplification of EPSPs by axosomatic sodium channels in neocortical pyramidal neurons. Neuron. 1995;15:1065–1076. doi: 10.1016/0896-6273(95)90095-0. [DOI] [PubMed] [Google Scholar]
- Stuart G, Spruston N, Sakmann B, Häusser M. Action potential initiation and backpropagation in neurons of the mammalian CNS. Trends Neurosci. 1997;20:125–131. doi: 10.1016/s0166-2236(96)10075-8. [DOI] [PubMed] [Google Scholar]
- Svirskis G, Kotak V, Sanes DH, Rinzel J. Sodium along with low-threshold potassium currents enhance coincidence detection of subthreshold noisy signals in MSO neurons. J Neurophysiol. 2004;91:2465–2473. doi: 10.1152/jn.00717.2003. [DOI] [PMC free article] [PubMed] [Google Scholar]
- Urban NN, Henze DA, Barrionuevo G. Amplification of perforant-path EPSPs in CA3 pyramidal cells by LVA calcium and sodium channels. J Neurophysiol. 1998;80:1558–1561. doi: 10.1152/jn.1998.80.3.1558. [DOI] [PubMed] [Google Scholar]
- Willms AR. NEUROFIT: software for fitting Hodgkin-Huxley models to voltage-clamp data. J Neurosci Methods. 2002;121:139–150. doi: 10.1016/s0165-0270(02)00227-3. [DOI] [PubMed] [Google Scholar]
- Wooltorton JR, Gaboyard S, Hurley KM, Price SD, Garcia JL, Zhong M, Lysakowski A, Eatock RA. Developmental changes in two voltage-dependent sodium currents in utricular hair cells. J Neurophysiol. 2007;97:1684–1704. doi: 10.1152/jn.00649.2006. [DOI] [PubMed] [Google Scholar]
- Yin TC, Chan JC. Interaural time sensitivity in medial superior olive of cat. J Neurophysiol. 1990;64:465–488. doi: 10.1152/jn.1990.64.2.465. [DOI] [PubMed] [Google Scholar]
- Zhou Y, Carney LH, Colburn HS. A model for interaural time difference sensitivity in the medial superior olive: interaction of excitatory and inhibitory synaptic inputs, channel dynamics, and cellular morphology. J Neurosci. 2005;25:3046–3058. doi: 10.1523/JNEUROSCI.3064-04.2005. [DOI] [PMC free article] [PubMed] [Google Scholar]