The use of health services rises substantially with increasing age.1 Although this is commonly assumed to be a consequence of longevity, the chief determinants of lifetime use of health services, irrespective of age at death, may be the antecedents of death,2 and increased use by elderly people may result from their being closer to death than young people. We studied time in hospital in the final 15 years of life (as a proxy for major morbidity) and related this to age at death.
Subjects, methods, and results
We used data from the Oxford record linkage study, which includes death certificates and statistical records of NHS hospital admissions for part of southern England (population 1.9 million).3We chose 1991 as the base year because the data provided a retrospective period of 15 years and because from 1992, the system of providing mortality data to the record linkage study changed. We included all NHS admissions in the 15 years before death, of residents of the region who died in 1991 at 45 years and over (excluding those in the specialties of psychiatry and obstetrics). The data were grouped separately by sex and by age at death at 45-59 years and in five year age groups thereafter to 90-94 (too few deaths occurred at ≥95 years for worthwhile analysis). We analysed time in hospital for these age groups in each of the 15 years before death and calculated centile distributions of “heaviness” of hospital use in each group.
There were 18 524 deaths (men, 9156; women, 9368). Time in hospital in the 15 years before death rose with increasing age—median days in hospital rose in men from 11 days at age 45-59 at death to 26 days at age 90-94 at death and in women from 18 days at age 45-59 to 32 days at age 90-94. These increases in the median represent an extra half day in hospital in the 15 years before death for each additional year of life beyond age 60.
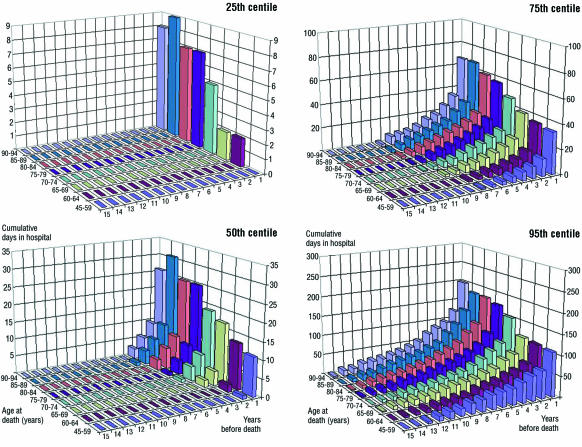
Time in hospital did not accumulate uniformly over the 15 years before death. Generally, hospital admissions either occurred in the years immediately before death and increased in the final year of life or were confined to that last year. The total time spent in hospital varied widely within each age group: in men dying aged 60-64 the total stay was 2 days at the 25th centile, 35 days at the 75th centile, and 110 days at 95th centile; for men aged 90-94 the comparable figures were 8, 67, and 200 days. The figure shows results for men (patterns for women were similar, and these appear on the BMJ's website). At every age 15-20% of those who died had no recorded hospital admission.
Comment
Time spent in hospital in the final few years of life increased a little with advancing age at death, although generally, with increasing age, time in hospital is confined to the few years before death; this finding goes beyond the findings of the Oxford record linkage study on time in hospital in the final year of life.4 Patterns of hospital use vary widely at every age: irrespective of age, a minority of people are very heavy users, but about a quarter of all people at each age die having spent little or no time in hospital. Our figures may overestimate the proportion of people who make no or little use of hospital inpatient facilities because, especially among very old people, some will have died in non-NHS long stay care establishments or psychiatric units without admission to an acute clinical unit. Nevertheless, in every age group many deaths will have been sudden or heralded only by brief illness.
Our data undermine the proposition that health care in elderly people should be restricted because they have “used up” their entitlement; the data show that generally they have deferred drawing on their notional hospital “account” until their final years of life. Elderly people are heavy users of hospital services, but this is largely because most people now die in old age.
Supplementary Material
Figure.
Cumulative number of days spent in hospital by men in the final 15 years of life, by age at death and number of years before death, for the values within each age group at the 25th, 50th, 75th, and 95th centiles of “heaviness” of hospital use. These data are cross sectional—that is, based on the values taken by the total population in the year before death, 2 years before death, 3 years before death, etc
Acknowledgments
We thank Myfanwy Griffiths for her computer analysis of the data in the Oxford record linkage study.
Footnotes
Funding: This work was supported by Anglia and Oxford Regional Research and Development funds. The Unit of Health Care Epidemiology receives core funding from the NHS Executive.
Competing interests: None declared.
website extra: An additional figure appears on the BMJ's website www.bmj.com
References
- 1.Victor C R, Higginson I. Effectiveness of care for older people: a review. Qual Health Care. 1994;3:210–216. doi: 10.1136/qshc.3.4.210. [DOI] [PMC free article] [PubMed] [Google Scholar]
- 2.Van Weel C, Michels J. Dying, not old age, to blame for costs of health care. Lancet. 1997;350:1159–1160. doi: 10.1016/S0140-6736(97)08312-8. [DOI] [PubMed] [Google Scholar]
- 3.Goldacre M J, Simmons H, Henderson J, Gill LE. Trends in episode based and person based rates of admission to hospital in the Oxford record linkage study area. BMJ. 1988;296:583–584. doi: 10.1136/bmj.296.6621.583. [DOI] [PMC free article] [PubMed] [Google Scholar]
- 4.Henderson J, Goldacre M J, Griffith M. Hospital care for the elderly in the final year of life: a population based study. BMJ. 1990;301:17–19. doi: 10.1136/bmj.301.6742.17. [DOI] [PMC free article] [PubMed] [Google Scholar]
Associated Data
This section collects any data citations, data availability statements, or supplementary materials included in this article.


