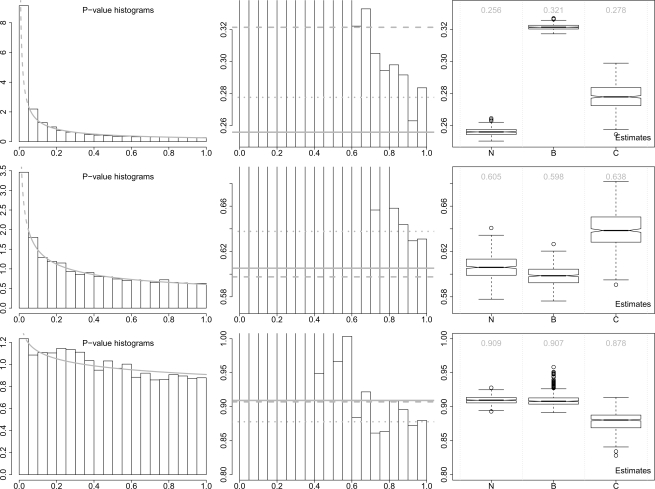
Fig. 3.
Application results: histograms of P-values and boxplots of bootstrap estimates of π0. The P-values are calculated based on three experimental datasets: the renal data (upper panel), the T-cell data (middle panel) and the smoke data (lower panel). In the histograms (left panel), the gray curves represent the fitted censored beta mixture models (the dashed parts are artificially censored). The zoomed-in histograms (middle panel) are also shown to compare the estimate of π0 from different methods. The gray solid, dashed and dotted lines represent the estimates from our method, BUM and convest, respectively. In the boxplots (right panel), N = our method, B = BUM and C = convest. The numbers in gray color are the estimates of π0 based on the original data.

