

Abstract
Motivation: The identification of catalytic residues is a key step in understanding the function of enzymes. While a variety of computational methods have been developed for this task, accuracies have remained fairly low. The best existing method exploits information from sequence and structure to achieve a precision (the fraction of predicted catalytic residues that are catalytic) of 18.5% at a corresponding recall (the fraction of catalytic residues identified) of 57% on a standard benchmark. Here we present a new method, Discern, which provides a significant improvement over the state-of-the-art through the use of statistical techniques to derive a model with a small set of features that are jointly predictive of enzyme active sites.
Results: In cross-validation experiments on two benchmark datasets from the Catalytic Site Atlas and CATRES resources containing a total of 437 manually curated enzymes spanning 487 SCOP families, Discern increases catalytic site recall between 12% and 20% over methods that combine information from both sequence and structure, and by ≥50% over methods that make use of sequence conservation signal only. Controlled experiments show that Discern's improvement in catalytic residue prediction is derived from the combination of three ingredients: the use of the INTREPID phylogenomic method to extract conservation information; the use of 3D structure data, including features computed for residues that are proximal in the structure; and a statistical regularization procedure to prevent overfitting.
Contact: kimmen@berkeley.edu
Supplementary information: Supplementary data are available at Bioinformatics online.
1 INTRODUCTION
The prediction of protein function from limited data is an important challenge in the post-genomic era. Bioinformatics methods that provide clues to the roles of individual residues in a protein are used by biologists to prioritize site-directed mutagenesis experiments and to provide a more specific prediction of function than simple homology-based approaches (George et al., 2005). In this work, we focus on the task of predicting catalytic residues in enzymes using information from sequence and structure.
The earliest methods for catalytic residue prediction relied on detecting conservation patterns across a family (Casari et al., 1995; Landau et al., 2005; Lichtarge et al., 1996) followed by increasingly powerful sequence-based scoring functions (Aloy et al., 2001; Mayrose et al., 2004; Mihalek et al., 2004; Sankararaman and Sjölander, 2008). Methods relying exclusively on information from solved 3D structures have been developed, analyzing features such as the geometric arrangements of residues (Fetrow and Skolnick, 1998), surface geometry (Peters et al., 1996), electrostatics (Bate and Warwicker, 2004), energetics (Elcock, 2001; Laurie and Jackson, 2005) and chemical properties (Ondrechen et al., 2001; Tong et al., 2008). Other methods combine features derived from sequence and structure (Aloy et al., 2001; Alterovitz et al., 2009; Gutteridge et al., 2003; Innis et al., 2004; Landgraf et al., 2001; Ota et al., 2003; Pazos and Sternberg, 2004; Petrova and Wu, 2006; Youn et al., 2007), or use sequence data in combination with predicted structure features to improve accuracy (Fischer et al., 2008).
In this article, we present a new method for predicting catalytic residues, which we have named Discern. Discern is a statistical predictor that achieves a significant improvement in performance over other catalytic residue prediction methods. Previously, the best recall (the fraction of true catalytic residues that are predicted to be catalytic) reported on homology-reduced datasets is 57% at a precision (the fraction of predicted catalytic residues that are indeed catalytic) of 18.5% (Youn et al., 2007). In comparison, at the same precision, Discern yields a recall of at least 69%, representing an improvement of ≥12% in recall over the best current methods for this task.
1.1 The Discern methodology for catalytic residue prediction
The statistical model underlying Discern is a binary logistic regression model (Hosmer and Lemeshow, 2000), which predicts catalytic residues based on a set of sequence and structure features describing a site. Features considered by Discern include evolutionary measures of positional conservation, relative and absolute solvent accessibility, presence in a cleft or pocket, secondary structure, polarity, charge and so on. Logistic regression takes a weighted linear combination of these features, where the weights are learned from a training set of experimentally characterized enzymes, and then transforms the result to a probability scale (see Fig. 1 for an overview).
Fig. 1.

Overview of the system for catalytic residue prediction: (0) Features are derived from the sequence and 3D structure of an enzyme and from homologs identified using PSI-BLAST. Many features are considered, including the identity of the amino acid, evolutionary conservation scores and presence in a pocket or cleft. (1) Annotated dataset (training data): a dataset of enzymes with labeled catalytic and non-catalytic residues, along with features derived for each residue. (2) We estimate the parameters of the logistic regression model from the training dataset (this is known as a supervised learning procedure) using L1-regularized maximum likelihood. The parameters refer to the weights associated with the features. The L1-regularization tends to set many of the parameters to zero, resulting in a sparse model. (3) The output of the training phase is a predictor. (4) To predict catalytic residues for a new enzyme, features are derived for the enzyme as in step 1 and the features are used by the logistic regression to classify each residue. (5) The predictor derived in step 3 is used to predict the probability that each residue is catalytic (step 6).
While statistical models making use of information from sequence and structure have been developed for catalytic residue prediction, and individual aspects of the Discern model have been used by other methods (Alterovitz et al., 2009; Gutteridge et al., 2003; Petrova and Wu, 2006; Youn et al., 2007), Discern brings together three ideas that jointly differentiate it from existing predictors and which provide a dramatic improvement in prediction accuracy.
The first distinguishing aspect of the Discern model is the use of the INTREPID phylogenomic conservation score (Sankararaman and Sjölander, 2008). INTREPID uses Jensen–Shannon (JS) divergence and phylogenetic tree traversal to estimate the evolutionary conservation for each residue in a protein, computing this score at every node encountered on a path from the root of the tree to the leaf corresponding to the sequence of interest. The final score for each residue is the maximum JS divergence computed on that path. This procedure enables INTREPID to extract a conservation signal that may only appear at deeply nested subtrees in the superfamily phylogeny, and allows it to be applied to highly divergent datasets.
The second critical aspect of Discern is its use of structure information, in particular, the inclusion of features for structurally proximal residues in the feature vector describing a site. For instance, it is known that enzyme active sites are structurally conserved across distant homologs (Baker and Sali, 2001). This structural conservation is reflected by correspondingly high levels of sequence conservation in the vicinity of catalytic residues. Catalytic residues have other structural features, e.g. they are typically polar or charged, found in clefts or pockets, and at least somewhat solvent accessible (Bartlett et al., 2002). The Discern predictor represents these fundamental characteristics of active sites by including features for the individual site whose catalycity is being predicted and also for its structural neighbors.
The inclusion of many features in the statistical model motivates the third critical aspect of Discern —the use of an L1-regularization procedure to avoid model overfitting. Overfitting can result when a statistical model has many more parameters than the number of training data points, so that it can fit the training data very precisely but fail to generalize to new data (Hastie et al., 2001). Our results show that regularization is essential for the considerable improvement in Discern prediction accuracy, and that performance degrades significantly without regularization (see Supplementary Materials for additional discussion of the overfitting problem). L1-regularization addresses the problem of overfitting by maximizing the likelihood of the logistic regression model under a constraint on the sum of the absolute values of the model parameters; such a constrained estimation procedure yields a sparse model in which many parameters are set to zero and also derives appropriate weights for features that are highly correlated (or uninformative) (Tibshirani, 1996). L1-regularization has been shown to yield models that are better predictors than those based on unregularized estimates (Greenshtein and Ritov, 2004; Hastie et al., 2001; Tibshirani, 1996; van de Geer, 2008; Zhao and Yu, 2006), and has been used in a number of bioinformatics applications including gene expression microarray analysis (Segal et al., 2003; Shevade and Keerthi, 2003) and genome-wide association studies (Hoggart et al., 2008).
2 MATERIALS AND METHODS
In this section, we describe the logistic regression model and the estimation procedure underlying Discern. See Supplementary Materials for additional details.
2.1 L1-regularized logistic regression
Given an enzyme i with ni amino acid residues, we denote by xj(i) the d-dimensional vector of residue-specific features at site j, j=1,…, ni, by X(i) the d × ni matrix of all such features, and by zj(i)∈{+1, −1} the catalytic label of residue j (whether the residue is catalytic or not). We denote the set of structural neighborhood features by a dN × ni matrix Y(i). Here, N refers to the number of structural neighbors of each residue. We model the conditional distribution of the random variable Zj(i)∈{+1, −1} by a logistic regression model
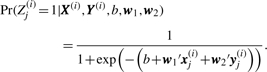 |
The model has parameters (b, w1, w2); b is the intercept term which controls the trade-off between false positives and false negatives, w1 is the set of weights corresponding to the residue features, while w2 is the set of weights for the structural neighbor features. Given a training set of enzymes and their catalytic residue annotations, we estimate the parameters (b, w1, w2) using a regularized maximum likelihood approach in which we maximize the sum of the likelihood and an L1 penalty term:
where w=(w1, w2) and ‖w‖1=∑k |wk| is the L1 norm. The non-negative regularization parameter λ controls the sparsity of the estimate of w; larger values of λ lead to estimates with increasing numbers of zero components. We chose the value of λ by a cross-validation procedure. The optimization problem is solved using an interior point method as implemented in Koh et al. (2007).
2.2 Features for catalytic residue prediction
The feature vector used in our logistic regression model consists of a total of 528 features—48 features at the residue of interest and at 10 neighboring residues. We provide a brief description of these features in this section as well as some of the options we considered; further details are provided in the Supplementary Materials.
2.2.1 Sequence conservation features
We made use of three sequence conservation scores. The first, termed Global-JS, is the JS divergence (Lin and Wong, 1990) between the amino acid distribution over the family as a whole and a background distribution derived from the BLOCKS (Henikoff and Henikoff, 1992) database [with prior weight = 0.5 as in (Capra and Singh, 2007)]. The other two sequence conservation scores make explicit use of the phylogenetic tree topology using the INTREPID algorithm (Sankararaman and Sjölander, 2008). The two variants used the JS divergence (INTREPID-JS) and the log frequency of the modal amino acid (INTREPID-LO). See (Sankararaman and Sjölander, 2008) for additional details.
Sequence conservation scores for each position were derived based on multiple sequence alignments of homologs gathered from the UniProt database (Apweiler et al., 2004) using PSI-BLAST (Altschul et al., 1997). PSI-BLAST was run for four iterations with an E-value inclusion threshold of 1 × 10⁻⁴ from which a maximum of 1000 homologs were retrieved. A multiple sequence alignment was estimated using MUSCLE (Edgar, 2004) with MAXITERS set to 2, followed by the removal of identical sequences and the deletion of columns in which the seed had a gap. Phylogenomic conservation scores computed using INTREPID also made use of phylogenetic trees from each alignment. A neighbor-joining tree was built from each alignment using the PHYLIP package (Felsenstein, 1993), using midpoint rooting (placing the root at the midpoint of the longest span in the tree).
2.2.2 Amino acid properties
Amino acids have varying catalytic propensities as noted in Bartlett et al. (2002). We use the amino acid types as features and also classify the amino acid into one of three categories—charged (D,E,H,K,R), polar (Q,T,S,N,C,Y) or hydrophobic (A,F,G,I,L,M,P,V,W). See Supplementary Materials for a description of this classification.
2.2.3 Structure-based features
For each residue, we compute the residue centrality, the B-factor, solvent accessibility, presence in a cleft and secondary structure as follows. We compute the B-factor, a measure of thermal motion for each residue as the average of the B-factors of all its atoms. We compute a measure of centrality for each residue j as the inverse of the average distance from a residue to all other residues in the enzyme; i.e.  where d(k, j) is the distance from j to k along the contact map. A residue that is located in the center of the protein has smaller average distance to all other residues and hence a high centrality measure. We use the seven-state secondary structure representation output by DSSP (Kabsch and Sander, 1983). The area of a residue accessible to the solvent is obtained from NACCESS (Hubbard and Thornton, 1993). We use LigSitecsc (Huang and Schroeder, 2006) to detect the presence of a residue in one of the three largest pockets in the enzyme.
2.3 Benchmark datasets
We present results from two datasets of manually curated enzymes from the CATRES (Bartlett et al., 2002) and Catalytic Site Atlas (CSA; Porter et al., 2004) datasets. CSA and CATRES define a residue as catalytic if it has been shown to be involved in catalysis either directly or through other molecules, to stabilize an intermediate transition state, or to influence a cofactor or substrate that aids catalysis. The manually curated sections of CSA and CATRES contain enzymes with solved PDB structures for which experimental evidence for catalytic sites have been obtained from the literature.
Our primary benchmark dataset, termed CATRES-FAM, consists of 140 enzymes from the CATRES dataset, and was included to allow a direct comparison with Youn et al. and Gutteridge et al.. This dataset contains a total of 471 catalytic residues out of a total of 49 180 residues with a median of three catalytic residues per enzyme.
Our second dataset, termed CSA-Fischer, consists of 423 enzymes from the manually curated section of the CSA selected by Fischer and colleagues (2008) to benchmark their FRcons method, and used here to allow a direct comparison to FRcons.
Additional information on these benchmark datasets and results and details on two other datasets are reported in Supplementary Materials.
2.4 Performance measurements
We measure the precision and recall on the test set as follows: Precision , Recall =
  , where a true positive (TP) is a predicted residue included in the benchmark dataset, a false positive (FP) is a predicted residue not listed in the benchmark and a false negative (FN) is a catalytic residue in the benchmark which has been missed by a method. The precision–recall curves were averaged over all the cross-validation folds using the code from Davis and Goadrich (2006). See Section S-4.2.1 in Supplementary Materials for more details.
For the CSA-Fischer dataset, we followed the protocol described in Fischer et al. (2008), i.e. we performed 2-fold cross-validation, ensuring that no domain from the same SCOP superfamily appeared in both the folds. For CATRES-FAM and other datasets (reported in the Supplementary Materials), we used 10-fold cross-validation.
2.5 ConSurf and Evolutionary Trace results
ConSurf results for CATRES-FAM were obtained from the database of precomputed results (http://consurfdb.tau.ac.il). Evolutionary Trace (ET) results were obtained from the precomputed results of the ET server at the Baylor College of Medicine (http://mammoth.bcm.tmc.edu/ETserver.html).
3 RESULTS
In this section, we report results of large-scale experiments on manually curated enzymes from the CSA (Porter et al., 2004) and CATRES (Bartlett et al., 2002) datasets, and compare Discern with the best methods for catalytic residue prediction reported in the literature. Three of these methods make use of machine learning algorithms to combine sequence and structure information (or inferences): a neural network approach from Gutteridge et al. (2003), a support vector machine (SVM) method from Youn et al. (2007) and the FRcons method from Fischer et al. (2008). (Note that FRcons uses sequence information only, but predicts structural features to improve performance.) Three other methods tested make use of sequence conservation information only: ConSurf (Landau et al., 2005), ET (Mihalek et al., 2004) and INTREPID (Sankararaman and Sjölander, 2008). Web servers, software or precomputed results were available for ET, ConSurf and INTREPID making possible a head-to-head comparison with these methods.
We compared Discern against Gutteridge et al., Youn et al. and FRcons based on precision and recall statistics reported by the authors. We also include a control method in these experiments designed to evaluate the contributions of the different ingredients of the Discern predictor. The control was trained identically to Discern, but did not include features for structural neighbors or the INTREPID phylogenomic conservation scores, nor was any attempt made to enforce model sparsity. Notably, the performance of the control is very similar to the results reported in Youn et al., suggesting that the improved performance of Discern relative to Youn et al. is unlikely to be an artifact of differences between the CATRES-FAM dataset and the datasets used by these authors.
We used cross-validation on two benchmark datasets to evaluate Discern performance in catalytic site prediction, reporting the average recall and precision in the withheld test sets in each partition. The first dataset, CATRES-FAM, was designed to allow comparisons to methods developed by Youn et al. (2007) and Gutteridge et al. (2003). The dataset used by Youn et al. (2007) consists of a random subset of the domains present in ASTRAL 40v1.65 (Chandonia et al., 2004). Since the domains that were finally selected were not recorded (E. Youn, personal communication), we could not evaluate Discern on their dataset. CATRES-FAM consists of 140 enzymes from CATRES filtered at the SCOP (Structural Classification of Proteins; Murzin et al., 1995) family level (i.e. no pair were from the same SCOP family). The second dataset, CSA-Fischer, consists of 423 enzymes from the CSA selected by Fischer and colleagues (2008) to benchmark FRcons, and used in these experiments to allow a direct comparison with FRcons.
On the CATRES-FAM dataset, as shown in Figure 2, Discern recall is 12–20% higher than that of Gutteridge et al. and Youn et al. at the levels of precision reported by these authors. Relative to methods that are restricted to conservation signal only (INTREPID, ConSurf and ET), Discern has 50% greater recall: at a precision of 18%, Discern has 69% recall, while INTREPID and ET reach 19% and 2% recall, respectively (ConSurf does not attain a precision of 18% over the entire range of recalls). We also evaluated two prediction methods that make use of 3D structure information only, LigSitecsc (Huang and Schroeder, 2006) and PASS (Brady and Stouten, 2000), on this dataset. Since these methods do not provide scores for individual residues, we used the residues in the top three sites identified by each method as predicted active site residues. Using this criterion, PASS attained a recall of 29.7% for a corresponding precision of 3%, and LigSite obtained a recall of 10.6% at a corresponding precision of 1.2%.
Fig. 2.

Results on the CATRES-FAM benchmark dataset. Methods included in this analysis are a neural network method from Gutteridge et al. (2003), a Support Vector Machine approach from Youn et al. (2007), ConSurf (Landau et al., 2005), INTREPID (Sankararaman and Sjölander, 2008), ET (Mihalek et al., 2004) and the control method described in Table 1. The methods of Youn et al., Gutteridge et al. and the control use information from both sequence and structure, while ConSurf, INTREPID and ET use conservation signal only to predict catalytic sites. In cross-validation experiments on this dataset, at 18% precision, Discern reaches 69% recall, corresponding to a gain in recall of 20% over Gutteridge et al. and 12% over Youn et al. (based on their reported performance at this level of precision on similar datasets). Relative to the methods that use conservation signal only, the difference is greater: at 18% precision, INTREPID reaches 19% recall, while ET reaches a recall of 2%. ConSurf does not reach 18% precision on this dataset.
On the CSA-Fischer dataset, Discern provides superior performance relative to FRcons for recall values >30%. At a precision of 18.5% [reported by (Youn et al., 2007)], Discern achieves 15% higher recall than FRcons (Discern and FRcons achieve 65% and 50% recall, respectively). Analysis of the area under the precision–recall curve, termed PR-AUC, shows that the PR-AUC of FRcons is 0.1 compared with 0.23 for Discern. On this more extensive dataset, Discern recall is 14% higher than that of Youn et al. (2007) and 18% higher than that of Gutteridge et al. (2003) at the precision levels reported by these authors. See Supplementary Figure S-2 for details.
In addition to these large-scale experiments, we present in the next section a detailed case study of Bovine α-Chymotrypsin (PDB id:1acb). Additional experiments on datasets filtered to remove members from the same SCOP superfamily and a second case study on Escherichia coli Asparagine Synthetase (PDB id:12as) are reported in the Supplementary Materials (Section S-5.1).
3.1 Bovine α-Chymotrypsin (PDB id:1acb, E.C. number: 3.4.121.1)
Chymotrypsin (E.C. number 3.4.121.1) is the paradigmatic member of the so-called serine protease family of enzymes that are distinguished by having a catalytic triad of residues at the active site (H57, D102 and S195) (Hedstrom, 2002; Kraut, 1977; Polgar, 2005).
To predict catalytic residues for the α-chymotrypsin structure 1acb, we estimated Discern parameters using a subset of the CATRES-FAM dataset, removing all enzymes in the same SCOP superfamily as 1acb. The top 15 residues predicted by Discern are shown in Figure 3, with additional details provided in the Supplementary Table S-2.
Fig. 3.

Discern predictions on Bovine α-Chymotrypsin (PDB id:1acb). The top 15 Discern predictions are shown. Discern predicts the catalytic triad H57, D102 and S195, with ranks 6, 4 and 1, respectively. The catalytic glycine, G193, is predicted with rank 13. Y228 (Discern rank 10) is found in the S1 specificity pocket, but its functional role is unknown. The roles of Y228 and other residues (D194, C191, C42, C58, Q30, C220, S214, G197, H40 and G196) are described in Supplementary Table S-2.
Discern gives the catalytic serine (S195) rank 1. The β-hydroxyl moiety of S195, aided by general base catalysis by the imidazole (NE2 nitrogen atom) group of H57 (rank 6), attacks the carbon atom of the scissile peptide or ester substrate to form a tetrahedral adduct, which, in turn, decomposes to form a covalent enzyme bound ester intermediate with concomitant release of the amino or hydroxyl portion of the peptide or ester substrate, respectively. The general base catalysis is assisted in a way that is not fully understood by the β-carboxylate of D102 (rank 4), whose β-carboxylate functionality makes a strong hydrogen bond (Frey et al., 1994) with the second nitrogen atom (ND1) of H57. The covalent intermediate is subsequently hydrolyzed via H57/D102-mediated activation of the attacking water molecule to yield the carboxylate component of the substrate with regeneration of the enzyme. The transition state leading to the tetrahedral intermediate is stabilized by developing hydrogen bonds from the main chain NH groups of G193 (rank 13) and S195.
The pancreatic serine proteases are biosynthesized in the pancreas as inactive proenzymes, which are activated in the small intestine by proteolytic cleavage of a 15-member peptide from the N-termini. This results in a number of conformational changes with concomitant repositioning of hydrogen bonds involving several residues including Q30 (rank 8) (Kraut, 1977) and H40 (rank 14) (Berna et al., 1997). D194 (rank 2) forms a salt bridge with the nascent I16 that forms the N-terminus of the active enzyme.
Discern identifies residues G197 (rank 12) and G196 (rank 15); these allow the peptide chain to form a distinct structural element called a β-bulge (Richardson et al., 1978) which may be important for positioning the active site serine (S195). Discern also identifies C191 (rank 3) and C220 (rank 9); C191 and C220 form a disulfide bond which has been shown to be critical for enzymatic function (replacement of C191 and C220 with a pair of alanines resulted in a 100- to 1000-fold decrease in activity) (Vàrallyay et al., 1997). Another pair of cysteine residues forming a disulfide bond are found in the top 15: C42 (rank 5) and C58 (rank 7). The C42–C58 disulfide is part of the binding site for the amino terminus of the scissile peptide bond (the P1′ site) (Kraut, 1977).
The roles of two remaining residues in Discern's top 15 predictions are unknown. The highly conserved S214 (rank 11) is in hydrogen bond contact with one of the β-carboxylate oxygen atoms of D102, and S214E and S214K mutants have been shown to disrupt function, but an S214A mutant is as active as wild-type enzyme in the hydrolysis of a tripeptide substrate (McGrath et al., 1992). However mutation of this residue in thrombin, a closely related serine protease, does lead to increased Km values for various substrates (Krem et al., 2002). The proximity of this residue to the active site and the degree of conservation argue that it is important in function, although the role remains to be more precisely defined. Y228 (rank 10) is found in the S1 binding pocket (Hedstrom et al., 1992), but its role is unknown.
In summary, of Discern's top 15 predicted residues, all but Y228 are known or proposed to have important roles in catalysis, substrate recognition, proenzyme activation or formation of key structural elements in chymotrypsin. Given the very high percentage of identification of important residues whose functions have been verified experimentally, the Discern results suggest that mutagenic probing of Y228 in particular might be illuminating, and that Discern can be generally useful in guiding experimental approaches to mechanistic investigations of enzymes that have been much less studied than chymotrypsin.
3.2 Aspects of the Discern predictor
Discern combines three ingredients in making a prediction—the use of phylogenomic scores, information from structure and features computed at structural neighbors, and a statistical regularization to control for overfitting. To investigate the relative importance of these three aspects of the predictor, we conducted a set of experiments in which subsets of these aspects were used. The results are shown in Table 1. We see that a performance gain is obtained by including phylogenomic scores. However, a decrease in performance is seen when structural neighborhood features are also included but the model is not regularized. This is presumably due to overfitting. Indeed, when the model is regularized, a significant performance gain is observed.
Table 1.
Comparison of Discern to simplified logistic regression models
| Method | Structural neighbors | Phylogenomic conservation scores | L1-regularization | CATRES-FAM |
|
|---|---|---|---|---|---|
| Precision50 (%) | Recall18 (%) | ||||
| Method 0 (Control) | – | – | – | 17.00 | 48 |
| Method 1 | – | Y | – | 20.45 | 55 |
| Method 2 | Y | Y | – | 16.13 | 41 |
| Discern | Y | Y | Y | 27.30 | 69 |
We compare Discern to simplified models that make use of conservation signal across the family as a whole and structural features for the residue of interest, but do not include one or more of (1) features computed for structural neighbors, (2) INTREPID phylogenomic conservation scores and (3) L1-regularization. Precision50 reports the precision at 50% recall, and Recall18 reports the recall at 18% precision (these precision and recall points were selected to allow direct comparison to the Youn et al. method). Discern provides an improvement over the control of 10.3% precision at 50% recall and an increase in recall of 21% at 18% precision. See Section S-5.3 and Figure S-6 in the Supplementary Materials for additional details on these experiments and full precision-recall curves.
We investigated quantitative aspects of the full Discern predictor after it has been fit to the CATRES dataset (Fig. 4). Among the 528 candidate features considered, 157 had non-zero weights in the final model. Examining these weights provides insight into the ability of Discern to discriminate between catalytic and non-catalytic residues. The highest weights are associated with features identified by others as highly correlated with catalytic sites (e.g. high degrees of sequence conservation across homologs, centrality in 3D structure and relative solvent accessibility), and the largest negative weights are those shown previously as anti-correlated (e.g. hydrophobicity) (Bartlett et al., 2002).
Fig. 4.

Features selected by Discern. Shown here are the 15 features with the largest weights based on fitting the logistic regression to the entire CATRES-FAM dataset. Positive weights indicate positive correlation with putative catalytic residues; negative weights imply negative correlation. The magnitude of the weight is indicative of a feature's relative importance. (A) Features computed at the residue of interest. (B) Features summed over residues that are nearby in the 3D structure. See Supplementary Figure S-7 for additional details.
A more subtle point is the fact that the Discern prediction is based on a combination of weighted features. For a residue to achieve a high rank (relative to other residues), a combination of features must be present (or absent, in the case of a feature with negative weights). For instance, while residue centrality has a strong positive weight, this alone will be insufficient to give a residue a high rank unless it is also highly conserved, polar or charged, and has some level of relative solvent accessibility.
L1-regularization constrains the total weight allocated to a set of features, with the end result that some features receive zero weight. In many cases, these features are individually informative but are effectively redundant due to other features which are given non-zero weight (i.e. included in the final model). Location in a cleft or pocket is a case in point. We found that the explicit feature of presence in a cleft or pocket is given a weight of zero in our model, which is surprising given that presence in a cleft is known to be one of the hallmarks of catalytic residues (Bartlett et al., 2002). However, residue centrality and relative solvent accessibility (features which were given positive weights) jointly encode for presence in a cleft; i.e. if a residue is both near the center of the molecule and exposed, it must be in a deep cleft. Thus, enforcing model sparsity using L1-regularization resulted in dropping the feature of presence in a cleft or pocket, but retained residue centrality and solvent accessibility which allow this defining characteristic of active site residues to be recognized.
In summary, the features selected by the regularized logistic regression jointly describe highly conserved, charged, solvent-accessible residues that are found in clefts or pockets, and whose neighbors in the 3D structure are also highly conserved.
4 DISCUSSION
In this article, we have described a new approach to the prediction of active sites in proteins. Our results on benchmark datasets of manually curated enzymes from the CSA and CATRES resources show that Discern provides a significant improvement over the best methods that make use of information from sequence and/or structure to predict catalytic sites.
Discern is a statistical predictor that brings together three important ideas, the combination of which are needed in order to obtain the striking improvements in accuracy shown here. First, Discern uses an evolutionary modeling approach (specifically, the INTREPID phylogenomic method) to infer the degree to which residues are under selective pressure. Second, we incorporate information from the structural neighborhood of a residue including features (such as sequence conservation, charge, solvent accessibility, etc.) computed for structurally proximal residues. Third, and critically, we use statistical sparsification methods (specifically, L1-regularization) to cope with the fact that our statistical model is based on a large number of redundant, noisy features. Without such regularization, we find that our method overfits—in particular, the inclusion of information from structural neighbors leads to a decrease in accuracy. With regularization, we obtain a significant increase in accuracy. Regularization allows us to find a signal within the large set of candidate features that can be used to describe the structural and evolutionary neighborhood of an amino acid.
The parameters of the statistical model underlying Discern are the weights of various features that capture the evolutionary and structural context, computed both for the residue of interest and for its structural neighbors. The largest weights tend to be associated with features identified by others as highly correlated with catalytic sites (e.g. high degrees of sequence conservation across homologs, centrality in 3D structure and relative solvent accessibility), and the largest negative weights are those shown previously as anti-correlated (e.g. hydrophobicity). But the model is not restricted to such known features; it can create new features as linear combinations of the given features. Moreover, the model parameters act in concert: for a residue to achieve a high rank, a single feature is generally insufficient; multiple features must be present. The features selected by Discern jointly describe highly conserved, charged, solvent-accessible residues that are found in clefts or pockets, and whose neighbors in the 3D structure are also highly conserved.
While many catalytic site prediction methods exploit residue conservation as a primary source of signal (Gutteridge et al., 2003; Youn et al., 2007), most of these restrict homologs to only moderately divergent sequences, limiting the effective use of this signal. In contrast, Discern makes use of the INTREPID phylogenomic conservation score (Sankararaman and Sjölander, 2008), which is able to exploit the conservation information in highly divergent datasets.
Discern is not the only method to use information from structural neighbors for catalytic residue prediction, but there are a few differences between Discern and approaches used by others that may contribute to the improved performance. In particular, several methods use spatial clustering (Aloy et al., 2001; Landgraf et al., 2001; Panchenko et al., 2004) as a post-processing step (Gutteridge et al., 2003) based on classification of individual positions independently in an initial stage. In contrast, Discern uses features from structurally neighboring residues as an integral part of the model. Closer in spirit to Discern is the method proposed by Youn et al. (2007), which uses atom-level features (Bagley and Altman, 1995) in concentric shells (weighted equally within each shell) around the Cβ atom of the residue of interest (Mooney et al., 2005). As in Discern, this yields a rich set of features describing the neighborhood. Crucially, however, Youn et al. do not enforce a penalty that enforces sparsity of parameters in their model, and the poorer performance of Youn et al. (2007) relative to Discern may reflect the kind of overfitting that we observe in Table 1.
In this work, we have evaluated Discern on two large-scale datasets: the CATRES benchmark dataset (Bartlett et al., 2002) and a homology-reduced subset of manually curated enzymes from the CSA (Porter et al., 2004). While CATRES and CSA provide important resources to benchmark the accuracy of prediction methods, finite resources (e.g. a small number of biological curators entering data into the CSA) and the inevitable lag between publication and data entry can result in not all catalytic residues being included. As our case studies show, this can result in residues that are predicted by a method as catalytic being labeled as false positives even if they are, in fact, catalytic.
Finally, our case studies suggest that Discern can be effective at identifying general types of functionally important positions (such as ligand-binding residues), and is not restricted to catalytic residue identification per se. In fact, the general approach underlying Discern is extensible and general, and can be applied to model other types of functional residues such as binding pocket specificity determinants and interaction interfaces. Each of these application areas depends only on the availability of high-quality training data, such as that provided in the CSA.
Funding: Presidential Early Career Award for Scientists and Engineers (grant number 0238311 to K.S.) from the National Science Foundation; National Science Foundation (grant number 0732065 to K.S.); National Institutes of Health (grant number HG002769 to K.S.); Department of Energy (BER KP110201 to M.I.J.); NIH/NIGMS (R01 GM071749 to M.I.J.); National Institutes of Health (grant number GM35393 to J.F.K.).
Conflict of Interest: none declared.
Supplementary Material
REFERENCES
- Aloy P, et al. Automated structure-based prediction of functional sites in proteins: applications to assessing the validity of inheriting protein function from homology in genome annotation and to protein docking. J. Mol. Biol. 2001;311:395–408. doi: 10.1006/jmbi.2001.4870. [DOI] [PubMed] [Google Scholar]
- Alterovitz R, et al. Resboost: characterizing and predicting catalytic residues in enzymes. BMC Bioinformatics. 2009;10:197. doi: 10.1186/1471-2105-10-197. [DOI] [PMC free article] [PubMed] [Google Scholar]
- Altschul S, et al. Gapped BLAST and PSI-BLAST: a new generation of protein database search programs. Nucleic Acids Res. 1997;25:3389–3402. doi: 10.1093/nar/25.17.3389. [DOI] [PMC free article] [PubMed] [Google Scholar]
- Apweiler R, et al. UniProt: the Universal Protein knowledgebase. Nucleic Acids Res. 2004;32:D115–D119. doi: 10.1093/nar/gkh131. [DOI] [PMC free article] [PubMed] [Google Scholar]
- Bagley SC, Altman RB. Characterizing the microenvironment surrounding protein sites. Protein Sci. 1995;4:622–635. doi: 10.1002/pro.5560040404. [DOI] [PMC free article] [PubMed] [Google Scholar]
- Baker D, Sali A. Protein structure prediction and structural genomics. Science. 2001;294:93–96. doi: 10.1126/science.1065659. [DOI] [PubMed] [Google Scholar]
- Bartlett GJ, et al. Analysis of catalytic residues in enzyme active sites. J. Mol. Biol. 2002;324:105–121. doi: 10.1016/s0022-2836(02)01036-7. [DOI] [PubMed] [Google Scholar]
- Bate P, Warwicker J. Enzyme/non-enzyme discrimination and prediction of enzyme active site location using charge-based methods. J. Mol. Biol. 2004;340:263–276. doi: 10.1016/j.jmb.2004.04.070. [DOI] [PubMed] [Google Scholar]
- Berna PP, et al. Residue accessibility, hydrogen bonding, and molecular recognition: metal-chelate probing of active site histidines in chymotrypsins. Biochemistry. 1997;36:6896–6905. doi: 10.1021/bi9618070. [DOI] [PubMed] [Google Scholar]
- Brady GP, Stouten PF. Fast prediction and visualization of protein binding pockets with PASS. J. Comput. Aided Mol. Des. 2000;14:383–401. doi: 10.1023/a:1008124202956. [DOI] [PubMed] [Google Scholar]
- Capra JA, Singh M. Predicting functionally important residues from sequence conservation. Bioinformatics. 2007;23:1875–1882. doi: 10.1093/bioinformatics/btm270. [DOI] [PubMed] [Google Scholar]
- Casari G, et al. A method to predict functional residues in proteins. Nat. Struct. Biol. 1995;2:171–178. doi: 10.1038/nsb0295-171. [DOI] [PubMed] [Google Scholar]
- Chandonia JM, et al. The ASTRAL Compendium in 2004. Nucleic Acids Res. 2004;32(Database issue):D189–D192. doi: 10.1093/nar/gkh034. [DOI] [PMC free article] [PubMed] [Google Scholar]
- Davis J, Goadrich M. ICML'06: Proceedings of the 23rd International Conference on Machine Learning. New York: ACM; 2006. The relationship between precision-recall and ROC curves; pp. 233–240. [Google Scholar]
- Edgar RC. MUSCLE: a multiple sequence alignment method with reduced time and space complexity. BMC Bioinformatics. 2004;5:113. doi: 10.1186/1471-2105-5-113. [DOI] [PMC free article] [PubMed] [Google Scholar]
- Elcock AH. Prediction of functionally important residues based solely on the computed energetics of protein structure. J. Mol. Biol. 2001;312:885–896. doi: 10.1006/jmbi.2001.5009. [DOI] [PubMed] [Google Scholar]
- Felsenstein J. PHYLIP (Phylogeny Inference Package) version 3.5c. Seattle: Distributed by the author. Department of Genetics, University of Washington; 1993. [Google Scholar]
- Fetrow J, Skolnick J. Method for prediction of protein function from sequence using the sequence-to-structure-to-function paradigm with application to glutaredoxins/thioredoxins and T1 ribonucleases. J. Mol. Biol. 1998;281:949–968. doi: 10.1006/jmbi.1998.1993. [DOI] [PubMed] [Google Scholar]
- Fischer JD, et al. Prediction of protein functional residues from sequence by probability density estimation. Bioinformatics. 2008;24:613–620. doi: 10.1093/bioinformatics/btm626. [DOI] [PubMed] [Google Scholar]
- Frey P, et al. A low-barrier hydrogen bond in the catalytic triad of serine proteases. Science. 1994;264:1927–1930. doi: 10.1126/science.7661899. [DOI] [PubMed] [Google Scholar]
- George RA, et al. Effective function annotation through catalytic residue conservation. Proc. Natl Acad. Sci. USA. 2005;102:12299–12304. doi: 10.1073/pnas.0504833102. [DOI] [PMC free article] [PubMed] [Google Scholar]
- Greenshtein E, Ritov Y. Persistence in high-dimensional predictor selection and the virtue of overparametrization. Bernoulli. 2004;10:971–988. [Google Scholar]
- Gutteridge A, et al. Using a neural network and spatial clustering to predict the location of active sites in enzymes. J. Mol. Biol. 2003;330:719–734. doi: 10.1016/s0022-2836(03)00515-1. [DOI] [PubMed] [Google Scholar]
- Hastie T, et al. The Elements of Statistical Learning: Data Mining, Inference, and Prediction. New York: Springer; 2001. [Google Scholar]
- Hedstrom L, et al. Converting trypsin to chymotrypsin: the role of surface loops. Science. 1992;255:1249–1253. doi: 10.1126/science.1546324. [DOI] [PubMed] [Google Scholar]
- Hedstrom L. Serine protease mechanism and specificity. Chem. Rev. 2002;102:4501–4524. doi: 10.1021/cr000033x. [DOI] [PubMed] [Google Scholar]
- Henikoff S, Henikoff JG. Amino acid substitution matrices from protein blocks. Proc. Natl Acad. Sci. USA. 1992;89:10915–10919. doi: 10.1073/pnas.89.22.10915. [DOI] [PMC free article] [PubMed] [Google Scholar]
- Hoggart CJ, et al. Simultaneous analysis of all SNPs in genome-wide and re-sequencing association studies. PLoS Genet. 2008;4:e1000130. doi: 10.1371/journal.pgen.1000130. [DOI] [PMC free article] [PubMed] [Google Scholar]
- Hosmer DW, Lemeshow S. Applied Logistic Regression. New York: John Wiley; 2000. [Google Scholar]
- Huang B, Schroeder M. LIGSITEcsc: predicting ligand binding sites using the Connolly surface and degree of conservation. BMC Struct. Biol. 2006;6:19. doi: 10.1186/1472-6807-6-19. [DOI] [PMC free article] [PubMed] [Google Scholar]
- Hubbard S, Thornton J. A computer algorithm to calculate surface accessibility. London: Department of Biochemistry and Molecular Biology, University College; 1993. [Google Scholar]
- Innis C, et al. Prediction of functional sites in proteins using conserved functional group analysis. J. Mol. Biol. 2004;337:1053–1068. doi: 10.1016/j.jmb.2004.01.053. [DOI] [PubMed] [Google Scholar]
- Kabsch W, Sander C. Dictionary of protein secondary structure: pattern recognition of hydrogen-bonded and geometrical features. Biopolymers. 1983;22:2577–2637. doi: 10.1002/bip.360221211. [DOI] [PubMed] [Google Scholar]
- Koh K, et al. An interior-point method for large-scale L1-regularized logistic regression. J. Mach. Learn. Res. 2007;8:1519–1555. [Google Scholar]
- Kraut J. Serine proteases: structure and mechanism of catalysis. Annu. Rev. Biochem. 1977;46:331–358. doi: 10.1146/annurev.bi.46.070177.001555. [DOI] [PubMed] [Google Scholar]
- Krem MM, et al. Ser214 is crucial for substrate binding to serine proteases. J. Biol. Chem. 2002;277:40260–40264. doi: 10.1074/jbc.M206173200. [DOI] [PubMed] [Google Scholar]
- Landau M, et al. ConSurf 2005: the projection of evolutionary conservation scores of residues on protein structures. Nucleic Acids Res. 2005;33(Web Server issue):W299–W302. doi: 10.1093/nar/gki370. [DOI] [PMC free article] [PubMed] [Google Scholar]
- Landgraf R, et al. Three-dimensional cluster analysis identifies interfaces and functional residue clusters in proteins. J. Mol. Biol. 2001;307:1487–1502. doi: 10.1006/jmbi.2001.4540. [DOI] [PubMed] [Google Scholar]
- Laurie AT, Jackson RM. Q-SiteFinder: an energy-based method for the prediction of protein-ligand binding sites. Bioinformatics. 2005;21:1908–1916. doi: 10.1093/bioinformatics/bti315. [DOI] [PubMed] [Google Scholar]
- Lichtarge O, et al. An evolutionary trace method defines binding surfaces common to protein families. J. Mol. Biol. 1996;257:342–358. doi: 10.1006/jmbi.1996.0167. [DOI] [PubMed] [Google Scholar]
- Lin J, Wong S.KM. A new directed divergence measure and its characterization. Int. J. Gen. Syst. 1990;17:73–81. [Google Scholar]
- Mayrose I, et al. Comparison of site-specific rate-inference methods for protein sequences: empirical Bayesian methods are superior. Mol. Biol. Evol. 2004;21:1781–1791. doi: 10.1093/molbev/msh194. [DOI] [PubMed] [Google Scholar]
- McGrath ME, et al. Perturbing the polar environment of Asp102 in trypsin: consequences of replacing conserved Ser214. Biochemistry. 1992;31:3059–3064. doi: 10.1021/bi00127a005. [DOI] [PubMed] [Google Scholar]
- Mihalek I, et al. A family of evolution-entropy hybrid methods for ranking protein residues by importance. J. Mol. Biol. 2004;336:1265–1282. doi: 10.1016/j.jmb.2003.12.078. [DOI] [PubMed] [Google Scholar]
- Mooney SD, et al. Structural characterization of proteins using residue environments. Proteins Struct. Funct. Bioinform. 2005;61:741–747. doi: 10.1002/prot.20661. [DOI] [PMC free article] [PubMed] [Google Scholar]
- Murzin AG, et al. SCOP: a structural classification of proteins database for the investigation of sequences and structures. J. Mol. Biol. 1995;247:536–540. doi: 10.1006/jmbi.1995.0159. [DOI] [PubMed] [Google Scholar]
- Ondrechen MJ, et al. THEMATICS: a simple computational predictor of enzyme function from structure. Proc. Natl Acad. Sci. USA. 2001;98:12473–12478. doi: 10.1073/pnas.211436698. [DOI] [PMC free article] [PubMed] [Google Scholar]
- Ota M, et al. Prediction of catalytic residues in enzymes based on known tertiary structure, stability profile, and sequence conservation. J. Mol. Biol. 2003;327:1053–1064. doi: 10.1016/s0022-2836(03)00207-9. [DOI] [PubMed] [Google Scholar]
- Panchenko AR, et al. Prediction of functional sites by analysis of sequence and structure conservation. Protein Sci. 2004;13:884–892. doi: 10.1110/ps.03465504. [DOI] [PMC free article] [PubMed] [Google Scholar]
- Pazos F, Sternberg MJ. Automated prediction of protein function and detection of functional sites from structure. Proc. Natl Acad. Sci. USA. 2004;101:14754–14759. doi: 10.1073/pnas.0404569101. [DOI] [PMC free article] [PubMed] [Google Scholar]
- Peters KP, et al. The automatic search for ligand binding sites in proteins of known three-dimensional structure using only geometric criteria. J. Mol. Biol. 1996;256:201–213. doi: 10.1006/jmbi.1996.0077. [DOI] [PubMed] [Google Scholar]
- Petrova N, Wu C. Prediction of catalytic residues using support vector machine with selected protein sequence and structural properties. BMC Bioinformatics. 2006;7:312. doi: 10.1186/1471-2105-7-312. [DOI] [PMC free article] [PubMed] [Google Scholar]
- Polgar L. The catalytic triad of serine peptidases. Cell. Mol. Life Sci. 2005;62:2161–2172. doi: 10.1007/s00018-005-5160-x. [DOI] [PMC free article] [PubMed] [Google Scholar]
- Porter CT, et al. The Catalytic Site Atlas: a resource of catalytic sites and residues identified in enzymes using structural data. Nucleic Acids Res. 2004;32(Database issue):D129–D133. doi: 10.1093/nar/gkh028. [DOI] [PMC free article] [PubMed] [Google Scholar]
- Richardson JS, et al. The beta bulge: a common small unit of nonrepetitive protein structure. Proc. Natl Acad. Sci. USA. 1978;75:2574–2578. doi: 10.1073/pnas.75.6.2574. [DOI] [PMC free article] [PubMed] [Google Scholar]
- Sankararaman S, Sjölander K. INTREPID–INformation-theoretic TREe traversal for Protein functional site IDentification. Bioinformatics. 2008;24:2445–2452. doi: 10.1093/bioinformatics/btn474. [DOI] [PMC free article] [PubMed] [Google Scholar]
- Segal M, et al. Regression approaches for microarray data analysis. J. Comput. Biol. 2003;10:961–980. doi: 10.1089/106652703322756177. [DOI] [PubMed] [Google Scholar]
- Shevade S, Keerthi S. A simple and efficient algorithm for gene selection using sparse logistic regression. Bioinformatics. 2003;19:2246–2253. doi: 10.1093/bioinformatics/btg308. [DOI] [PubMed] [Google Scholar]
- Tibshirani R. Regression shrinkage and selection via the lasso. J. R. Stat. Soc. B Stat. Meth. 1996;58:267–288. [Google Scholar]
- Tong W, et al. Enhanced performance in prediction of protein active sites with THEMATICS and support vector machines. Protein Sci. 2008;17:333–341. doi: 10.1110/ps.073213608. [DOI] [PMC free article] [PubMed] [Google Scholar]
- van de Geer SA. High-dimensional generalized linear models and the lasso. Ann. Stat. 2008;36:614–645. [Google Scholar]
- Vàrallyay E, et al. The role of disulfide bond C191-C220 in trypsin and chymotrypsin. Biochem. Biophys. Res. Commun. 1997;230:592–596. doi: 10.1006/bbrc.1996.6009. [DOI] [PubMed] [Google Scholar]
- Youn E, et al. Evaluation of features for catalytic residue prediction in novel folds. Protein Sci. 2007;16:216–226. doi: 10.1110/ps.062523907. [DOI] [PMC free article] [PubMed] [Google Scholar]
- Zhao P, Yu B. On model selection consistency of lasso. J. Mach. Learn. Res. 2006;7:2541–2563. [Google Scholar]
Associated Data
This section collects any data citations, data availability statements, or supplementary materials included in this article.