Abstract
Arabidopsis YELLOW VARIEGATED1 (VAR1) and VAR2 are separate loci that encode similar chloroplast FtsH proteases. To date, FtsH is the best-characterized protease in thylakoid membranes involved in the turnover of photosynthetic protein complexes. It comprises a protein family that is encoded by 12 different nuclear genes in Arabidopsis. We show here that nine FtsH proteins are located in the chloroplasts. Mutations in either VAR1 or VAR2 cause typical leaf variegation and sensitivity to photoinhibition. By contrast, none of these phenotypes was observed in T-DNA insertion mutants in other ftsH genes (ftsh1, ftsh6, and ftsh8) closely related to VAR1 and VAR2. This finding suggests that VAR1 and VAR2 play a predominant role in the photosystem II repair cycle in thylakoid membranes. By generating VAR1- and VAR2-specific antibodies, we found that loss of either VAR1 or VAR2 results in the decreased accumulation of the other. Thus, the genetic nonredundancy between VAR1 and VAR2 could be attributed to their coordinated regulation at the protein level. These observations led us to examine whether VAR1 and VAR2 form a complex. Sucrose density gradient and gel filtration analyses revealed a complex of ∼400 to 450 kD, probably representing a hexamer. Furthermore, VAR1 and VAR2 were shown to coprecipitate by immunoprecipitation using VAR1- and VAR2-specific antibodies. The majority of VAR1 appears to exist as heterocomplexes with VAR2, whereas VAR2 may be present as homocomplexes as well. Based on these results, we conclude that VAR1 and VAR2 are the major components of an FtsH complex involved in the repair of photodamaged proteins in thylakoid membranes.
INTRODUCTION
Plastids change their morphology dramatically during plant development and in response to changes in light status (Kirk and Tilney-Bassett, 1978). For example, the differentiation of plastids into chloroplasts requires light as a signal (Chory, 1991). This is accompanied by the development of thylakoid membranes, in which multiple-subunit protein complexes are assembled and perform photosynthetic electron transport and ATP synthesis (Mullet, 1988; Wollman et al., 1999; Rochaix, 2001; Hippler et al., 2002). Subunit proteins of those complexes are encoded in the nuclear or chloroplast genome, synthesized in or transported into chloroplasts, and finally form complexes. Observations in unicellular organisms and higher plants indicate that protease activities are crucial for plastid viability and homeostasis (Adam, 2000; Adam and Clarke, 2002). Furthermore, various kinds of plastidic proteases have been identified by their homology with known prokaryotic proteases and by progress in genome projects (Adam et al., 2001; Sokolenko et al., 2002). However, their precise function in the degradation of specific chloroplast proteins remains poorly understood.
Among the different proteases in chloroplasts, FtsH is a major one in thylakoid membranes. It is an ATP-dependent metalloprotease that belongs to a AAA (ATPase associated with diverse cellular activities) protease subfamily of the large AAA+ protein family (Patel and Latterich, 1998; Neuwald et al., 1999; Ogura and Wilkinson, 2001). It contains one or two transmembrane domains at its N terminus and the conserved ATPase and protease motifs required for its catalytic activity. It exists in prokaryotes and organelles of higher eukaryotes and is involved in various biological functions (Langer, 2000). In higher plants, chloroplastic FtsH has been shown immunologically to reside in thylakoid membranes, and a corresponding Arabidopsis cDNA (FtsH1) was isolated (Lindahl et al., 1996). Subsequently, the latter's involvement in the degradation of unassembled thylakoid proteins was suggested (Ostersetzer and Adam, 1997). Later, the product of FtsH1 cDNA, when expressed as a soluble fusion protein, was shown to participate in vitro in the degradation of photodamaged D1 protein of the photosystem (PS) II reaction center (Lindahl et al., 2000). A notable observation is that, in contrast to other organisms such as yeast and humans, higher plants contain an extraordinary number of FtsH homologs (Adam et al., 2001; Ogura and Wilkinson, 2001; Sokolenko et al., 2002). This implies that a full understanding of FtsH functions in chloroplasts requires the consideration of gene redundancy.
Mutations in FtsHs have been shown to correlate with leaf variegation (Sakamoto, 2003). A genetic screen of leaf-variegated mutants in Arabidopsis identified a category of nuclear recessive mutants, yellow variegated (var1 and var2), in which chloroplast development and maintenance are impaired (Martínez-Zapater, 1993; Chen et al., 1999). The corresponding VAR1 and VAR2 loci were mapped to separate chromosomes, whereas they were shown to encode similar chloroplastic FtsHs (Chen et al., 2000; Takechi et al., 2000; Sakamoto et al., 2002). VAR1 showed partial protease and ATPase activity in vitro when expressed as a fusion protein (Sakamoto et al., 2002). The maximum yield of photochemistry in PSII measured by chlorophyll fluorescence indicated that var1 and var2 are highly sensitive to photoinhibitory light exposure, suggesting that VAR1 and VAR2 play a critical role in the photoprotection of chloroplasts. Further analysis in vivo suggested that one of the substrates for VAR2 is a photodamaged D1 protein of the PSII reaction center (Bailey et al., 2002). Degradation of the D1 protein is a key process in the repair cycle of photodamaged PSII (Aro et al., 1993; Melis, 1999), and FtsH appears to act in concert with another protease, DegP (Itzhaki et al., 1998; Haußühl et al., 2001).
The genetic identification of VAR1 and VAR2 suggested their importance. However, it also raised the question of gene redundancy. Despite the fact that VAR1 and VAR2 are highly similar, the loss of either one is not complemented by the presence of the other. In addition, other chloroplastic FtsH homologs are present, and their potential for compensation should be considered as well. In this study, we show that nine FtsH proteins, including VAR1 and VAR2, are targeted to chloroplasts, whereas three are mitochondrial. Inactivation of homologous genes that are highly related to VAR1 and VAR2 did not lead to either leaf variegation or sensitivity to high light exposure. Furthermore, we studied the possible interaction between VAR1 and VAR2 by generating antibodies that distinguish between the two. This allowed us to demonstrate that their expression is regulated coordinately at the protein level. Finally, we present evidence that VAR1 and VAR2 form a complex in thylakoid membranes. Based on these results, we propose that VAR1 and VAR2 constitute a major complex involved in protein degradation in thylakoid membranes.
RESULTS
Nine of the 12 FtsH Homologs in Arabidopsis Are Targeted to Chloroplasts
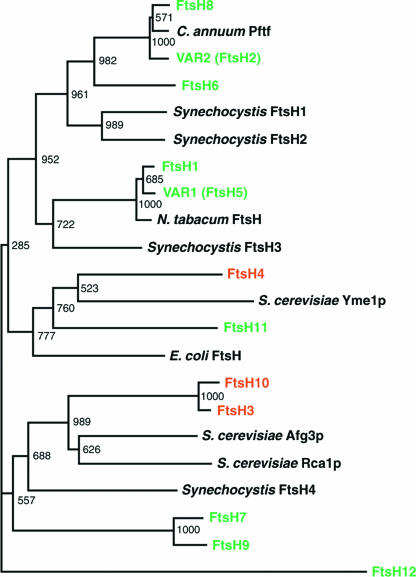
The Arabidopsis genome contains 12 genes that can encode bona-fide FtsH proteases (Sokolenko et al., 2002). As shown in Figure 1, the phylogenetic relationship between these proteins, and with other homologs, indicates that VAR1 and VAR2 are clustered with the homologous proteins FtsH1 and FtsH8, respectively (according to the proposed nomenclature, VAR1 and VAR2 correspond to FtsH5 and FtsH2, respectively; Adam et al., 2001). Together with FtsH6, they are significantly similar to other chloroplastic and cyanobacterial FtsHs, suggesting their localization in chloroplasts. However, to date, the cellular locations of only FtsH1, VAR2, and VAR1 have been verified experimentally (Lindahl et al., 1996; Chen et al., 2000; Takechi et al., 2000; Sakamoto et al., 2002). To confirm the predicted cellular location of the other FtsH homologs, we conducted an in vivo transient expression assay using a green fluorescent protein (GFP) gene and suspension-cultured tobacco cells. DNA fragments corresponding to the putative presequences and at least 10 additional amino acids from all of the potential FtsH proteins were fused in frame to the 5′ end of a GFP gene. The resulting constructs, driven by the constitutive 35S promoter of Cauliflower mosaic virus, were used for the transfection of tobacco protoplasts.
Figure 1.
Phylogenetic Tree of FtsH Proteins from Arabidopsis and Other Organisms.
The tree was constructed using the N-J method (Saitou and Nei, 1987). The bootstrap values based on 1000 replications are indicated together with the branches. Chloroplastic and mitochondrial Arabidopsis proteins whose locations were determined by the GFP transient assay (see Figure 2) are indicated in green and red, respectively. The nomenclature of Arabidopsis FtsH proteins is according to Sokolenko et al. (2002). Arabidopsis Genome Initiative numbers of FtsHs are as follows: FtsH1, At1g50250; FtsH3, At2g29080; FtsH4, At2g6140; FtsH6, At5g15250; FtsH7, At3g47060; FtsH8, At1g06430; FtsH9, At5g58870; FtsH10, At1g07510; FtsH11, At5g53170; and FtsH12, At1g79560.
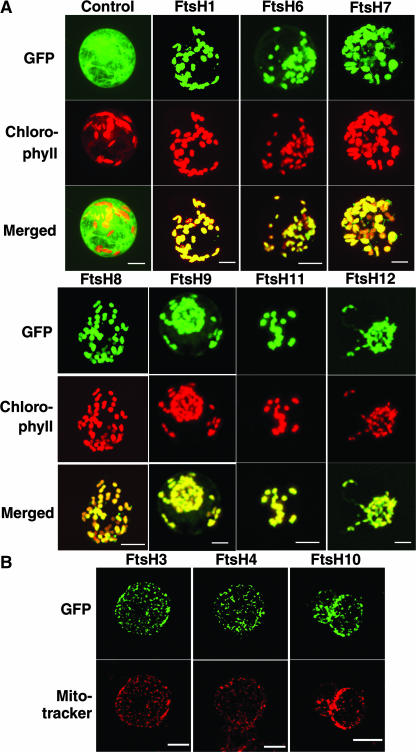
We used two different cell lines, SC and SL, to test for plastid and mitochondrial targeting, respectively. SC cells contain green chloroplasts of uniform size, so that chloroplast localization of the GFP fusions can be detected easily by comparison with chlorophyll autofluorescence. Conversely, SL cells lack green chloroplasts and therefore can be used for mitochondrial localization together with the mitochondria-specific fluorescent probe MitoTracker. When SC cells were transformed with the GFP gene fused to the presequences from FtsH1, FtsH6, FtsH7, FtsH8, FtsH9, FtsH11, and FtsH12, the green fluorescent signals colocalized with the chlorophyll autofluorescence (Figure 2A). The control GFP gene itself, without any presequence, was retained in the cytosol. These results indicated that the products of these genes were targeted exclusively to chloroplasts. Likewise, when SL cells were transformed with the GFP gene fused to the presequences from FtsH3, FtsH4, and FtsH10, the green fluorescent signals were found as granular bodies whose sizes appeared to correspond to mitochondria. Staining of the cells with MitoTracker indicated that the GFP signals indeed colocalized with mitochondria (Figure 2B). The same experiment using SC cells confirmed that FtsH3, FtsH4, and FtsH10 were not targeted to chloroplasts. We used SC and SL cells for all constructs, and the results showed that no FtsH protein was targeted dually to both chloroplasts and mitochondria (or other organelles; data not shown). Based on these findings, we conclude that nine FtsHs, including VAR1 and VAR2, are targeted to chloroplasts and three to mitochondria.
Figure 2.
Cellular Localization of the GFP Fusion Protein in Tobacco Protoplasts.
(A) SC tobacco protoplasts transformed with the GFP fusion. Genes used for the fusion constructs are indicated at top. Control indicates GFP with no targeting signal. GFP fluorescence, chlorophyll autofluorescence, and merged images are shown.
(B) SL tobacco protoplasts transformed with the GFP fusion. Genes used for the fusion constructs are indicated at top. Signals from GFP fluorescence and staining with MitoTracker are shown.
T-DNA Insertion Mutants for FtsH1, FtsH6, and FtsH8 Show No Phenotypes
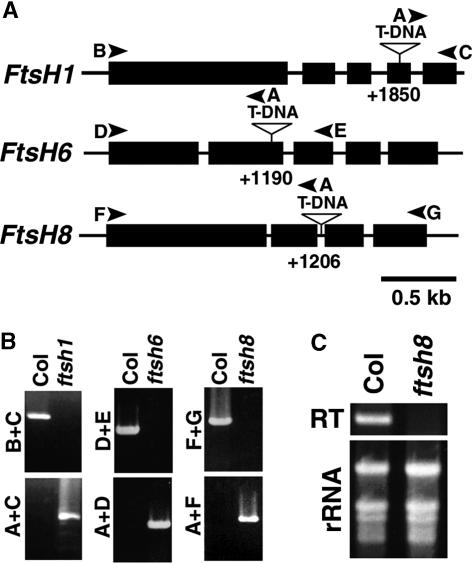
The phylogenetic study in Figure 1 showed that FtsH1, FtsH6, and FtsH8 are related closely to VAR1/VAR2. This finding prompted us to examine whether a mutation at either locus would show any phenotype similar to that of var mutants. To study this possibility, we obtained transgenic lines in which T-DNA was inserted into FtsH1, FtsH6, or FtsH8 (the mutants were designated ftsh1, ftsh6, and ftsh8, respectively). The precise positions of the T-DNA insertion were determined by PCR and subsequent sequencing, as summarized in Figure 3A. Based on the segregation of the selection marker in at least two successive generations, we obtained progeny homozygous for the T-DNA insertion. Furthermore, the T-DNA insertion was proven to be homozygous by PCR analysis, as shown in Figure 3B. In ftsh1 and ftsh6, the T-DNA was inserted in exon 4 (+1850) and exon 2 (+1190), respectively. Both insertions disrupted the coding regions and generated premature stop codons. In ftsh8, the T-DNA was inserted in intron 2 (+1206). Although this insertion did not interrupt the coding region of FtsH8, reverse transcriptase–mediated (RT) PCR analysis showed no detectable accumulation of the corresponding transcript in the mutant (Figure 3C). In addition, we isolated an independent ftsh8 line in which T-DNA was inserted in intron 1. This line showed a similar defect in FtsH8 mRNA accumulation (our unpublished data). These results suggested that none of the three T-DNA knockout mutants would accumulate the corresponding gene products.
Figure 3.
Isolation of T-DNA Insertion Lines for FtsH1, FtsH6, and FtsH8.
(A) Scheme of the genomic regions corresponding to FtsH1, FtsH6, and FtsH8. Closed boxes represent exons. The positions of T-DNA insertions in each locus are indicated by triangle-topped bars. Arrowheads indicate the positions at which the primers for PCR analyses anneal.
(B) PCR analysis of genomic DNAs from Col, ftsh1, ftsh6, and ftsh8 confirming the homozygosity of T-DNA insertion lines. Combinations of primers used for PCR analysis are indicated at left. Annealing sites of the primers are indicated in (A).
(C) Expression of FtsH8 in Col and ftsh8 studied by RT-PCR. The fragment amplified by RT-PCR and the total RNA samples stained with ethidium bromide are shown.
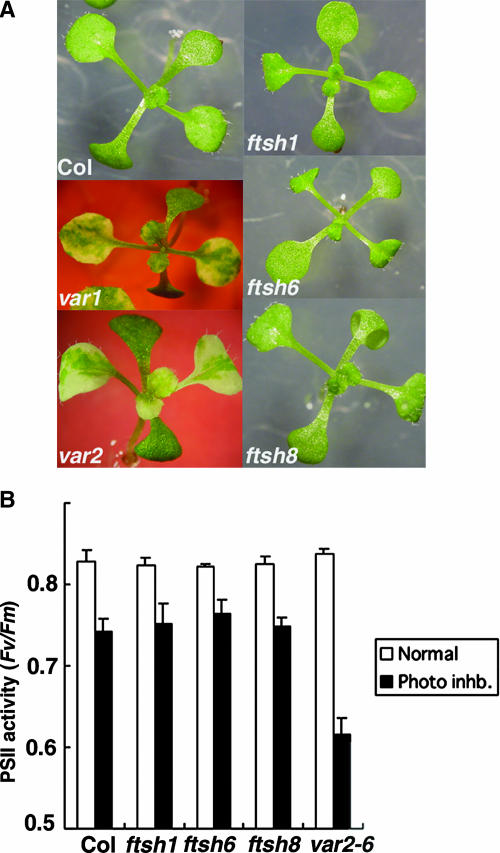
We subsequently grew these transgenic lines under normal light and temperature conditions and compared leaf morphology as well as variegation. The results (Figure 4A) showed no visible differences between wild-type and mutant plants, nor did they show any differences under different temperature and light intensity conditions (data not shown). Therefore, we concluded that although several highly similar FtsHs are present in chloroplasts, only the loss of VAR1 or VAR2 is associated with leaf variegation.
Figure 4.
Neither the Variegated Phenotype nor Enhanced Sensitivity of PSII to Photoinhibition Was Observed in ftsh1, ftsh6, or ftsh8.
(A) Photographs of Col, ftsh1, ftsh6, ftsh8, var1, and var2 seedlings.
(B) Maximum photochemical efficiency of PSII measured by chlorophyll fluorescence. The ratio of variable to maximum fluorescence (Fv/Fm) was measured in leaf discs of Col, ftsh1, ftsh6, ftsh8, and var2-6 under normal light (75 μE·m−2·s−1; open bars) and high light (800 μE·m−2·s−1 for 2 h; closed bars) conditions. Values represent means ± se of five independent measurements.
In addition to their typical variegated phenotype, var1 and var2 mutants are characterized by their lesser ability to deal with photoinhibition (Bailey et al., 2002; Sakamoto et al., 2002). To test the behavior of the other mutants in this respect, we measured the maximal photochemical efficiency of PSII as a ratio of variable to maximum fluorescence using leaf discs from ftsh1, ftsh6, and ftsh8 knockout mutants. We measured this value in green leaf tissue after exposure to normal (75 μE·m−2·s−1) or high (800 μE·m−2·s−1) light conditions for 2 h. As shown previously (Sakamoto et al., 2002), var2-6 was more sensitive than the wild type to high light exposure (Figure 4B). By contrast, the decrease in PSII activity in ftsh1, ftsh6, and ftsh8 upon photoinhibition was similar to that observed in the wild type (ecotype Columbia [Col]). It is unlikely, therefore, that FtsH1, FtsH6, or Ftsh8 is associated with the recovery from photoinhibition in vivo.
Generation of Polyclonal Antibodies That Distinguish VAR1 and VAR2
The data presented implied an important role for VAR1 and VAR2 in the recovery from photodamage relative to other related FtsH homologs. To characterize their specific functions further, we needed to distinguish between them at the protein level. Thus, we attempted to raise an antibody that specifically recognized VAR1 or VAR2. However, it is difficult to find a stretch of amino acids that distinguishes the two proteins, because they are highly similar to each other and their similarity spans the entire amino acid sequence. In fact, several attempts to raise a polyclonal antibody against synthetic polypeptides specific for VAR2 in the variable C-terminal region were unsuccessful (data not shown). Thus, we used His-tagged fusion proteins as antigens. Whereas the His-VAR2 fusion protein contained the entire amino acid sequence corresponding to mature VAR2, the His-VAR1 fusion protein lacked the 90 amino acids from the N terminus of mature VAR1 (Sakamoto et al., 2002). Both fusion proteins were expressed in Escherichia coli, purified, and injected into rabbits.
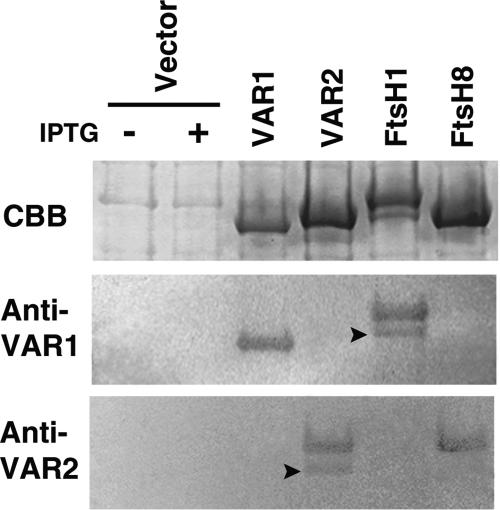
The resulting antisera (Anti-VAR1 and Anti-VAR2) were used in immunoblot analyses. As shown in Figure 5, Anti-VAR1 recognized His-VAR1 but not His-VAR2; conversely, Anti-VAR2 recognized His-VAR2 but not His-VAR1. Thus, our antibodies could distinguish between the two proteins. Cross-reaction with other chloroplast FtsH homologs also needed to be considered. In particular, VAR1 and VAR2 are highly similar to FtsH1 and FtsH8, respectively (Figure 1). To examine possible cross-reaction of the antibodies, we overexpressed His-FtsH1 and His-FtsH8 fusion proteins and reacted them with Anti-VAR1 and Anti-VAR2. Consistent with their phylogenetic relationship, Anti-VAR1 recognized FtsH1 and Anti-VAR2 recognized FtsH8 (Figure 5). Apparently, the antibodies do not cross-react with endogenous E. coli FtsH.
Figure 5.
Immunoblot Analysis of FtsH Proteins Using Anti-VAR1 and Anti-VAR2.
His-tagged VAR1, VAR2, FtsH1, and FtsH8 were expressed in E. coli as described in Methods. Total proteins of E. coli cultures were electrophoresed by SDS-PAGE, either stained with Coomassie brilliant blue (CBB) or blotted onto polyvinylidene difluoride membranes, and reacted subsequently with Anti-VAR1 or Anti-VAR2. The two left lanes show E. coli extracts containing only the cloning vector with (+) or without (−) supplemental β-d-thiogalactopyranoside (IPTG). Arrowheads indicate bands corresponding to degradation products of the overexpressed proteins.
The Catalytic Domain of VAR1 Faces the Stromal Side of Thylakoid Membranes
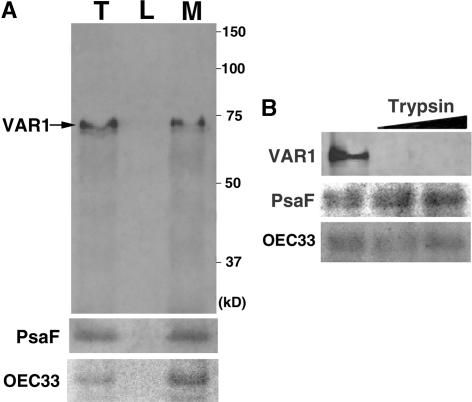
FtsH proteases, including VAR2, have been localized to thylakoid membranes, with their catalytic C-terminal region facing the stromal side of the membrane (Lindahl et al., 1996; Chen et al., 2000). To determine whether this is the case for VAR1 as well, we isolated chloroplasts by Percoll gradient centrifugation, purified intact thylakoids by osmotic disruption of the chloroplasts, and used Anti-VAR1 for immunoblot analysis. A strong signal was detected in the thylakoid fractions (Figure 6A). Its molecular mass was calculated to be ∼70 kD, consistent with the predicted mature size of VAR1. A slightly smaller band was detected nonreproducibly, presumably a degradation product of the mature VAR1 (Figure 5). The signal detected by Anti-VAR1 was found exclusively in the insoluble fraction, showing that VAR1 is located in the thylakoid membranes, as expected. In addition, VAR1 was sensitive to the trypsin digestion of intact thylakoids, as shown in Figure 6B. Anti-VAR1 recognized only the hydrophilic region at the C-terminal region, because His-VAR1 does not contain the N-terminal transmembrane domains. Control proteins (PsaF and OEC33) attached to the luminal side of the thylakoid membranes were resistant to trypsin digestion, proving the intactness of the isolated thylakoids. These results indicate that VAR1 is a thylakoid membrane protein, and like VAR2, its catalytic domain in the C-terminal region faces the stroma.
Figure 6.
Localization of VAR1 in Thylakoid Membranes and Its Topology.
(A) Immunoblot analysis of thylakoid proteins probed with Anti-VAR1 and control proteins (PsaF and OEC33). Purified thylakoids (lane T) were lysed and separated into soluble lumen (lane L) and insoluble membrane (lane M) fractions and separated by 10% SDS-PAGE. Proteins loaded in lanes L and M are derived from equal amounts of the thylakoid protein loaded in lane T. The band corresponding to VAR1 is indicated by an arrow. The positions of standard molecular marker proteins are indicated at right.
(B) VAR1 is sensitive to trypsin digestion. Purified thylakoids were incubated with two different concentrations of trypsin (slanted bar), separated by SDS-PAGE, and immunodetected by Anti-VAR1 and control antibodies against PsaF and OEC33.
The Accumulation of VAR1 and VAR2 Is Regulated Coordinately at the Protein Level
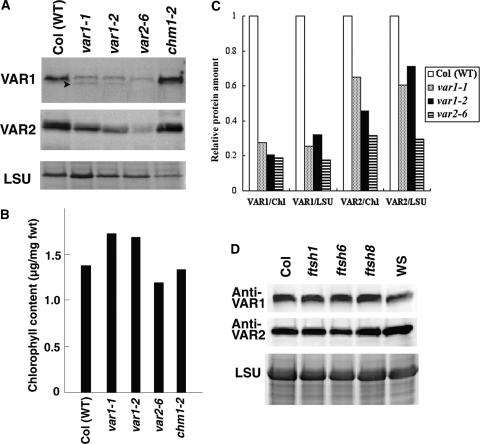
The availability of specific antibodies to VAR1 and VAR2 enabled us to examine their respective levels in variegated mutants. Equal amounts of protein extract, prepared from equal amounts of leaf tissue, were used for SDS-PAGE and immunodetection by Anti-VAR1 and Anti-VAR2. In Col, both antibodies detected a single band corresponding to 70 kD (Figure 7A). The fact that the predicted sizes of mature VAR1 and VAR2 are 68.9 and 69.2 kD, respectively, prevented us from separating these proteins by SDS-PAGE. It is essentially impossible to distinguish all other FtsH homologs on SDS–polyacrylamide gels because of their nearly identical molecular masses (W. Sakamoto and Z. Adam, unpublished data).
Figure 7.
VAR1 and VAR2 Levels in Col and Variegated Mutants.
(A) Immunoblot analysis using Anti-VAR1 and Anti-VAR2. Total proteins were isolated from wild-type Col (WT), var1-1, var1-2, var2-6, and chm1-2 plants and separated by SDS-PAGE, and duplicated filters were reacted with Anti-VAR1 or Anti-VAR2. The same samples were stained with Coomassie brilliant blue, and the bands corresponding to the large subunit of ribulose-1,5-bisphosphate carboxylase (LSU) are shown at bottom. Arrowheads indicate bands corresponding to degradation products.
(B) Chlorophyll content of the protein extracts used in (A).
(C) Quantification of the protein levels detected by Anti-VAR1 and Anti-VAR2 in Col and variegated mutants. Signals detected by immunoblot analysis (A) were normalized according to either chlorophyll content (B) (VAR1/Chl and VAR2/Chl) or LSU (VAR1/LSU and VAR2/LSU). We repeated the experiments at least five times and obtained similar results. Results of a representative experiment are shown.
(D) Immunoblot analysis of total proteins from Col, ftsh1, ftsh6, ftsh8, and Wassilewskija (WS) probed with Anti-VAR1 and Anti-VAR2. The same samples were stained with Coomassie brilliant blue, and the bands corresponding to LSU are shown at bottom.
In two var1 alleles (var1-1 and var1-2), we observed a weak signal with Anti-VAR1 (Figure 7A). Both alleles result from a nonsense mutation, generating a premature stop codon; thus, no mature VAR1 should be detected. The weak signal most likely results from cross-reaction with FtsH1, as shown for the recombinant proteins (Figure 5). Similarly, but unexpectedly, the signal detected in var2-6 (a nonsense mutation by T-DNA insertion) by Anti-VAR1 was as low as that in var1 alleles (Figure 7A). This finding could not be attributed to the variegation itself, because another variegated mutant, chm1-2, the responsible gene of which is unrelated to FtsH (Abdelnoor et al., 2003), did accumulate the VAR1 signal just like Col. Therefore, we suspected that the lack of VAR2 was accompanied by a loss of VAR1. We also examined VAR2 levels using Anti-VAR2. Similar to the results obtained with Anti-VAR1, a single band corresponding to 70 kD was detected as VAR2 in Col and chm1-2. A very weak band also was detected in var2-6. Because of the nonsense mutation in var2-6, this finding was attributed to cross-reaction with FtsH8 (for cross-reaction with recombinant proteins, see Figure 5). The signals in var1-1 and var1-2 appeared stronger than that in var2-6 but was not as strong as that in Col. This result suggested that the accumulation of VAR2 is decreased in var1 mutants, raising the possibility that the expressions of VAR1 and VAR2 are affected mutually.
Although these reduced levels of VAR1 and VAR2 are not attributable simply to leaf variegation, as shown by chm1-2, this result should be evaluated carefully for the following reason. We loaded protein on an “equal fresh weight” basis: the signals detected by Anti-VAR1 and Anti-VAR2 originated from the same amount of leaf tissue. However, variegated leaves contain chlorotic portions in which plastids appear to lack normal thylakoids; thus, thylakoid amounts may be lower in var mutants than in the wild type when equal amounts of fresh tissue are used. To account for this possibility, we normalized the signals detected by Anti-VAR1 and Anti-VAR2 using two factors related to chloroplasts. One was the band intensity corresponding to the large subunit of ribulose-1,5-bisphosphate carboxylase (LSU) calibrated by SDS-PAGE of the protein extracts (Figure 7A). The other was chlorophyll content in the protein extracts (Figure 7B). The quantification of VAR1 and VAR2 signals, normalized to these factors, is shown in Figure 7C, where the reduced accumulation of VAR1 and VAR2 in var mutants is clearly demonstrated. The VAR1 signals detected in var1-1 and var1-2 most likely represent the accumulation of FtsH1 resulting from cross-reaction. Assuming that FtsH1 accumulation was unaffected, almost no VAR1 protein was detected in var2-6. Similarly, the VAR2 signal detected in var2-6 most likely represents the accumulation of FtsH8 caused by cross-reaction. Assuming that FtsH8 accumulation was unaffected, the VAR2 accumulation in var1 mutants was decreased to 20 to 50% of that detected in Col. Finally, we isolated thylakoid membranes rather than total protein extracts and repeated the immunoblot analyses. The levels of VAR1 and VAR2 were similar to those observed in total extracts (data not shown). Thus, we conclude that the lack of either VAR1 or VAR2 results in the decreased accumulation of the other protein, suggesting that their accumulation is regulated coordinately.
No Reduced Accumulation of VAR1 or VAR2 Was Found in ftsh1, ftsh6, and ftsh8
Subsequently, we examined whether the reduction of VAR1 and VAR2 at the protein level occurred in any of the ftsh mutants. Total proteins were isolated from ftsh1, ftsh6, and ftsh8 as well as from wild-type lines and were subjected to immunoblot analysis using Anti-VAR1 and Anti-VAR2 antibodies. The results shown in Figure 7D demonstrate that the signals detected by these antibodies were indistinguishable in wild-type (Col and Wassilewskija) and mutant plants. When we normalized the signals according to LSU and chlorophyll contents, again no difference was observed (data not shown). Therefore, we conclude that the protein levels of FtsH1, FtsH6, and FtsH8 are much lower than those of VAR1 and VAR2. These results suggest that, despite the close relationship of VAR1 and VAR2 to FtsH1, FtsH6, and FtsH8, the concomitant loss of VAR1 and VAR2 is characteristic of var1 and var2 and does not occur in other ftsh mutants.
Complex Formation of VAR1 and VAR2
To test whether the decreased VAR1 and VAR2 protein accumulation in the mutants could be attributed to the decreased amount of their corresponding transcripts, we examined VAR1 and VAR2 mRNA accumulation by RNA gel blot analysis. VAR1 transcript levels were similar in Col and var2-6 plants, and VAR2 transcript levels were similar in Col, var1-1, and var1-2 plants (data not shown). Therefore, the coordinated reduction of VAR1 and VAR2 most likely occurs at the post-transcriptional level. In particular, we noticed that it resembles the degradation of unassembled subunits of photosynthetic protein complexes in chloroplasts (Wollman et al., 1999; Rochaix, 2001; Hippler et al., 2002). Given that a typical FtsH can form homooligomers in E. coli or a large heterocomplex in yeast mitochondria, it is likely that VAR1 and VAR2 also can form a complex.
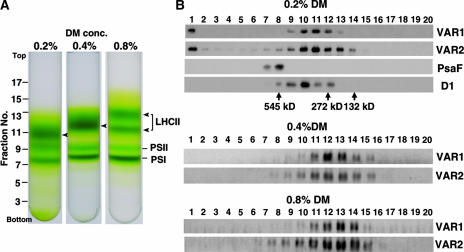
To study the possibility of complex formation, we performed sucrose density gradient analysis. Intact chloroplasts were first isolated by Percoll gradient centrifugation, thylakoid membranes then were purified, solubilized by 0.2 to 0.8% dodecylmaltoside (DM), and separated by sucrose density gradient centrifugation (Figure 8A), and fractions were collected, as described in Methods. The collected fractions were separated by SDS-PAGE and subjected to immunoblot analysis, as shown in Figure 8B. For immunodetection, we used Anti-VAR1 and Anti-VAR2, together with polyclonal antibodies against PsaF and D1 to localize PSI and PSII, respectively. We found that signals visualized by Anti-VAR1 and Anti-VAR2 always were found in the same fractions, regardless of the different solubilization conditions. The profiles of the VAR1 and VAR2 signals were affected by the concentration of DM. The peak in 0.2% DM was detected in fractions 10 and 11, and that in 0.8% DM was detected in fraction 13. In addition, we reproducibly found VAR1 and VAR2 signals in fraction 1 in 0.2% DM. Under this mild solubilization, VAR1 and VAR2 may associate with unsolubilized thylakoid fragments. The signal shift toward heavier densities with lesser DM concentrations was somewhat similar to that of LHCII (Figure 8A). Based on the migration of molecular standards, we estimated the molecular mass of fraction 10 to be ∼400 kD, which is slightly larger than that of LHCII and apparently larger than the monomer size of VAR1 or VAR2 (∼70 kD).
Figure 8.
Sucrose Density Gradient Analysis of Thylakoid Membrane Proteins.
(A) Photographs of a 0.1 to 1.3 M sucrose density gradient. From left to right, tubes containing thylakoid membranes solubilized by 0.2, 0.4, and 0.8% DM are shown. The relative positions of the fractions and LHCII, PSI, and PSII are indicated.
(B) Immunoblot analysis of the sucrose density gradient fractions. The fractions were collected from the tubes of sucrose density gradients shown in (A). Equal amounts of the fractions were subjected to SDS-PAGE and probed with Anti-VAR1 (VAR1), Anti-VAR2 (VAR2), Anti-PsaF (PsaF), and Anti-D1 (D1). The positions of molecular size markers (urease hexamer, 545 kD; urease trimer, 272 kD; BSA dimer, 132 kD) are indicated together with their molecular masses.
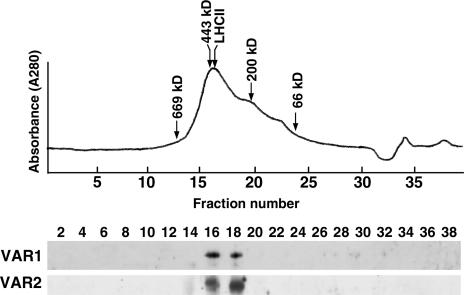
To further characterize the VAR1/VAR2 complex and estimate its size, the fraction enriched in VAR1 and VAR2 from the sucrose density gradient was subjected to gel-filtration chromatography, as described in Methods. The protein elution profile, shown in Figure 9, revealed a predominant peak at fraction 16, containing two main polypeptide bands of 25 to 30 kD, corresponding to LHCII (data not shown). The contamination of LHCII was expected because the VAR1/VAR2 fraction on the sucrose density gradient is just above the LHCII band. The fractions obtained by gel filtration were analyzed by immunoblot analysis using Anti-VAR1 and Anti-VAR2. The results (Figure 9) showed the signals for VAR1 and VAR2 in fractions 16 to 18. The apparent size of the complex was estimated at 400 to 450 kD, consistent with the result from the sucrose density gradient, further confirming the conclusion that VAR1 and VAR2 form a complex in thylakoid membranes.
Figure 9.
Gel Filtration Profile of the Thylakoid Membrane Proteins and Immunoblot Analysis.
Fraction 10 from the sucrose density gradient of thylakoid membranes (solubilized with 0.2% DM; see Figure 8B) was subjected to gel filtration using a Superose 6HR column. The elution profile measured by absorbance at 280 nm (A280) is shown at top. Fractionated eluates were subjected to immunoblot analysis with Anti-VAR1 and Anti-VAR2, as shown at bottom. Numerals above the gels indicate fraction numbers.
Coimmunoprecipitation of VAR1 and VAR2
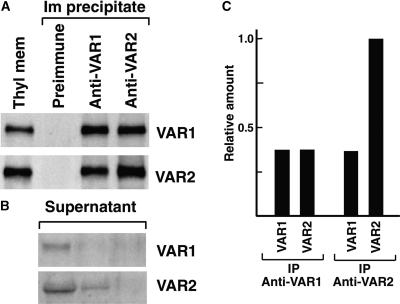
Although the identical distribution patterns of VAR1 and VAR2 shown in Figures 8 and 9 suggest heterocomplex formation, the possibility remains that the two proteins are present only as homooligomers and comigrate on sucrose density gradient and gel filtration. To prove that VAR1 and VAR2 interact directly with each other and therefore form a heterocomplex, we performed coimmunoprecipitation analysis. Thylakoid membranes were incubated with either Anti-VAR1 or Anti-VAR2 and were immunoprecipitated as described in Methods. The immunoprecipitates were subjected to immunoblot analysis. The results, as shown in Figure 10A, clearly showed that a substantial amount of VAR1 was immunoprecipitated by Anti-VAR2. Conversely, a substantial amount of VAR2 was immunoprecipitated by Anti-VAR1. These coprecipitation profiles were unaffected by different DM concentrations (data not shown).
Figure 10.
Coimmunoprecipitation of VAR1 and VAR2.
(A) Detection of VAR1 and VAR2 in the immunoprecipitates. Thylakoid membranes solubilized by 0.8% DM were incubated with preimmune serum, Anti-VAR1, or Anti-VAR2. Each immunoprecipitate (Im precipitate) was subjected to immunoblot analysis with the antibodies indicated at right. Each lane for immunoprecipitate contained one-fifth of the total immunoprecipitate from thylakoid membranes, equivalent to 5 μg of chlorophyll. A sample of thylakoid membranes equivalent to 0.75 μg of chlorophyll was loaded simultaneously (Thyl mem). We repeated the experiments at least five times and obtained similar results. Results from a representative experiment are shown.
(B) Detection of VAR1 and VAR2 in the postimmunoprecipitate supernatants. Samples of the postimmunoprecipitate supernatants by Anti-VAR1 and Anti-VAR2 were probed with the antibodies indicated at right. The signals detected were very weak compared with those in (A). We found that a large amount of albumin from antisera comigrated with VAR1 and VAR2 on SDS-PAGE and prevented efficient blotting and immunodetection.
(C) Relative amounts of VAR1 and VAR2 immunoprecipitated by Anti-VAR1 and Anti-VAR2. The signals detected by immunoblot analysis in (A) were calibrated according to a series of dilutions of the VAR1 or VAR2 fusion protein loaded simultaneously (not shown). The relative amounts of VAR1 and VAR2 proteins included in the VAR1 or VAR2 immunoprecipitate (IP) are indicated.
To estimate the relative VAR1 and VAR2 amounts in each immunoprecipitate, we calibrated the signals of the immunoblots based on the fusion protein loaded simultaneously (data not shown). This allowed us to estimate that in the isolated thylakoid membranes, the signal detected by Anti-VAR2 was approximately threefold greater than that detected by Anti-VAR1. In the Anti-VAR1 immunoprecipitate, an equal amount of VAR1 and VAR2 was retained, indicating that the two proteins interact with equal stoichiometry (Figure 10C). By contrast, the VAR1 and VAR2 levels immunoprecipitated by Anti-VAR2 were different, and the ratio of the VAR1 to VAR2 signals was ∼0.3 (Figure 10C). This was well correlated with the overall VAR1:VAR2 ratio in the thylakoid membranes, indicating that the majority of VAR1 interacts with VAR2. In addition to these findings, the difference of the VAR2 signals detected in the Anti-VAR1 or Anti-VAR2 immunoprecipitate demonstrated that the residual amount of VAR2 did not interact with VAR1. In fact, we found that VAR2 was retained in the supernatant only when immunoprecipitated with Anti-VAR1 (Figure 10B). These results, together with the coordinated protein accumulation in the var1 and var2 mutant alleles, suggest that VAR1 forms a heterocomplex with VAR2 and that VAR2 may exist as a homocomplex as well as a heterocomplex.
DISCUSSION
The FtsH Protein Family in Higher Plants
Genes that encode FtsH proteins constitute a small gene family in higher plants. In this study, we characterized the cellular location of all of the Arabidopsis FtsH homologs. In addition to the previously described FtsH1, VAR1 (FtsH5), and VAR2 (FtsH2), we identified six new chloroplast FtsH proteins: FtsH6, FtsH7, FtsH8, FtsH9, FtsH11, and FtsH12. Of the 12 FtsH proteins encoded in the Arabidopsis genome, FtsH3, FtsH4, and FtsH10 were found to be located in the mitochondria. The presence of nine and three FtsH homologs in chloroplasts and mitochondria, respectively, is consistent with the previous notion that eukaryotes contain FtsH only in these organelles (Langer, 2000). Yeast mitochondria contain two types of FtsH complexes, m-AAA and i-AAA proteases. The large complex of m-AAA is composed of Yta10p (Agf3p) and Yta12p (Rca1p) and exposes its proteolytically active C-terminal domain to the matrix (Arlt et al., 1996). The smaller complex of i-AAA, composed of Yta11p (Yme1p), is oriented oppositely, facing the intermembrane space (Leonhard et al., 1996). A mitochondrial FtsH, which is highly similar to Arabidopsis FtsH3 and FtsH10 and to yeast Yta10 and Yta12, was identified recently in pea (Kolodziejczak et al., 2002). The identification of the three mitochondrial FtsHs in Arabidopsis now allows us to study their roles in higher plants at the genetic level.
Among the organisms or organelles in which AAA proteases have been characterized, chloroplasts contain an unusually large number of FtsH homologs (Ogura and Wilkinson, 2001; Sokolenko et al., 2002). Synechocystis also contains four FtsHs (Mann et al., 2000). This may reflect the need for thylakoid membranes to repair their protein complexes as a result of damage incurred by changing environmental conditions or to remodulate their protein composition during the development of different types of plastids. It remains unknown why, among the chloroplastic FtsH homologs, only VAR1 and VAR2 are assigned a role in the recovery from photoinhibition, whereas other homologs are not. Three possibilities should be considered. First, the other homologs may have different functions, as suggested in the case of virus infection in tobacco (Seo et al., 2000). A second possibility is that they are expressed only under certain environmental conditions. A third is that they are expressed primarily in nongreen plastids. These possibilities will have to be examined in the future.
VAR1 and VAR2 Form a Complex
In this study, we demonstrated that chloroplastic FtsHs form a protein complex in thylakoid membranes, similar to FtsH homologs in membranes of other organisms. The distribution profiles of VAR1 and VAR2 were indistinguishable when characterized by sucrose density gradient centrifugation and gel filtration chromatography. In addition, coimmunoprecipitation experiments using Anti-VAR1 and Anti-VAR2 revealed that the majority of VAR1 is associated with VAR2 in DM-solubilized thylakoid membranes. These results allowed us to conclude that VAR1 and VAR2 are present as heterocomplexes with equal stoichiometry.
The apparent molecular size of the complex was estimated to be 400 to 450 kD. FtsH has been shown to exist as a homooligomer in E. coli (Akiyama et al., 1995). Based on the crystal structure of the AAA domain of the E. coli enzyme, a hexameric structure of FtsH was proposed recently (Krzywda et al., 2002). Therefore, it is suggested that the FtsH complex in chloroplasts forms hexamers. A much larger hetero-m-AAA complex (∼1000 kD), composed of the two homologous proteins Yta10p and Yta12p, has been reported in yeast mitochondria (Arlt et al., 1996). As in our observation, the complex formed by different m-AAA proteins appears to contain these proteins with equal stoichiometry (Arlt et al., 1996).
We showed that the VAR2 protein level is severalfold higher than that of VAR1 in the thylakoid membranes. It may not reflect the actual VAR1:VAR2 ratio, because Anti-VAR1 and Anti-VAR2 cross-react with FtsH1 and FtsH8, respectively. Nevertheless, it is likely that VAR2 is abundant compared with VAR1, given that their protein accumulation level is correlated with the degree of leaf variegation in the var mutants (leaf variegation is less severe in var1 than in var2). We also showed that the VAR1 and VAR2 levels immunoprecipitated by Anti-VAR2 were significantly different. This is in contrast to the 1:1 ratio observed for the Anti-VAR1 immunoprecipitate. One possible explanation for these observations is that the residual amount of VAR2 may form a homocomplex as well as a heterocomplex. Supporting this notion is the fact that almost all VAR1 proteins were immunoprecipitated by Anti-VAR2, whereas a substantial number of VAR2 proteins were not immunoprecipitated by Anti-VAR1.
If a hetero-VAR1/VAR2 complex exists, a deficiency in either VAR1 or VAR2 could lead to the selective and rapid degradation of the other component. It has been observed that multiprotein complexes involved in photosynthetic electron transport, such as PSI, PSII, and cytochrome b6f complexes, are degraded rapidly when one of the constituent subunits is missing (de Vitry et al., 1989; Sieburth et al., 1991; Takahashi et al., 1991; for review, see Wollman et al., 1999; Hippler et al., 2002). Thus, although the mechanisms of recognition of the misassembled subunits and their subsequent degradation are still unknown, the impairment of VAR1 or VAR2 accumulation in the var mutant alleles could result in the degradation of the other subunit. Such a model is consistent with the results shown in Figure 7. The coordinated regulation of VAR1 and VAR2 appears to be specific to var1 and var2 but not to ftsH1, ftsH6, and ftsH8, suggesting that VAR1 and VAR2 are the major components of the FtsH complex. However, the possibility that protein synthesis is affected simultaneously cannot be excluded completely.
Leaf Variegation and Inactivation of the FtsH Gene Family
We have shown previously that leaf variegation is caused by a defect in either VAR1 or VAR2. This genetic behavior of var1 and var2, which defines the two genes as nonredundant, can be explained by the proposed heterocomplex formation. In a first attempt to decipher the function of the different chloroplastic FtsHs, mutations in FtsH homologs that are closely related to VAR1 and VAR2 (FtsH1, FtsH6, and FtsH8) were examined in this study. Unlike var1 and var2, they showed neither leaf variegation nor increased sensitivity to photoinhibition. These results lead us to propose that VAR1 and VAR2 contribute more than other chloroplastic FtsHs to thylakoid development and to the mechanism of PSII recovery from photoinhibition.
Regarding VAR1 and VAR2 accumulation in the mutants, the results shown in Figure 7 should be approached with caution. A weak VAR1 signal was detected in var1-1 and var1-2 as well as in var2-6. Because no VAR1 is expected to be present in the var1 mutants, the signals in these mutants could come from the cross-reaction of Anti-VAR1 with FtsH1. On the other hand, the VAR2 signals in var1-1 and var1-2 were substantially stronger than that in var2-6. Thus, it can be concluded that the var1 mutants still accumulate 20 to 50% of VAR2 compared with Col. This finding may be explained by our hypothesis that only VAR2 forms homocomplexes as well as heterocomplexes. It indicates that a small portion of VAR2 is not subjected to degradation and is functional. Because the homocomplex of VAR2 is stable and functionally competent in the absence of VAR1, a residual amount of VAR2 can accumulate and variegation is partially prevented in var1. The involvement of the other chloroplastic FtsHs in these complexes is unclear at present and needs to be investigated further.
FtsH-like proteases degrade various proteins and are involved in diverse cellular functions. For example, loss of an m-AAA protease in human mitochondria has been shown to cause a severe illness (Casari et al., 1998). The deletion of ftsH is lethal in E. coli (Tomoyasu et al., 1993) and causes a severe growth defect in Bacillus subtilis (Deuerling et al., 1997). Similarly, leaf variegation appears as a typical phenotype of FtsH deficiency in higher plants (Sakamoto, 2003). The loss of VAR1 or VAR2 is accompanied by a decline in PSII activity when plants are exposed to high light (Bailey et al., 2002; Sakamoto et al., 2002). In particular, one of the main substrates in PSII appears to be a photodamaged D1 protein of the PSII reaction center, although it is unknown how the protease recognizes the damaged D1 protein. A systematic analysis of FtsH gene expression using a microarray indicated that FtsH genes respond differentially to changes in environmental conditions (Z. Adam, unpublished data). Thus, it is possible that different FtsH homologs play different roles under different environmental conditions. The knockout mutants described here will provide a useful tool with which to examine this hypothesis.
METHODS
Plant Material
All wild-type and mutant Arabidopsis thaliana plants were in the ecotype Columbia (Col) background, with the exception of the ftsh1 mutant, which was in the Wassilewskija background. Plants were grown either in soil or on 0.7% (w/v) agar plates containing MS medium (Murashige and Skoog, 1962) supplemented with 1.5% (w/v) sucrose. Unless stated otherwise, the plants were grown at 22°C with 12 h of illumination at 75 μE·m−2·s−1. A T-DNA insertion line for FtsH1 (designated ftsh1) was obtained by screening a T-DNA insertion library at the Arabidopsis Knockout Facility (University of Wisconsin, Madison). T-DNA insertion lines for FtsH6 and FtsH8 (designated ftsh6 and ftsh8) were obtained from the Syngenta Arabidopsis Insertion Library (Torrey Mesa Research Institute, San Diego, CA). The DNA fragments around the sites of T-DNA insertion in each line were obtained by PCR, using a primer annealing at the T-DNA border and a gene-specific primer as described previously (Weigel et al., 2000; McElver et al., 2001). The amplified fragments were cloned into the plasmid vector pGEM-T (Promega, Madison, WI), and the precise position of the T-DNA insertion was determined by sequencing. The original seeds from the resource centers were germinated in soil, and transformants were selected by Basta resistance (a selectable marker in the T-DNA region). Basta-resistant plants were selfed, and the progeny were subjected to DNA extraction and PCR analysis. We selected plants homozygous for T-DNA insertion based on the PCR analysis, as described in Figure 3. Measurements of chlorophyll fluorescence and the ratio of variable to maximum fluorescence were conducted using a portable fluorometer (Plant Efficiency Analyzer; Hansatech, Northfolk, UK), essentially as described previously (Sakamoto et al., 2002).
FtsH Homologs and GFP Transient Assay
To predict N-terminal targeting signals of chloroplast and mitochondrial proteins, we analyzed the first 130 amino acid residues from each protein sequence using the TargetP program (http://www.cbs.dtu.dk/services/TargetP/). DNA sequences corresponding to putative transit peptides and an additional 10 amino acids were amplified by PCR for each FtsH gene and fused in frame into the expression vector p35S-sGFP, as described previously (Sakamoto et al., 2002). For the GFP transient expression assay, we used two suspension-cultured tobacco (Nicotiana tabacum cv Samsun) cell lines, nonchlorophyllic SL and chlorophyllic SC, as described previously (Sakamoto et al., 2000). The suspension-cultured cells (2 g) were collected at mid-log phase and suspended in enzyme solution (0.4 M mannitol, 5 mM EGTA, 0.1% [w/v] Cellulase Onozuka [Yakult, Tokyo, Japan], and 0.05% [w/v] Pectolyase Y-23 [Seikagaku Kogyo, Tokyo, Japan]). After incubation at 30°C for 1 h, cells were collected by centrifugation at 100g for 10 min, washed twice in solution A (0.4 M mannitol, 70 mM CaCl2, and 2.5 mM Mes, pH 5.8), and suspended in ice-cold MaMg solution (0.4 M mannitol, 15 mM MgCl2, and 5 mM Mes, pH 5.8). The cell suspension (100 μL) was mixed with 10 μg of the plasmid, 5 μg of salmon sperm DNA, and 100 μL of PEG solution [0.4 M mannitol, 1 M Ca(NO3)2, and 40% (w/v) polyethylene glycol 6000], followed by incubation on ice for 30 min. The suspension was diluted in dilution solution (0.4 M mannitol, 125 mM CaCl2, 5 mM KCl, and 5 mM glucose), washed, and suspended in MS medium containing 0.4 M mannitol. The suspended cells were incubated overnight at 23°C with gentle agitation. The cells with GFP signals were examined using a confocal laser scanning microscope (LSM510; Carl Zeiss, Jena, Germany). To observe signals from GFP and chlorophyll fluorescence in SC cells, samples were examined with virtually no fixation. To observe signals from GFP in SL cells, samples were treated with 500 nM MitoTracker Red CMXRos (Molecular Probes, Eugene, OR) in MS medium containing 0.4 M mannitol.
Fusion Protein Analysis and Antibodies
cDNAs corresponding to the mature proteins of VAR1, VAR2, FtsH1, and FtsH8 were isolated by reverse transcriptase–mediated (RT) PCR. Based on the Arabidopsis genomic sequence information, we designed primers for each gene, and RT-PCR was performed as described (Sakamoto et al., 1996). The amplified cDNAs were inserted in frame into the expression vector pCR T7/NT-TOPO (Invitrogen, Carlsbad, CA) such that the His tag was fused at the N-terminal end. The resulting plasmids were transformed into Escherichia coli strain BL21-CodonPlus(DE)-RIL (Stratagene). Expression of the His-VAR1 fusion protein was performed as described previously (Sakamoto et al., 2002). The fusion protein was induced by adding β-d-thiogalactopyranoside to a final concentration of 1 mM for 2 h at 30°C. Total cell lysates were electrophoresed by 10% SDS-PAGE and purified from the gel by excising the band corresponding to the fusion protein using Centrilutor (Millipore, Bedford, MA). The purified proteins were injected into rabbits to raise polyclonal antibodies. Antibodies against PsaF (Chlamydomonas reinhardtii) and OEC33 (spinach; a kind gift from Yasusi Yamamoto, Okayama University) were used as controls.
Protein Extraction and Immunoblot Analysis
Total proteins were isolated from leaf tissues (50 mg) by grinding the materials in 500 μL of protein extraction buffer (20 mM Hepes-KOH, pH 7.2, 5 mM EDTA, 5% [w/v] SDS, and 10 mM 2-mercaptoethanol). Samples were centrifuged at 10,000g for 5 min, and the supernatants were subjected to SDS-PAGE. The chlorophyll content of the protein samples was determined according to Porra et al. (1998). Proteins were electroblotted onto ClearBlot Membrane-P (Atto, Tokyo, Japan), and immunodetection of the protein gel blots was performed using the enhanced chemiluminescence system (Amersham Pharmacia, Piscataway, NJ). Signals were detected with a fluoroimager system (LAS1000; Fuji Film, Tokyo, Japan), and band intensity was quantified simultaneously. Chloroplasts were isolated from leaf tissues by a 40 to 80% (v/v) Percoll step gradient as described (Sakamoto et al., 2000). To obtain intact thylakoids, isolated chloroplasts were lysed osmotically by suspending the chloroplast pellets in PBS, pH 7.5, using a Teflon microhomogenizer (Wheaton, Millville, NJ), and then thylakoids were pelleted by centrifuging at 5000g for 5 min. For trypsin digestion, thylakoids equivalent to 6 μg of chlorophyll were suspended in 40 μL of PBS, and then trypsin was added to a final concentration of 6 or 12 μg/mL and incubated at 37°C for 30 min. The reaction was stopped by adding 20 μL of 3× SDS sample buffer (0.2 M Tris-HCl, pH 6.8, 7% [w/v] SDS, 15% [v/v] 2-mercaptoethanol, 30% [v/v] glycerol, and 0.25% [w/v] bromphenol blue), and samples were analyzed further by SDS-PAGE.
Sucrose Density Gradient, Gel Filtration, and Coimmunoprecipitation Analyses
Thylakoid membranes, purified by brief sonication and centrifugation of intact thylakoids, were suspended in PBS to adjust the concentration to 0.8 mg chlorophyll/mL, dodecylmaltoside (DM) was added to a final concentration of 0.2, 0.4, or 0.8% (w/v), and the thylakoid membranes were dissolved at 0°C for 30 min. They were loaded onto a 0.1 to 1.3 M linear sucrose density gradient containing 50 mM Tris-HCl, pH 8.0, and 0.05% DM (10 mL) and centrifuged in a SW41-Ti rotor (Beckman) at 197,000g for 15 h at 4°C. Twenty fractions were collected from the gradients and characterized further by SDS-PAGE. Gel filtration column chromatography was performed using a Superose 6HR 10/30 column with a fast-protein liquid chromatography system (Amersham Pharmacia). To estimate apparent molecular weights, the Molecular Weight Marker Kit for gel-filtration chromatography (MW-GF-1000; Sigma) was used. The elution buffer contained 100 mM NaCl, 50 mM Tris-HCl, pH 8.0, and 0.05% DM. Approximately 150 μL of the sample was injected into the column, and the flow rate was 0.2 mL/min. The fraction size was 0.4 mL. For immunoprecipitation, thylakoid membranes resuspended in PBS and solubilized by 0.2 or 0.8% DM were adjusted to 0.1 mg chlorophyll/mL and incubated with antibodies for 3 h at 4°C. Subsequently, Sepharose-coupled protein A (Protein A Sepharose 4 Fast Flow; Amersham Pharmacia) was added and incubated overnight. Immunoprecipitates were sedimented by a brief centrifugation at 12,000g and washed three times with PBS containing DM. The precipitated proteins were dissociated in 1× SDS sample buffer by heating at 95°C for 5 min and subjected to SDS-PAGE.
Upon request, materials integral to the findings presented in this publication will be made available in a timely manner to all investigators on similar terms for noncommercial research purposes. To obtain materials, please contact Wataru Sakamoto, saka@rib.okayama-u.ac.jp.
Acknowledgments
We thank Shin-ichiro Ozawa for his help with gel-filtration chromatography, Satoshi Miyasako and Tetsu Hoshino for the GFP assay, and Rick Vierstra for access to the T-DNA insertion line collection. This work was supported by the Oohara Foundation and the Ministry of Agriculture, Forestry, and Fisheries of Japan in the framework of the Pioneer Research Project in Biotechnology (to W.S.) and by Grant US-3033-98 from BARD, the U.S.–Israel Binational Agricultural Research and Development Fund (to Z.A.).
Article, publication date, and citation information can be found at www.plantcell.org/cgi/doi/10.1105/tpc.017319.
References
- Abdelnoor, R.V., Yule, R., Elo, A., Christensen, A.C., Meyer-Gauen, G., and Mackenzie, S.A. (2003). Substoichiometric shifting in the plant mitochondrial genome is influenced by a gene homologous to MutS. Proc. Natl. Acad. Sci. USA 100, 5968–5973. [DOI] [PMC free article] [PubMed] [Google Scholar]
- Adam, Z. (2000). Chloroplast proteases: Possible regulators of gene expression? Biochimie 82, 647–654. [DOI] [PubMed] [Google Scholar]
- Adam, Z., Adamska, I., Nakabayashi, K., Ostersetzer, O., Haussuhl, K., Manuell, A., Zheng, B., Vallon, O., Rodermel, S.R., Shinozaki, K., and Clarke, A.K. (2001). Chloroplast and mitochondrial proteases in Arabidopsis: A proposed nomenclature. Plant Physiol. 125, 1912–1918. [DOI] [PMC free article] [PubMed] [Google Scholar]
- Adam, Z., and Clarke, A.K. (2002). Cutting edge of chloroplast proteolysis. Trends Plant Sci. 7, 451–456. [DOI] [PubMed] [Google Scholar]
- Akiyama, Y., Yoshihisa, T., and Ito, K. (1995). FtsH, a membrane-bound ATPase, forms a complex in the cytoplasmic membrane of Escherichia coli. J. Biol. Chem. 270, 23485–23490. [DOI] [PubMed] [Google Scholar]
- Arlt, H., Tauer, R., Feldmann, H., Neupert, W., and Langer, T. (1996). The YTA10-12 complex, an AAA protease with chaperone-like activity in the inner membrane of mitochondria. Cell 85, 875–885. [DOI] [PubMed] [Google Scholar]
- Aro, E.-M., Virgin, I., and Andersson, B. (1993). Photoinhibition of photosystem II: Inactivation, protein damage and turnover. Biochim. Biophys. Acta 1143, 113–134. [DOI] [PubMed] [Google Scholar]
- Bailey, S., Thompson, E., Nixon, P.J., Horton, P., Mullineaux, C.W., Robinson, C., and Mann, N.H. (2002). A critical role for the Var2 FtsH homologue of Arabidopsis thaliana in the photosystem II repair cycle in vivo. J. Biol. Chem. 277, 2006–2011. [DOI] [PubMed] [Google Scholar]
- Casari, G., et al. (1998). Spastic paraplegia and OXPHOS impairment caused by mutations in paraplegin, a nuclear-encoded mitochondrial metalloprotease. Cell 93, 973–983. [DOI] [PubMed] [Google Scholar]
- Chen, M., Choi, Y.D., Voytas, D., and Rodermel, S. (2000). Mutations in the Arabidopsis VAR2 locus cause leaf variegation due to the loss of a chloroplastic FtsH protease. Plant J. 22, 303–313. [DOI] [PubMed] [Google Scholar]
- Chen, M., Jensen, M., and Rodermel, S. (1999). The yellow variegated mutant of Arabidopsis is plastid autonomous and delayed in chloroplast biogenesis. J. Hered. 90, 207–214. [DOI] [PubMed] [Google Scholar]
- Chory, J. (1991). Light signals in leaf and chloroplast development: Photoreceptors and downstream responses in search of a transduction pathway. New Biol. 3, 538–548. [PubMed] [Google Scholar]
- Deuerling, E., Mogk, A., Richter, C., Purucker, M., and Schumann, W. (1997). The ftsH gene of Bacillus subtilis is involved in major cellular processes such as sporulation, stress adaptation and secretion. Mol. Microbiol. 23, 921–933. [DOI] [PubMed] [Google Scholar]
- de Vitry, C., Olive, J., Drapier, D., Recouvreur, M., and Wollman, F.-A. (1989). Posttranslational events leading to the assembly of photosystem II protein complex: A study using photosynthesis mutants from Chlamydomonas reinhardtii. J. Cell Biol. 109, 991–1006. [DOI] [PMC free article] [PubMed] [Google Scholar]
- Haußühl, K., Andersson, B., and Adamska, I. (2001). A chloroplast DegP2 protease performs the primary cleavage of the photodamaged D1 protein in plant photosystem II. EMBO J. 20, 713–722. [DOI] [PMC free article] [PubMed] [Google Scholar]
- Hippler, M., Rimbault, B., and Takahashi, Y. (2002). Photosynthetic complex assembly in Chlamydomonas reinhardtii. Protist 153, 197–220. [DOI] [PubMed] [Google Scholar]
- Itzhaki, H., Naveh, L., Lindahl, M., Cook, M., and Adam, Z. (1998). Identification and characterization of DegP, a serine protease associated with the luminal side of the thylakoid membrane. J. Biol. Chem. 273, 7094–7098. [DOI] [PubMed] [Google Scholar]
- Kirk, J.T.O., and Tilney-Bassett, R.A.E. (1978). The Plastids: Their Chemistry, Structure, Growth and Inheritance. (Amsterdam: Elsevier/North-Holland Biomedical Press).
- Kolodziejczak, M., Kolaczkowska, A., Szczesny, B., Urantowka, A., Knorpp, C., Kieleczawa, J., and Janska, H. (2002). A higher plant mitochondrial homologue of the yeast m-AAA protease: Molecular cloning, localization, and putative function. J. Biol. Chem. 277, 43792–43798. [DOI] [PubMed] [Google Scholar]
- Krzywda, S., Brzozowski, A.M., Verma, C., Karata, K., Ogura, T., and Wilkinson, A.J. (2002). The crystal structure of the AAA domain of the ATP-dependent protease FtsH of Escherichia coli at 1.5 Å resolution. Structure 10, 1073–1083. [DOI] [PubMed] [Google Scholar]
- Langer, T. (2000). AAA proteases: Cellular machines for degrading membrane proteins. Trends Biochem. Sci. 25, 247–251. [DOI] [PubMed] [Google Scholar]
- Leonhard, K., Herrmann, J.M., Stuart, R.A., Mannhaupt, G., Neupert, W., and Langer, T. (1996). AAA proteases with catalytic sites on opposite site membrane surfaces comprise a proteolytic system for the ATP-dependent degradation of inner membrane proteins in mitochondria. EMBO J. 15, 4218–4229. [PMC free article] [PubMed] [Google Scholar]
- Lindahl, M., Spetea, C., Hundal, T., Oppenheim, A.B., Adam, Z., and Andersson, B. (2000). The thylakoid FtsH protease plays a role in the light-induced turnover of the photosystem II D1 protein. Plant Cell 12, 419–431. [DOI] [PMC free article] [PubMed] [Google Scholar]
- Lindahl, M., Tabak, S., Cseke, L., Pichersky, E., Andersson, B., and Adam, Z. (1996). Identification, characterization, and molecular cloning of a homologue of the bacterial FtsH protease in chloroplasts of higher plants. J. Biol. Chem. 271, 29329–29334. [DOI] [PubMed] [Google Scholar]
- Mann, N.H., Novac, N., Mullineaux, C.W., Newman, J., Bailey, S., and Robinson, C. (2000). Involvement of an FtsH homologue in the assembly of functional photosystem I in the cyanobacterium Synechocystis sp. PCC 6803. FEBS Lett. 479, 72–77. [DOI] [PubMed] [Google Scholar]
- Martínez-Zapater, J.M. (1993). Genetic analysis of variegated mutants in Arabidopsis. J. Hered. 84, 138–140. [Google Scholar]
- McElver, J., et al. (2001). Insertional mutagenesis of genes required for seed development in Arabidopsis thaliana. Genetics 159, 1751–1763. [DOI] [PMC free article] [PubMed] [Google Scholar]
- Melis, A. (1999). Photosystem-II damage and repair cycle in chloroplasts: What modulates the rate of photodamage in vivo? Trends Plant Sci. 4, 130–134. [DOI] [PubMed] [Google Scholar]
- Mullet, J.E. (1988). Chloroplast development and gene expression. Annu. Rev. Plant Physiol. Plant Mol. Biol. 38, 475–502. [Google Scholar]
- Murashige, T., and Skoog, F. (1962). A revised medium for rapid growth and bioassays with tobacco tissue culture. Physiol. Plant. 15, 473–497. [Google Scholar]
- Neuwald, A.F., Aravind, L., Spouge, J.L., and Koonin, E.V. (1999). AAA+: A class of chaperone-like ATPases associated with the assembly, operation and disassembly of protein complexes. Genome Res. 9, 27–43. [PubMed] [Google Scholar]
- Ogura, T., and Wilkinson, A.J. (2001). AAA+ superfamily ATPases: Common structure-diverse function. Genes Cells 6, 575–597. [DOI] [PubMed] [Google Scholar]
- Ostersetzer, O., and Adam, Z. (1997). Light-stimulated degradation of an unassembled Rieske FeS protein by a thylakoid-bound protease: The possible role of the FtsH protease. Plant Cell 9, 957–965. [DOI] [PMC free article] [PubMed] [Google Scholar]
- Patel, S., and Latterich, N. (1998). The AAA team: Related ATPases with diverse functions. Trends Cell Biol. 8, 65–71. [PubMed] [Google Scholar]
- Porra, R.J., Thompson, W.A., and Kriedemann, P.E. (1998). Determination of accurate extinction coefficients and simultaneous equations for assaying chlorophylls a and b extracted with four different solvents: Verification of the concentration of chlorophyll standards by atomic absorption spectroscopy. Biochim. Biophys. Acta 975, 384–394. [Google Scholar]
- Rochaix, J.-D. (2001). Assembly, function, and dynamics of the photosynthetic machinery in Chlamydomonas reinhardtii. Plant Physiol. 127, 1394–1398. [PMC free article] [PubMed] [Google Scholar]
- Saitou, N., and Nei, M. (1987). The neighbor-joining method: A new method for reconstructing phylogenetic trees. Mol. Biol. Evol. 4, 406–425. [DOI] [PubMed] [Google Scholar]
- Sakamoto, W. (2003). Leaf-variegated mutations and their responsible genes in Arabidopsis thaliana. Genes Genet. Syst. 78, 1–9. [DOI] [PubMed] [Google Scholar]
- Sakamoto, W., Kondo, H., Murata, M., and Motoyoshi, F. (1996). Altered mitochondrial gene expression in a maternal distorted leaf mutant of Arabidopsis induced by chloroplast mutator. Plant Cell 8, 1377–1390. [DOI] [PMC free article] [PubMed] [Google Scholar]
- Sakamoto, W., Spielewoy, N., Bonnard, G., Murata, M., and Wintz, H. (2000). Mitochondrial localization of AtOXA1, an Arabidopsis homologue of yeast Oxa1p involved in the insertion and assembly of protein complexes in mitochondrial inner membrane. Plant Cell Physiol. 41, 1157–1163. [DOI] [PubMed] [Google Scholar]
- Sakamoto, W., Tamura, T., Hanba-Tomita, Y., Murata, M., and Sodmergen (2002). The VAR1 locus of Arabidopsis encodes a chloroplastic FtsH and is responsible for leaf variegation in the mutant alleles. Genes Cells 7, 769–780. [DOI] [PubMed] [Google Scholar]
- Seo, S., Okamoto, M., Iwai, T., Iwano, M., Fukui, K., Isogai, A., Nakajima, N., and Ohashi, Y. (2000). Reduced levels of chloroplast FtsH protein in tobacco mosaic virus–infected tobacco leaves accelerate the hypersensitive reaction. Plant Cell 12, 917–932. [DOI] [PMC free article] [PubMed] [Google Scholar]
- Sieburth, L.E., Berry-Lowe, S., and Schmidt, G.W. (1991). Chloroplast RNA stability in Chlamydomonas: Rapid degradation of psbB and psbC transcripts in two nuclear mutants. Plant Cell 3, 175–189. [DOI] [PMC free article] [PubMed] [Google Scholar]
- Sokolenko, A., Pojidaeva, E., Zinchenko, V., Panichkin, V., Glaser, V.M., Herrmann, R.G., and Shestakov, S.V. (2002). The gene complement for proteolysis in the cyanobacterium Synechocystis sp. PCC6803 and Arabidopsis thaliana chloroplasts. Curr. Genet. 41, 291–310. [DOI] [PubMed] [Google Scholar]
- Takahashi, Y., Goldschmidt-Cleamont, M., Soen, S.-Y., Franzén, L.G., and Rochaix, J.-D. (1991). Directed chloroplast transformation in Chlamydomonas reinhardtii: Insertional inactivation of the psaC gene encoding the iron sulfur protein destabilizes photosystem I. EMBO J. 10, 2033–2040. [DOI] [PMC free article] [PubMed] [Google Scholar]
- Takechi, K., Sodmergen, Murata, M., Motoyoshi, F., and Sakamoto, W. (2000). The YELLOW VARIEGATED (VAR2) locus encodes a homologue of FtsH, an ATP-dependent protease in Arabidopsis. Plant Cell Physiol. 41, 1334–1346. [DOI] [PubMed] [Google Scholar]
- Tomoyasu, T., Yuki, T., Morimura, S., Mori, H., Yamanaka, K., Niki, H., Hiraga, S., and Ogura, T. (1993). The Escherichia coli FtsH protein is a prokaryotic member of a protein family of putative ATPases involved in membrane functions, cell cycle control, and gene expression. J. Bacteriol. 175, 1344–1351. [DOI] [PMC free article] [PubMed] [Google Scholar]
- Weigel, D., et al. (2000). Activation tagging in Arabidopsis. Plant Physiol. 122, 1003–1013. [DOI] [PMC free article] [PubMed] [Google Scholar]
- Wollman, F.-A., Minai, L., and Nechushtai, R. (1999). The biogenesis and assembly of photosynthetic proteins in thylakoid membranes. Biochim. Biophys. Acta 1411, 21–85. [DOI] [PubMed] [Google Scholar]


