

Abstract
We describe an improved method of measuring brain atrophy rates from serial MRI for multi-site imaging studies of Alzheimer’s disease (AD). The method (referred to as KN-BSI) improves an existing brain atrophy measurement technique—the boundary shift integral (classic-BSI), by performing tissue-specific intensity normalization and parameter selection. We applied KN-BSI to measure brain atrophy rates of 200 normal and 141 AD subjects using baseline and 1-year MRI scans downloaded from the Alzheimer’s Disease Neuroimaging Initiative database. Baseline and repeat images were reviewed as pairs by expert raters and given quality scores. Including all image pairs, regardless of quality score, mean KN-BSI atrophy rates were 0.09% higher (95% CI 0.03% to 0.16%, p=0.007) than classic-BSI rates in controls and 0.07% higher (−0.01% to 0.16%, p=0.07) higher in ADs. The SD of the KN-BSI rates was 22% lower (15% to 29%, p<0.001) in controls and 13% lower (6% to 20%, p=0.001) in ADs, compared to classic-BSI. Using these results, the estimated sample size (needed per treatment arm) for a hypothetical trial of a treatment for AD (80% power, 5% significance to detect a 25% reduction in atrophy rate) would be reduced from 120 to 81 (a 32% reduction, 95% CI=18% to 45%, p<0.001) when using KN-BSI instead of classic-BSI. We concluded that KN-BSI offers more robust brain atrophy measurement than classic-BSI and substantially reduces sample sizes needed in clinical trials.
Keywords: Alzheimer’s disease, Atrophy, MRI, Boundary shift integral, Intensity normalization, BSI, KN-BSI
Introduction
Large multi-site clinical studies provide a powerful way to understand diseases and their treatments. In recent years, neuroimaging outcomes have increasingly been incorporated into such studies (Horn and Toga; 2009; Barkhof et al., 2009). However, information is often lacking about the robustness and variability of these outcomes in a multi-site setting. The Alzheimer’s Disease Neuroimaging Initiative (ADNI) was established partly to address this issue. ADNI included subjects from over 50 sites across the U.S. and Canada, and its aims include testing the ability of serial magnetic resonance imaging (MRI), positron emission tomography (PET), other biological and imaging markers, and clinical and neuropsychological assessments to measure progression in mild cognitive impairment (MCI) and early Alzheimer’s disease (AD) (Mueller et al., 2005).
The use of images from different sites and scanners brings particular challenges for image analysis algorithms with the potential to lose sensitivity and introduce systematic errors (Stonnington et al., 2008). Increased variability in the outcome measure leads to a corresponding loss of power to detect treatment effects. For longitudinal studies the stability of image acquisition is critical but may be compromised in several ways. For MRI, variability in the outcome may be affected by: (1) image intensity variation due to subject-specific noise, noise in the electronics, and imaging gradient non-linearities (Sled et al., 1998; Lewis and Fox; 2004), (2) variability in distortion fields due to differences in subject positioning (Jovicich et al., 2006), (3) voxel size variation due to drift in the strength of the applied read out gradient (i.e. calibration drift) (Clarkson et al., 2009), (4) imaging protocol differences between scanners and between baseline and repeat scans (due to scanner hardware and software changes during the study) (Preboske et al., 2006); and (5) differences in scanner calibration and quality control procedures (Whitwell et al., 2004). Although much effort has been put in to address these problems, e.g. intensity inhomogeneity correction (Sled et al., 1998), distortion field correction (Jovicich et al., 2006), voxel size correction based on geometric phantom (Gunter et al., 2006) or image registration (Clarkson et al., 2009), intensity and geometric distortion artifacts and contrast differences still exist in the images. These errors interact in a complex manner and affect the results from different image analysis algorithms in a large multi-site clinical study. Images are often reviewed by expert raters as part of the quality control in clinical studies, so that those with unacceptable errors or artifacts can be excluded from subsequent analysis. However, the exclusion of images (and hence subjects) decreases the statistical power of the study and, more importantly, may introduce bias if the outcome values for the excluded images differ systematically from those included.
The aim of this paper is to increase the robustness and reproducibility of brain atrophy measurement in multi-site image studies. The boundary shift integral (BSI) is a semi-automated measure of regional and global cerebral atrophy rates from serial MRI which uses intra-subject image registration to give higher precision than is typically possible with manual measures (Freeborough and Fox; 1997). The BSI has been used to assess atrophy progression in clinical trials in AD (Fox et al., 2005), and in a number of natural history studies in a range of neurological disorders, including AD (Ridha et al., 2006; Freeborough and Fox; 1997), frontotemporal dementia (Chan et al., 2001), multiple sclerosis (Anderson et al., 2007) and Huntington’s disease (Henley et al., 2006). The BSI estimates the changes in cerebral volume using differences in voxel intensities between two serial MRI volume scans at the boundary region of the brain. In order to accurately measure brain atrophy using BSI, the intensity of the same tissue in the baseline and repeat scans should be as similar as possible. The classic BSI technique employs intensity normalization between baseline and repeat images by dividing the intensity on each scan by the mean intensity of the interior region of the brain (consisting mainly of white matter). Where there is the possibility of tissue contrast changes over time this is not an ideal approach because it does not take into account the intensity changes of individual tissue types in the brain, namely cerebrospinal fluid (CSF), gray matter (GM) and white matter (WM), relative to each other. Furthermore, an intensity window parameter must be chosen in the calculation of BSI, in order to correctly capture the intensity transitions associated with the brain boundary. The optimal value is largely dependent on the signal-to-noise ratio (SNR) and the image intensity of CSF and GM. Existing protocols make use of a single BSI intensity window for all the images from all the imaging sites; however different images acquired from different sites may have different tissue contrasts and SNRs with different optimal BSI intensity windows. Ideally the choice of that optimal window should be automated and unbiased, and based upon the intrinsic tissue contrast and SNR in the image pairs of a particular subject produced by a particular scanner and acquisition protocol.
Few papers have explicitly addressed the problems of MR image intensity normalization and standardization. Nyúl and Udupa used a two-step approach to standardize MR image intensity to a standard intensity scale, so that specific tissue types have a similar intensity (Nyúl and Udupa; 1999). The first step (‘training step’) involved finding the parameters of the standardizing transform from a set of images. The second step (‘transformation step’) applied the learnt parameters to transform the intensity of a new image into the standardized histogram. Madabhushi and Udupa later used scale-space concepts to accurately identify principal regions used for the training step (Madabhushi and Udupa; 2006). Christensen reported the use of even-ordered derivatives of the image histogram to determine a single global scaling factor between two images (Christensen; 2003). The model of a single global scaling factor is the same as the model of intensity normalization in the classic-BSI. Weisenfeld and Warfield proposed the use of Kullback-Leibler divergence to match the intensity distribution of two images (Weisenfeld and Warfield; 2004). Since disease progression in AD will cause changes in the histogram model (changes in the relative heights and spread of the CSF/GM/WM peaks) in the repeat image, the methods proposed by Weisenfeld and Warfield may introduce bias in the BSI.
Many image processing algorithms have a set of customizable parameters to allow the users to adapt the algorithms to specific problems (e.g. biological and image quality variability) (Fennema-Notestine et al., 2006; Popovic et al., 2006). However, in a clinical trial setting, it is desirable that the image analysis is standardized (in terms of procedures and parameters), repeatable and reproducible (in terms of small intra-rater and inter-rater variabilities) (Schuster; 2007), and increasingly, regulations require that the procedure for choosing parameters be defined in advance for the trial.
In this paper, we describe two improvements for the BSI that address differences in tissue contrast and SNR over time and between scanners, namely robust intensity normalization and automatic parameter selection based on the intrinsic tissue contrast of the MR images. The aim thereby was to increase the robustness and reproducibility of the BSI in multi-site image studies. We used the large ADNI dataset to assess whether, and by how much, these modifications may reduce variability in measurements of atrophy rates and consequently reduce estimated sample sizes for a randomized trial of a putative disease-modification therapy for AD.
Methods and materials
In this section, we describe the image data, the method of computing BSI based on normalization using interior brain regions and manual selection of intensity window (referred to as ‘classic-BSI’), the improved method of computing BSI (referred to as ‘KN-BSI’), and the methods of comparison between classic-BSI and KN-BSI.
Image data
We applied our methods to 200 normal controls with mean (SD) age of 76.0 (5.0) years and 141 AD subjects with mean (SD) age 75.4 (7.4) years, who had both baseline and 1-year scans in 1.5T scanners on the ADNI database (www.loni.ucla.edu/ADNI). ADNI was launched in 2003 by the National Institute on Aging (NIA), the National Institute of Biomedical Imaging and Bioengineering (NIBIB), the Food and Drug Administration (FDA), private pharmaceutical companies and non-profit organizations, as a 5-year public-private partnership. Determination of sensitive and specific markers of very early AD progression is intended to aid researchers and clinicians in developing new treatments and monitoring their effectiveness, as well as lessening the time and cost of clinical trials. The principal investigator is Michael W. Weiner, M. D., VA Medical Center and University of California-San Francisco. ADNI is the result of efforts of many co-investigators and subjects have been recruited from over 50 sites across the U.S. and Canada. The initial goal of ADNI was to recruit 800 adults, aged 55 to 90 years, to participate in the research—approximately 200 cognitively normal older individuals to be followed for 3 years, 400 people with MCI to be followed for 3 years, and 200 people with early AD to be followed for 2 years. For up-to-date information, see www.adni-info.org.
Each individual was scanned with a number of sequences but for this study we only used the T1-weighted volumetric scans (one at baseline and one at one year for each individual). Representative imaging parameters were TR=2400 ms, TI=1000 ms, TE=3.5 ms, flip angle=8°, field of view=240×240 mm and 160 sagittal 1.2 mm-thick-slices and a 192×192 matrix yielding a voxel resolution of 1.25×1.25×1.2 mm, or 180 sagittal 1.2 mm-thick slices with a 256×256 matrix yielding a voxel resolution of 0.94×0.94×1.2 mm. The details of the ADNI MR imaging protocol are described by Jack et al. (2008), and listed on the ADNI website (http://www.loni.ucla.edu/ADNI/Research/Cores/). Each exam underwent a quality control evaluation at the Mayo Clinic (Rochester, MN, USA) under the supervision of Dr. Jack. Quality control included inspection of each incoming image file for protocol compliance, clinically significant medical abnormalities, and image quality. The T1-weighted volumetric scans that passed the quality control were processed using the standard ADNI image processing pipeline, which included post-acquisition correction of gradient warping (Jovicich et al., 2006), B1 non-uniformity correction (Narayana et al., 1988) depending on the scanner and coil type, intensity non-uniformity correction (Sled et al., 1998) and phantom based scaling correction (Gunter et al., 2006)—the geometric phantom scan having been acquired with each patient scan.
Classic-BSI
An overview of the classic-BSI and KN-BSI is shown in Fig. 1. The classic-BSI is calculated as follows (Freeborough and Fox; 1997):
Fig. 1.
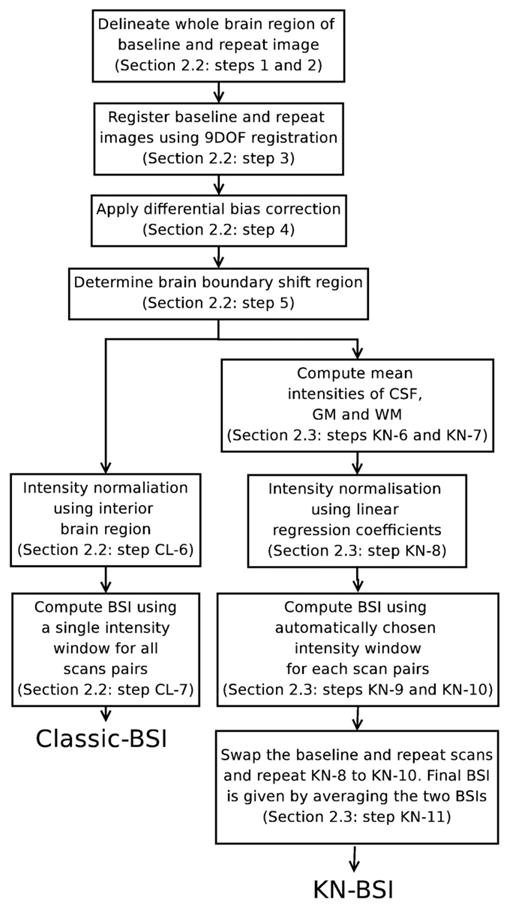
An overview of classic-BSI and KN-BSI processing pipelines. See Classic-BSI and KN-BSI sections for more details of each step.
Delineate the whole brain regions of the baseline images using a semi-automated technique based on intensity thresholding and mathematical morphology (Freeborough et al., 1997).
Delineate the whole brain regions of the repeat images by automated region propagation using the baseline brain regions of the same subject (Evans et al., 2009). The baseline images were registered to the repeat images using affine registration (to align the images globally) and nonrigid registration based on B-splines (to align the images locally) (Rueckert et al., 1999). The baseline brain regions were transformed into the repeat images using the results of the registrations.
Register the delineated baseline and repeat brain images using 9-degree-of-freedom (9DOF) registration (Clarkson et al., 2009; Woods et al., 1998).
Apply differential bias correction (DBC) to the registered baseline and repeat images using a kernel radius of 5, in order to correct for differences in intensity inhomogeneity artifacts between the two images (Lewis and Fox; 2004).
Compute the union and intersection regions of the baseline and repeat brain regions. Dilate the union region once and erode the intersection region once. The brain boundary shift region is given by the XOR (exclusive or) of the dilated union region and the eroded intersect region.
(CL-6) Normalize the intensity of baseline and repeat images by dividing by the mean intensity inside the intersect region of the baseline and repeat brain regions.
(CL-7) Compute BSI using a pre-specified manually chosen intensity window [0.45, 0.65] (Freeborough and Fox; 1997).
KN-BSI
In order to maximize the accuracy of BSI, the intensities of CSF, GM and WM need to be the same in baseline and repeat scans. We perform a linear regression using the mean intensities of CSF, GM, WM, and the interior brain region, and use the coefficients to normalize the intensity. Since our aim is to capture most of the tissue type change between CSF and GM/WM, this implies that it is desirable to ignore the tissue type change within the same tissue type, and maximize the tissue type change between different tissue types. We therefore choose the intensity window to be [ICSF mean + ICSF sd, IGM mean −IGM sd] for the T1-weighted images, where ICSF mean, ICSF sd, IGM mean and IGM sd are the mean and standard deviation of CSF intensity, and the mean and standard deviation of GM intensity. The calculation of KN-BSI is the same as classic-BSI except that steps (CL-6) and (CL-7) in the classic-BSI are replaced by the following steps:
(KN-6) Dilate the baseline and repeat brain regions by 3 voxels, to include enough voxels in CSF to estimate the mean CSF intensity.
(KN-7) Perform a k-means clustering (Hartigan and Wong; 1979) with 3 clusters (CSF, GM and WM) on the DBC-corrected baseline and repeat images inside the dilated regions.
(KN-8) Perform a linear regression between the corresponding mean intensities (CSF, GM, WM and interior brain region) in the DBC-corrected baseline and repeat images. Normalize the intensity of the two images by mapping the intensity of the repeat image to the baseline image using the results of the linear regression.
(KN-9) Calculate the intensity window [ICSF mean +ICSF sd, IGM mean −IGM sd] for each scan using the results from the k-means clustering.
(KN-10) Calculate the BSI using the intensity window and the normalized baseline and repeat scans (Freeborough and Fox; 1997). This BSI is called the ‘forward BSI’.
(KN-11) Since the linear regression is not symmetrical and may introduce bias, swap the baseline and repeat images and repeat steps (KN-8) to (KN-10) to calculate the ‘backward BSI’. The final BSI is given by ((+’forward BSI’) + (−’backward BSI’))/2.
The dilation of 3 voxels was empirically chosen by checking that the estimated mean CSF intensity from k-means clustering was similar to mean CSF intensity obtained in manually delineated CSF regions in 3 test images.
Qualitative analysis
Visual assessment of image quality is part of the quality control in our standard clinical study procedures. Expert raters assess the normalized baseline and repeat images from classic-BSI as pairs to assess the extent of image artifacts due to subject motion, image noise, geometric distortion and tissue contrast changes between the two time points. Following this, the image pairs are given quality scores from 1 to 4: 1 (no artifact), 2 (slight artifacts), 3 (some artifacts) and 4 (severe artifacts). Image pairs with quality score 4 may be recommended to be excluded from the statistical analysis in a clinical study. In this paper, we reviewed all the normalized image pairs after the image processing procedures of classic-BSI.
Quantitative analysis
We applied classic-BSI and KN-BSI to measure the brain volume changes of the normal control and AD subjects, using all the baseline and repeat images (i.e. including quality scores from 1 to 4). Annualized brain atrophy rates were calculated by dividing the brain volume changes and normalized by the baseline brain volumes and the scan intervals. We tabulated mean (SD) atrophy rates separately by quality scores (1–3 (good/acceptable), 4 (poor), and 1–4 (all)) and by subject group (control, AD). We estimated the difference in mean atrophy rates between classic-BSI and KN-BSI for each combination of subject group and quality score category, and calculated 95% confidence intervals (CIs) for the mean assuming normality of the paired differences. We used Pitman’s test to compare the variances of rates generated by the two methods, separately for each combination of subject group and quality score category. We compared the means of the rates from quality scores 1–3 scan pairs to those of quality 4 scan pairs by calculating the corresponding difference in means, and calculated 95% confidence intervals for these assuming normality and unequal variances. We calculated the differences in the means of rates using scan pairs with quality scores 1–3 to the differences in the means of rates using all scan pairs (scores 1–4), and found bias-corrected bootstrap confidence intervals (CIs) (100,000 bootstrap samples) for this difference.
We estimated sample sizes for a randomized two-arm placebo controlled clinical trial in which either classic-BSI or KN-BSI is used to calculate atrophy rates, using the standard formula: sample size=(u + v)2×(2σ2)/(Δμ)2, where u=0.841 to provide 80% power and v=1.96 to test at the 5% significance level, Δμ is the change in the annualized percentage atrophy rate between the treatment groups and σ is the SD of rates of atrophy in the treatment and placebo groups (assuming SD is the same in treatment and placebo groups) (Fox et al., 2000). We calculated sample sizes both with and without controlling for normal aging in controls.
Based on AD atrophy rates alone: sample sizes were calculated to detect a 25% reduction in atrophy rates in AD subjects (Schuff et al., 2009; Nestor et al., 2008). This implied that a 100% effective treatment could reduce atrophy to zero and is commonly used to report sample sizes in the literature and in studies using the ADNI dataset.
Controlling for normal aging: it was assumed that the difference in atrophy rates between age-matched normal controls and AD subjects represents the maximum possible treatment effect. A 25% reduction in disease progression was thus considered to be equal to 25% of this estimated difference, rather than 25% of the atrophy rates in AD subjects (Fox et al., 2000).
We calculated sample sizes using the mean and SD of atrophy rates from each method, estimated either using image pairs with quality scores 1–3 or using all image pairs, in order to investigate whether KN-BSI was more robust to image artifacts and which method produced smaller sample sizes. We found bias-corrected bootstrap CIs (100,000 bootstrap samples) for each of the estimated sample sizes, and also for the ratio of the sample size using KN-BSI to that using classic-BSI.
Statistical analyses were performed using Stata version 10 (College Station, Texas, US).
Results
Qualitative analysis
After reviewing the 341 normalized image pairs following standard image registration and intensity normalization (classic-BSI image processing procedures), 289 (120 AD, 169 controls) image pairs (85%) were found to have image quality scores 1–3, and 52 (21 AD, 31 controls) image pairs (15%) were found to have image quality score 4. The percentages of images with quality score 4 were similar in AD subjects and controls (15% AD vs 16% controls). Fig. 2 shows an example of the intensity normalization using classic-BSI and KN-BSI.
Fig. 2.

Results of intensity normalization using classic-BSI and KN-BSI. Notice the subtle change in contrast between CSF and GM/WM in the ventricles in the baseline and normalized repeat image using classic-BSI (a and b). This caused the darkening in the ventricles in the subtraction image (d). Panel e shows similar contrast between CSF and GM/WM in the baseline and normalized repeat image using KN-BSI. Panel f shows the difference between the normalized repeat images using classic-BSI and KN-BSI.
Quantitative analysis
The mean and SD of the annualized brain atrophy rates of normal controls and AD subjects using classic-BSI and KN-BSI are shown in Table 1. There was no evidence of a difference in the means of atrophy rates between classic-BSI and KN-BSI with good/adequate scans (quality scores 1–3) (p=0.48 for controls and p=0.07 for AD). Conversely, there was statistically significant evidence that the SD of the KN-BSI rates was lower than that of the classic-BSI rates, with the SD of KN-BSI rates 12% lower (95% CI 3% to 20%, p=0.0069) in controls and also 12% lower (6% to 17%, p <0.001) in ADs.
Table 1.
Brain atrophy rates using classic-BSI and KN-BSI.
| Image pairs included | Classic-BSI mean (SD) | KN-BSI mean (SD) | Classic-BSI versus KN-BSI |
||
|---|---|---|---|---|---|
| Differences in mean (classic-BSI − KN-BSI) (95% CI) | SD ratio (KN-BSI/classic-BSI) (95% CI) | ||||
| Quality scores 1–3 | Control (N=169) | 0.57% (0.60%) | 0.59% (0.53%) | −0.02% (−0.08% to 0.04%) | 0.88* (0.80 to 0.97) |
| AD (N=120) | 1.53% (0.93%) | 1.48% (0.83%) | 0.06% (−0.00% to 0.11%) | 0.88* (0.83 to 0.94) | |
| Quality score 4 | Control (N=31) | 0.08% (1.21%) | 0.58% (0.80%) | −0.50%* (−0.79% to −0.21%) | 0.66* (0.52 to 0.85) |
| AD (N=21) | 0.75% (0.97%) | 1.56% (0.96%) | −0.81%* (−1.09% to −0.53%) | 1.00 (0.75 to 1.33) | |
| Quality scores 1–4 | Control (N=200) | 0.50% (0.75%) | 0.59% (0.58%) | −0.09%* (−0.16% to −0.03%) | 0.78* (0.71 to 0.85) |
| AD (N=141) | 1.42% (0.98%) | 1.49% (0.85%) | −0.07% (−0.16% to 0.01%) | 0.87* (0.80 to 0.94) | |
Denotes statistically significant differences (p<0.05) between classic-BSI and KN-BSI.
Using image pairs with poorer quality (quality score 4), the means of atrophy rates using classic-BSI were 0.50% (95% CI 0.21% to 0.79%, p=0.002 control) and 0.81% (0.53% to 1.09%, p<0.001, AD) lower than KN-BSI. In controls the KN-BSI rates had an SD which was 34% lower (15% to 48%, p=0.002) than that for classic-BSI. In ADs there was no evidence of a difference in the SDs of the two methods (p=0.99), although the 95% confidence interval indicates that we cannot exclude the possibility of quite large differences in SDs for ADs with poor scan quality.
Including image pairs of all quality scores, the mean of the classic-BSI rates was 0.09% (0.03% to 0.16%, p=0.007) lower than the KN-BSI rates in controls and 0.07% (−0.01% to 0.16%, p=0.08) lower in ADs. There was strong evidence that the SD of the KN-BSI rates was lower than that of the classic-BSI rates, with the SD 22% lower (15% to 29%, p<0.001) in controls and 13% lower (6% to 20%, p=0.001) in ADs.
Comparing the results between image pairs with different quality scores (vertically down Table 1):
For classic-BSI: the means of atrophy rates using image pairs with poorer quality (score 4) were 0.49% (0.04% to 0.94%, p=0.03, control) and 0.78% (0.32% to 1.25%, p=0.002, AD) lower than using image pairs with quality scores 1–3. The means of atrophy rates using image pairs with quality scores 1–4 were 0.08% (0.01% to 0.15%, p=0.03, control) and 0.12% (0.05% to 0.21%, p=0.002, AD) lower than using image pairs with quality scores 1–3.
For KN-BSI: there was no evidence that the means of atrophy rates using image pairs with quality scores 1–3 differed from those using image pairs with quality score 4 in normal and AD subjects. The mean of atrophy rates using image pairs with quality score 4 was 0.01% (−0.29% to 0.31%, p=0.95, control) lower and 0.08% higher (−0.38% to 0.54%, p=0.72, AD) than using image pairs with quality scores 1–3. Similarly, the mean of atrophy rates using all image pairs (quality scores 1–4) was almost identical to (−0.04 to 0.05, p=0.95, control) and only 0.01% higher than (−0.05% to 0.08%, p=0.72, AD) using image pairs with quality scores 1–3.
The sample sizes per arm (80% power at a 5% significance level to detect 25% reduction in disease progression) calculated from the atrophy rates using classic-BSI and KN-BSI are shown in Table 2. Assuming a treatment effect which reduces the AD atrophy rate by 25%, the estimated sample size using KN-BSI was 16% (4% to 26%, p=0.005) smaller than that using classic-BSI, when image pairs with quality scores 1–3 were used. Using all images regardless of quality, the KN-BSI sample size was 32% (18% to 45%, p<0.001) lower. Assuming a treatment which reduces atrophy rate by 25% of the estimated AD-control group difference, the sample size using KN-BSI was estimated to be 8% lower (12% higher to 25% lower, p=0.39) than the classic-BSI sample size when using quality 1–3 images, whereas using images of all quality scores, the estimated reduction was 22% (2% higher to 41% lower, p=0.05).
Table 2.
Estimated sample sizes (95% CI) per arm (80% power at the 5% significance level to detect 25% reduction in disease progression) with and without controlling for normal aging using classic-BSI and KN-BSI.
| Image pairs included | Classic-BSI | KN-BSI | Sample size ratio of KN-BSI and classic-BSI (95% CI) | |
|---|---|---|---|---|
| Quality scores 1–3 | Based on AD atrophy rates alone | 94 (68 to 132) | 79 (59 to 107) | 0.84* (0.74 to 0.96) |
| Controlling for normal aging | 239 (156 to 398) | 220 (148 to 353) | 0.92 (0.75 to 1.12) | |
| Quality scores 1–4 | Based on AD atrophy rates alone | 120 (87 to 167) | 81 (62 to 107) | 0.68* (0.55 to 0.82) |
| Controlling for normal aging | 284 (183 to 480) | 223 (154 to 342) | 0.78 (0.59 to 1.02) |
Denotes statistically significant differences between classic-BSI and KN-BSI (p<0.05).
Note that the sample sizes at 90% power are given by 1.34 times the sample sizes at 80% power.
From Table 2, taking into account the 15% of image pairs with quality score 4 using classic-BSI, if only image pairs with quality scores 1–3 were to be used in an analysis, the required sample size would be increased from 94 to 111 (AD atrophy rates alone), approaching the sample size of 120 obtained when using image pairs with quality scores 1–4.
The differences in the brain atrophy rates calculated using classic-BSI and KN-BSI for each of the imaging sites are shown in Fig. 3. The largest difference in the atrophy rates between the two methods was from the images acquired in site X, which was subsequently found to have had a change of scanner (from GE to Siemens) between baseline and repeat scans. Fig. 4 shows the automatically chosen intensity windows for different scanner makes (the automatically chosen intensity window was normalized to the mean brain intensity to allow comparison with the manually chosen intensity window). This shows that the mean values of the upper and lower intensity window are different in different scanner models. No automated intensity window choices were exactly coincident with the classic-BSI parameters.
Fig. 3.
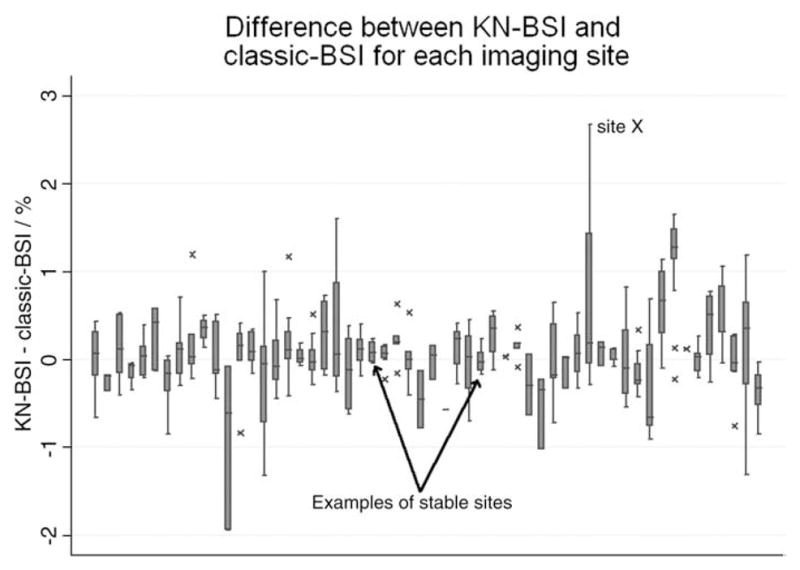
The box plot shows the difference in brain atrophy rates between classic-BSI and KN-BSI for each imaging site. The horizontal line in the box represents the median value, and the box represents the interquartile range (IQR). The whiskers represent the upper and lower adjacent values, which are the highest value not greater than 75th percentile+1.5 times IQR and the lowest value not less than 25th percentile −1.5 times IQR. Values outside the whiskers are marked as crosses.
Fig. 4.

The mean upper intensity window versus mean lower intensity window organized by the scanner make. The error bars denote the 95% confidence interval. The numbers of subjects (N) scanned at each scanner make are GE Genesis (N=31), GE Excite (N=135), GE HDx (N=7), Philips Intera (N=43), Siemens Avanto (N=30), Siemens Sonata (N=34), and Siemens Symphony (N=61). The automatically chosen intensity window has been normalized by the mean brain intensity to allow comparison with the manually chosen intensity window.
Conclusions and discussion
We have described a method of brain atrophy measurement from serial MR imaging that addresses the problem of differences in tissue contrast and SNR over time and between scanners. The method involves tissue-specific intensity normalization to improve consistency over time, and automated BSI parameters selection based on image specific brain boundary contrast to improve consistency between scanners. The method was applied to over 300 baseline and 1-year volumetric MR image pairs acquired in a large multi-site imaging study of controls and AD subjects (ADNI). The new method, KN-BSI, reduced the number of subjects required in a hypothetical multi-site clinical trial of drug treatment in AD by an estimated 32% (95% CI 18% to 45%), compared to classic-BSI. Confidence intervals are often not reported for estimates of sample sizes or their ratios, limiting interpretation and comparisons of estimates between studies.
Table 1 shows that KN-BSI is more robust to the artifacts in images with poorer or less consistent image quality (score 4) than classic-BSI. The mean atrophy rates using KN-BSI using images with any of the quality scores were very similar. However, this was not true for classic-BSI: the atrophy rates using images with poorer quality (score 4) were different to and importantly were more variable (higher SDs) than the better quality image pairs.
The quality scores inevitably involve some arbitrary judgments which may be influenced by multiple factors including, not only changes in tissue contrast, which the KN-BSI seeks to improve, but also other factors such as movement or other artifacts. The ADNI MR dataset is unique in the terms of the effort that went into protocol development and the ongoing quality control process to try to ensure that images were consistent across sites and over time (Jack et al., 2008). Despite these efforts, there were significant changes over time, which is inevitable with multi-site studies that last several years. The more variable the tissue contrast between sites and over time, the more important it will be for techniques such as KN-BSI to try to minimize these confounds. Clearly future studies will need to prioritize stability over time in terms of MR acquisition stability.
Our intensity normalization method is closely related to the work by Nyúl and Udupa (1999), which suggested that intensity in MR image could be mapped to a standardized range by using the modes in the histogram. In this work, we used k-means clustering to automatically find these modes which correspond to CSF, GM and WM, although our method is not dependent on a specific classification technique.
Tissue intensity changes may be caused by underlying neuropathology in neurodegenerative diseases. Neuropathology such as hydration state, cell content (e.g. neuron loss, gliosis) and chemistry changes the tissues at a cellular level, which will be reflected in changes in tissue intensity in MR images over the long term. This, however, is of a much lower effect than the changes that can be introduced by scanning equipment. The changes due to upgrades of scanners or differences in patient positioning may be an order of magnitude greater than those that are due to the underlying neuropathology over 1 year for neurodegenerative diseases. In particular, in Alzheimer’s disease, studies looking at T1 and T2 values (Ramani et al., 2006) found that the difference between AD patients and controls, is relatively small, but nonetheless should not be ignored. Volume changes (atrophy) will be over and above these effects, and the BSI is particularly looking at changes at the boundary between brain and CSF and as such will be less sensitive to changes in intrinsic tissue signal intensity.
We showed that the intensity window in BSI can be automatically and objectively chosen, based on the mean and standard deviation of signal intensity in different tissue classes. Although the automatically chosen intensity windows were similar to the manually chosen intensity window (Fig. 4), the figure shows that the intensity window depended on the make of the scanner and that one intensity window was not necessarily appropriate for all image pairs. The automatically chosen intensity window method therefore has the advantages of being reproducible, conceptually simple, easy to implement and not directly relying on the semi-automatically segmented brain regions or the judgment of the image analysts. It should be noted that although the automatic intensity window is chosen to capture tissue type change between CSF and GM, it will also capture the tissue type change between CSF and WM in T1-weighted images because the intensity of WM is greater than that of GM in T1-weighted images.
Reductions of up to 30% in sample size requirements would have very material and significant benefits. Clinical trials seeking to show effects on disease progression in AD (or other neurodegenerative conditions) are large, lengthy and expensive. The reduced sample size requirements may mean that trials can be better powered and/or more cost-effective allowing more treatments to be tested and fewer patients to be exposed to possible side effects. The measurement of brain atrophy rates is relevant for a number of different diseases beyond AD. KN-BSI can provide more robust and less variable brain atrophy measurement in other diseases, such as frontotemporal dementia (Chan et al., 2001), multiple sclerosis (Anderson et al., 2007) and Huntington’s disease (Henley et al., 2006). The issues related to the importance (and cost) of multi-site studies in these disorders are very similar to those encountered in trials in AD.
This study highlights the potential problems of scan acquisition changes over time. These problems may be due to operator error or scanner hardware and software changes; these are inevitable in large and lengthy multi-site clinical studies and may be very obvious or quite subtle but are nonetheless important. Furthermore, these problems extend beyond BSI and would increase the variability of the results of other image analysis algorithms or manual measurement that depend on the tissue contrast in the images. One of the strengths of this study lies in the comparison of classic-BSI and KN-BSI using a large number of images (682 images from 341 subjects) acquired on at least seven different models of scanners at multiple sites.
Interestingly, differences between the KN-BSI and classic-BSI showed wide site-specific differences with large differences implying a site had less consistent image contrast over time. The most extreme cases were images acquired at site X, which had a hardware change. This suggests that differences between the two methods may contribute to the monitoring of scanners for quality control purposes. More simply, within-subject changes in GM/WM/CSF contrast using methods such as k-means clustering could be used to help assess scanner stability or detect hardware, software or parameter changes.
In conclusion, we have demonstrated that the robustness and variability of atrophy rate measurement for large multi-site imaging studies can be improved using the KN-BSI method described in this paper. Given the increasing use of MRI outcomes in large multi-site trials, methods that can reduce the variability of these outcomes due to tissue contrast and SNR changes over time and between scanners will be increasingly valuable. However, they are not a substitute for rigorous quality control and assurance of scanners, or for attention to detail in acquiring images.
Acknowledgments
The authors would like to thank Josephine Barnes at the Dementia Research Centre, and Derek L.G. Hill and David M. Cash at IXICO for helpful discussions. We would also like to thank all the image analysts (Melanie Blair, Magda Sokolska, Elizabeth Gordon, Raivo Kittus, Laila Ahsan, Kate MacDonald) and the research associates (Casper Nielsen and Ian Malone) in the Dementia Research Centre for their help in the study. The implementation of KN-BSI uses the Insight Segmentation and Registration Toolkit (ITK), an open source software developed as an initiative of the U.S. National Library of Medicine and available at www.itk.org. Data collection and sharing for this project were funded by the Alzheimer’s Disease Neuroimaging Initiative (ADNI; Principal Investigator: Michael Weiner; NIH grant U01 AG024904). The Foundation for the National Institutes of Health (www.fnih.org) coordinates the private sector participation of the $60 million ADNI public–private partnership that was begun by the National Institute on Aging (NIA) and supported by the National Institutes of Health. To date, more than $27 million has been provided to the Foundation for NIH by Abbott, AstraZeneca AB, Bayer Schering Pharma AG, Bristol-Myers Squibb, Eisai Global Clinical Development, Elan Corporation, Genentech, GE Healthcare, GlaxoSmithKline, Innogenetics, Johnson & Johnson, Eli Lilly and Co., Merck & Co., Inc., Novartis AG, Pfizer Inc., F. Hoffmann-La Roche, Schering-Plough, Synarc Inc., and Wyeth, as well as non-profit partners the Alzheimer’s Association and the Institute for the Study of Aging. This work was undertaken at UCL/UCLH which received a proportion of funding from the Department of Health’s NIHR Biomedical Research Centres funding scheme. The Dementia Research Centre is an Alzheimer’s Research Trust Co-ordinating centre. K.K.L. and M.C. are supported by a Technology Strategy Board grant (TP1638A), N.C.F. is funded by the Medical Research Council (UK). The authors would particularly like to thank the ADNI study subjects and investigators for their participation.
Footnotes
KN-BSI is available on-line at http://bsintegral.sourceforge.net/.
References
- Anderson VM, Fernando KTM, Davies GR, Rashid W, Frost C, Fox NC, Miller DH. Cerebral atrophy measurement in clinically isolated syndromes and relapsing remitting multiple sclerosis: a comparison of registration-based methods. J Neuroimaging. 2007 Jan;17 (1):61–68. doi: 10.1111/j.1552-6569.2006.00081.x. [DOI] [PubMed] [Google Scholar]
- Barkhof F, Calabresi PA, Miller DH, Reingold SC. Imaging outcomes for neuroprotection and repair in multiple sclerosis trials. Nat Rev Neurol. 2009 May;5 (5):256–266. doi: 10.1038/nrneurol.2009.41. [DOI] [PubMed] [Google Scholar]
- Chan D, Fox NC, Jenkins R, Scahill RI, Crum WR, Rossor MN. Rates of global and regional cerebral atrophy in AD and frontotemporal dementia. Neurology. 2001 Nov;57 (10):1756–1763. doi: 10.1212/wnl.57.10.1756. [DOI] [PubMed] [Google Scholar]
- Christensen JD. Normalization of brain magnetic resonance images using histogram even-order derivative analysis. Magn Reson Imaging. 2003 Sep;21 (7):817–820. doi: 10.1016/s0730-725x(03)00102-4. [DOI] [PubMed] [Google Scholar]
- Clarkson MJ, Ourselin S, Nielsen C, Leung KK, Barnes J, Whitwell JL, Gunter JL, Hill DLG, Weiner MW, Jack CR, Fox NC Alzheimer’s Disease Neuroimaging Initiative. Comparison of phantom and registration scaling corrections using the ADNI cohort. Neuroimage. 2009 Oct;47 (4):1506–1513. doi: 10.1016/j.neuroimage.2009.05.045. [DOI] [PMC free article] [PubMed] [Google Scholar]
- Evans M, Barnes J, Nielsen C, Kim L, Clegg S, Blair M, Leung K, Douiri A, Boyes R, Ourselin S, Fox N the Alzheimer’s Disease Neuroimaging Initiative. Volume changes in Alzheimer’s disease and mild cognitive impairment: cognitive associations. Eur Radiol. 2009 Sep; doi: 10.1007/s00330-009-1581-5. http://www.springerlink.com/content/t863m0475071gk04. [DOI] [PubMed]
- Fennema-Notestine C, Ozyurt IB, Clark CP, Morris S, Bischoff-Grethe A, Bondi MW, Jernigan TL, Fischl B, Segonne F, Shattuck DW, Leahy RM, Rex DE, Toga AW, Zou KH, Brown GG. Quantitative evaluation of automated skull-stripping methods applied to contemporary and legacy images: effects of diagnosis, bias correction, and slice location. Hum Brain Mapp. 2006 Feb;27 (2):99–113. doi: 10.1002/hbm.20161. [DOI] [PMC free article] [PubMed] [Google Scholar]
- Fox NC, Black RS, Gilman S, Rossor MN, Griffith SG, Jenkins L, Koller M AN1792(QS-21)-201 Study. Effects of Aβ immunization (AN1792) on MRI measures of cerebral volume in Alzheimer disease. Neurology. 2005 May;64 (9):1563–1572. doi: 10.1212/01.WNL.0000159743.08996.99. [DOI] [PubMed] [Google Scholar]
- Fox NC, Cousens S, Scahill R, Harvey RJ, Rossor MN. Using serial registered brain magnetic resonance imaging to measure disease progression in Alzheimer disease: power calculations and estimates of sample size to detect treatment effects. Arch Neurol. 2000 Mar;57 (3):339–344. doi: 10.1001/archneur.57.3.339. [DOI] [PubMed] [Google Scholar]
- Freeborough P, Fox N. The boundary shift integral: an accurate and robust measure of cerebral volume changes from registered repeat MRI. IEEE Trans Med Imaging. 1997;16 (5):623–629. doi: 10.1109/42.640753. [DOI] [PubMed] [Google Scholar]
- Freeborough PA, Fox NC, Kitney RI. Interactive algorithms for the segmentation and quantitation of 3-D MRI brain scans. Comput Methods Programs Biomed. 1997 May;53 (1):15–25. doi: 10.1016/s0169-2607(97)01803-8. [DOI] [PubMed] [Google Scholar]
- Gunter JL, Bernstein MA, Borowski BJ, Felmlee JP, Blezek DJ, Mallozzi RP, Levy JR, Schuff N, Jack CR. Validation Testing of the MRI Calibration Phantom for the Alzheimer’s Disease Neuroimaging Initiative Study. ISMRM; 2006. p. 2652. [Google Scholar]
- Hartigan JA, Wong MA. Algorithm AS 136: a k-means clustering algorithm. J R Stat Soc Ser C (Appl Stat) 1979;28 (1):100–108. [Google Scholar]
- Henley SMD, Frost C, MacManus DG, Warner TT, Fox NC, Tabrizi SJ. Increased rate of whole-brain atrophy over 6 months in early Huntington disease. Neurology. 2006 Aug;67 (4):694–696. doi: 10.1212/01.wnl.0000230149.36635.c8. [DOI] [PubMed] [Google Scholar]
- Horn JDV, Toga AW. Multisite neuroimaging trials. Curr Opin Neurol. 2009 Aug;22 (4):370–378. doi: 10.1097/WCO.0b013e32832d92de. [DOI] [PMC free article] [PubMed] [Google Scholar]
- Jack CR, Bernstein MA, Fox NC, Thompson P, Alexander G, Harvey D, Borowski B, Britson PJ, Whitwell JL, Ward C, Dale AM, Felmlee JP, Gunter JL, Hill DLG, Killiany R, Schuff N, Fox-Bosetti S, Lin C, Studholme C, DeCarli CS, Krueger G, Ward HA, Metzger GJ, Scott KT, Mallozzi R, Blezek D, Levy J, Debbins JP, Fleisher AS, Albert M, Green R, Bartzokis G, Glover G, Mugler J, Weiner MW. The Alzheimer’s Disease Neuroimaging Initiative (ADNI): MRI methods. J Magn Reson Imaging. 2008 Apr;27 (4):685–691. doi: 10.1002/jmri.21049. [DOI] [PMC free article] [PubMed] [Google Scholar]
- Jovicich J, Czanner S, Greve D, Haley E, van der Kouwe A, Gollub R, Kennedy D, Schmitt F, Brown G, Macfall J, Fischl B, Dale A. Reliability in multi-site structural MRI studies: effects of gradient non-linearity correction on phantom and human data. Neuroimage. 2006 Apr;30 (2):436–443. doi: 10.1016/j.neuroimage.2005.09.046. [DOI] [PubMed] [Google Scholar]
- Lewis EB, Fox NC. Correction of differential intensity inhomogeneity in longitudinal MR images. Neuroimage. 2004 Sep;23 (1):75–83. doi: 10.1016/j.neuroimage.2004.04.030. [DOI] [PubMed] [Google Scholar]
- Madabhushi A, Udupa JK. New methods of MR image intensity standardization via generalized scale. Med Phys. 2006 Sep;33 (9):3426–3434. doi: 10.1118/1.2335487. [DOI] [PubMed] [Google Scholar]
- Mueller SG, Weiner MW, Thal LJ, Petersen RC, Jack C, Jagust W, Trojanowski JQ, Toga AW, Beckett L. The Alzheimer’s disease neuroimaging initiative. Neuroimaging Clin N Am. 2005 Nov;15 (4):869–877. doi: 10.1016/j.nic.2005.09.008. [DOI] [PMC free article] [PubMed] [Google Scholar]
- Narayana P, Brey W, Kulkarni M, Sievenpiper C. Compensation for surface coil sensitivity variation in magnetic resonance imaging. Magn Reson Imaging. 1988;6 (3):271–274. doi: 10.1016/0730-725x(88)90401-8. [DOI] [PubMed] [Google Scholar]
- Nestor SM, Rupsingh R, Borrie M, Smith M, Accomazzi V, Wells JL, Fogarty J, Bartha R, Initiative ADN. Ventricular enlargement as a possible measure of Alzheimer’s disease progression validated using the Alzheimer’s disease neuroimaging initiative database. Brain. 2008 Sep;131 (Pt 9):2443–2454. doi: 10.1093/brain/awn146. [DOI] [PMC free article] [PubMed] [Google Scholar]
- Nyúl LG, Udupa JK. On standardizing the MR image intensity scale. Magn Reson Med. 1999 Dec;42 (6):1072–1081. doi: 10.1002/(sici)1522-2594(199912)42:6<1072::aid-mrm11>3.0.co;2-m. [DOI] [PubMed] [Google Scholar]
- Popovic A, Engelhardt M, Wu T, Radermacher K. Towards automatic parameter optimization for medical image segmentation algorithms. In: Kobbelt L, editor. Vision, Modeling, and Visualization. 2006. [Google Scholar]
- Preboske GM, Gunter JL, Ward CP, Jack CR. Common MRI acquisition non-idealities significantly impact the output of the boundary shift integral method of measuring brain atrophy on serial MRI. Neuroimage. 2006 May;30 (4):1196–1202. doi: 10.1016/j.neuroimage.2005.10.049. [DOI] [PMC free article] [PubMed] [Google Scholar]
- Ramani A, Jensen JH, Helpern JA. Quantitative MR imaging in Alzheimer disease. Radiology. 2006 Oct;241 (1):26–44. doi: 10.1148/radiol.2411050628. [DOI] [PubMed] [Google Scholar]
- Ridha BH, Barnes J, Bartlett JW, Godbolt A, Pepple T, Rossor MN, Fox NC. Tracking atrophy progression in familial Alzheimer’s disease: a serial MRI study. Lancet Neurol. 2006 Oct;5 (10):828–834. doi: 10.1016/S1474-4422(06)70550-6. [DOI] [PubMed] [Google Scholar]
- Rueckert D, Sonoda LI, Hayes C, Hill DL, Leach MO, Hawkes DJ. Nonrigid registration using free-form deformations: application to breast MR images. IEEE Trans Med Imaging. 1999 Aug;18 (8):712–721. doi: 10.1109/42.796284. [DOI] [PubMed] [Google Scholar]
- Schuff N, Woerner N, Boreta L, Kornfield T, Shaw LM, Trojanowski JQ, Thompson PM, Jack CR, Weiner MW, Initiative ADN. MRI of hippocampal volume loss in early Alzheimer’s disease in relation to ApoE genotype and biomarkers. Brain. 2009 Apr;132 (Pt 4):1067–1077. doi: 10.1093/brain/awp007. [DOI] [PMC free article] [PubMed] [Google Scholar]
- Schuster DP. The opportunities and challenges of developing imaging biomarkers to study lung function and disease. Am J Respir Crit Care Med. 2007;176 (3):224–230. doi: 10.1164/rccm.200703-462PP. [DOI] [PubMed] [Google Scholar]
- Sled JG, Zijdenbos AP, Evans AC. A nonparametric method for automatic correction of intensity nonuniformity in MRI data. IEEE Trans Med Imaging. 1998 Feb;17 (1):87–97. doi: 10.1109/42.668698. [DOI] [PubMed] [Google Scholar]
- Stonnington CM, Tan G, Klöppel S, Chu C, Draganski B, Jack CR, Chen K, Ashburner J, Frackowiak RSJ. Interpreting scan data acquired from multiple scanners: a study with Alzheimer’s disease. Neuroimage. 2008 Feb;39 (3):1180–1185. doi: 10.1016/j.neuroimage.2007.09.066. [DOI] [PMC free article] [PubMed] [Google Scholar]
- Weisenfeld N, Warfield S. Normalization of joint image-intensity statistics in MRI using the Kullback-Leibler divergence. Proc. IEEE International Symposium on Biomedical Imaging: Nano to Macro; 2004. pp. 101–104. [Google Scholar]
- Whitwell JL, Schott JM, Lewis EB, MacManus DG, Fox NC. Using nine degrees-of-freedom registration to correct for changes in voxel size in serial MRI studies. Magn Reson Imaging. 2004 Sep;22 (7):993–999. doi: 10.1016/j.mri.2004.01.057. [DOI] [PubMed] [Google Scholar]
- Woods RP, Grafton ST, Holmes CJ, Cherry SR, Mazziotta JC. Automated image registration: I. General methods and intrasubject, intramodality validation. J Comput Assist Tomogr. 1998;22 (1):139–152. doi: 10.1097/00004728-199801000-00027. [DOI] [PubMed] [Google Scholar]