

Abstract
A promising hypertension risk prediction score using data from the United States Framingham Offspring study has been developed, but this score has not been tested in other cohorts. We examined the predictive performance of the Framingham hypertension risk score in a European population, the Whitehall II study. Participants were 6704 London-based civil servants aged 35 to 68, 31% women, free from prevalent hypertension, diabetes and coronary heart disease. Standard clinical examinations of blood pressure, weight and height, current cigarette smoking and parental history of hypertension were undertaken 5-yearly four times. We recorded a total of 2043 incident (new-onset) cases of hypertension in three 5-year baseline-follow-up data cycles. Both discrimination (C-statistic 0.80) and calibration (Hosmer-Lemeshow chi-square 11.5) of the Framingham hypertension risk score were good. Agreement between the predicted and observed hypertension incidence was excellent across the risk score distribution. The overall predicted-to-observed ratio was 1.08; slightly better among individuals older than 50 (0.99 in men, 1.02 in women) than in younger participants (1.16 in men, 1.18 in women). Reclassification with a modified score based on our study population did not improve the prediction (net reclassification improvement −0.5%, 95% confidence interval −2.5% to 1.5%). These data suggest that the Framingham hypertension risk score provides a valid tool with which to estimate near-term risk of developing hypertension.
Keywords: Adult, Aged, Blood Pressure, Body Height, Body Weight, Employment, statistics & numerical data, Family Health, Female, Follow-Up Studies, Government Agencies, Humans, Hypertension, epidemiology, genetics, physiopathology, London, epidemiology, Male, Middle Aged, Prevalence, Reproducibility of Results, Risk Assessment, methods, statistics & numerical data, Risk Factors, Smoking
Keywords: Hypertension, prevention, primary prevention, public health, risk assessment, risk factors
INTRODUCTION
Hypertension, defined as systolic/diastolic blood pressure of ≥140/90 mm Hg,1 is a risk factor for coronary heart disease, chronic heart failure, stroke,1–7 chronic kidney disease,8 premature mortality1–3 and possibly also for dementia, in particular post-stroke dementia.9,10 There is evidence to show that targeting high-risk but non-hypertensive individuals for treatment may delay hypertension onset.11, 12 However, simple office-based tools to help clinicians identify high-risk people are lacking.
Recently, a promising risk prediction score using data from the U.S. Framingham Offspring study has been developed.13 First, it is simple, including only seven items: age, sex, systolic and diastolic blood pressure, body mass index, parental hypertension, and cigarette smoking (calculator available at www.annals.org). Second, the risk score was highly successful in estimating an individual’s risk for hypertension for up to 4 years among participants in the Framingham study. These findings clearly warrant further testing beyond the cohort in which the risk score was developed. In this study, we examine the Framingham hypertension risk score in a large European population, the British Whitehall II study.
METHODS
Population and Study Design
The Whitehall II study is a prospective occupational cohort study.14 The target population was all London-based office staff, aged 35–55, working in 20 civil service departments on recruitment to the study in 1985–1988 (Phase 1). With a response of 73%, the cohort consisted of 10,308 employees (6895 men and 3413 women). Since the Phase 1 medical examination, follow-up examinations have taken place approximately every 5 years: Phase 3 (1991–1993) n=8104; Phase 5 (1997–1999) n=6551; and Phase 7 (2003–2004) n = 6483.
The present analysis was based on 3 baseline-follow-up screening cycles (Table 1). Participants were included if they attended two consecutive screenings between Phase 1 and Phase 7. At the baseline for each of the 3 screening cycles, we successively excluded those participants who had prevalent hypertension (n = 1472, 1196 and 1574 at Phases 1, 3 and 5, respectively), prevalent cardiovascular disease (n = 38, 86 and 155), prevalent diabetes (n = 48, 34 and 66), or missing data on risk factors (n = 491, 377 and 789). The baseline population at Phase 1 included 4620 men and 2084 women.
Table 1.
Study Design and Number of Participants at Baseline and Follow-up Examinations.
| Baseline examination | Eligible participants* | Number after exclusions† | Follow-up examination | ||
|---|---|---|---|---|---|
| Phase 1 (1985–1988) | Phase 3 (1991–1993) | ||||
| Men | 5616 | → | 4146 | → | 522 incident cases |
| Women | 2488 | → | 1909 | → | 195 incident cases |
| Total | 8104 | → | 6055 | → | 717 incident cases |
| Phase 3 (1991–1993) | Phase 5 (1997–1999) | ||||
| Men | 4410 | → | 3167 | → | 510 incident cases |
| Women | 1800 | → | 1350 | → | 228 incident cases |
| Total | 6210 | → | 4517 | → | 738 incident cases |
| Phase 5 (1997–1999) | Phase 7 (2003–2004) | ||||
| Men | 4071 | → | 2219 | → | 417 incident cases |
| Women | 1620 | → | 888 | → | 171 incident cases |
| Total | 5691 | → | 3107 | → | 588 incident cases |
Eligible participants are those who attended both the baseline and follow-up examination
Number of participants after exclusions for prevalent hypertension, cardiovascular disease, diabetes and missing data.
Ethical approval for the Whitehall II study was obtained from the University College London Medical School committee on the ethics of human research; all participants provided written informed consent.
Assessment of Risk Factors and Prevalent Disease
We measured systolic blood pressure and diastolic blood pressure twice in the sitting position after 5 minutes rest with the Hawksley random-zero sphygmomanometer (Phases 1 to 5) and OMRON HEM 907 (Phase 7). The average of the two readings was taken to be the measured systolic and diastolic blood pressure. Prehypertension was defined as systolic blood pressure from 120 to 139 mm Hg or diastolic blood pressure from 80 to 89 mm Hg. Current smoking and parental hypertension were self-reported. Weight was measured in underwear to the nearest 0.1 kg on Soehnle electronic scales. Height was measured in bare feet to the nearest 1 mm using a stadiometer with the participant standing erect with head in the Frankfort plane. Body mass index (BMI) was calculated as weight (kilograms)/height (meters) squared.
Prevalent coronary heart disease was defined by meeting MONICA criteria 15, or positive responses to questions about chest pain16 and physician diagnoses, or evidence from medical records, or positive ECG findings. Diabetes was defined as a fasting glucose ≥7.0 mmol/L, a 2-hr postload glucose ≥11.1 mmol/L (75g oral glucose tolerance test), or reported doctor-diagnosed diabetes or use of diabetes medication 17.
Assessment of Incident Hypertension
Hypertension was defined according to the 7th report of the Joint National Committee on Prevention, Detection, Evaluation, and Treatment of High Blood Pressure (systolic/diastolic>140/90 mm Hg or use of antihypertensive medication).1 In each of the three screening cycles, we determined incident hypertension by presence of hypertension at follow-up among participants free of this condition at baseline (table 1).
Statistical Analysis
Participants were followed across the screening cycles until incident hypertension or last study phase, whichever came first, contributing to a total of 13,679 person-examinations. The association between prehypertension at baseline and subsequent incident hypertension was summarised using odds ratios and 95% confidence intervals which were computed using standard methods. We examined the validity of the Framingham risk score in four steps. First, we examined whether prediction of incident hypertension based on prehypertension status improved following reclassification based on high Framingham risk score (corresponding to >20% predicted risk between successive screening cycles) using the net reclassification improvement (NRI).18 We repeated this analysis with cut-offs >10% and >15% predicted risk to examine whether the findings were sensitive to the threshold used to define high risk using the Framingham risk score.
Second, we randomly split the person-examination observations into two groups, 60% for a ‘derivation’ dataset and 40% for a ‘validation’ dataset. We developed a comparison risk prediction score based on the derivation data, using the same variables and statistical procedures as those used for the development of the Framingham hypertension risk score.13 We identified significant predictors and interaction terms for incident hypertension in multivariable adjusted Weibull regression models for interval censored data.
Third, we calculated a risk prediction score (‘the Whitehall II risk score’) for the validation dataset from the β-coefficients obtained from the derivation cohort. We calculated the Framingham risk score, using the β-coefficients derived in the Framingham study.13 The variable parental hypertension included 2 categories (yes vs no) in the present study but 3 categories (neither parent, one parent, both parents) in the Framingham study. To produce a comparable β-coefficient that could be applied to the Whitehall data, we used the parental hypertension distribution presented in the Framingham paper to give a weighted average to the estimates from the per category increment coefficient. This resulted in a coefficient that shows the effect for the presence versus absence of parental hypertension. Both of the above scores were computed using the observed follow-up time for each participant within the follow-up cycle so that we could compare this predicted risk with the observed incident hypertension. With study examinations occurring every 5 years, results were expressed per 5 years.
Fourth, we assessed the performance of the risk prediction for both the Framingham and Whitehall II risk scores in the validation cohort. We compared the predicted hypertension incidence to the observed incidence for each decile category of both risk scores. We calculated the overall predicted-to-observed risk ratios for the whole validation cohort, separately by sex, age, risk factor groups and study cycle. We assessed discrimination based on C-statistics and calibration by using the modified Hosmer-Lemeshow chi-square statistics, again following the same procedures as the Framingham study.13 Finally, we estimated the NRI18 to examine whether prediction based on the Framingham risk score categories (corresponding to <5%, 5 to 20%, and >20% predicted risk between successive screening cycles) was significantly improved following reclassification based on the Whitehall II score. All analyses were run with SAS version 9.2.
RESULTS
Baseline Characteristics
Table 2 presents characteristics of the 6704 participants. Their mean age at baseline was 44.6 years and 31% were women. Mean blood pressure was 118.9/74.6 mm Hg and 3646 (54.4%) were pre-hypertensive at baseline. Clinical features for the derivation and validation subcohorts were determined based on the 3 baseline examinations. As expected, the cohorts were very similar.
Table 2.
Characteristics of the Participants
| Person-examinations across follow-up |
|||
|---|---|---|---|
| Characteristic | Baseline population | Derivation cohort | Validation cohort |
| Number of participants/observations | 6704 | 8207 | 5472 |
| Mean age (SD), y | 44.6 (6.4) | 47.9 (7.2) | 47.9 (7.2) |
| Women, n (%) | 2084 (31) | 2439 (30) | 1708 (31) |
| White, n (%) | 6155 (92) | 7596 (93) | 5068 (93) |
| Mean blood pressure (SD), mm Hg | |||
| Systolic | 118.9 (10.8) | 117.5 (10.9) | 117.1 (10.8) |
| Diastolic | 74.6 (8.1) | 75.1 (8.0) | 74.8 (7.9) |
| Prehypertensive, n (%) | 3646 (54.4) | 4218 (51.4) | 2784 (50.9) |
| Current smoker, n (%) | 1052 (16) | 1115 (14) | 703 (13) |
| Parental hypertension, n (%) | 2368 (35) | 2828 (34) | 1899 (35) |
| Mean body mass index (SD), kg/m2 | 24.3 (3.3) | 24.7 (3.4) | 24.3 (3.3) |
Prehypertension Risk Category vs Framingham Hypertension Risk Score
During the baseline-follow-up cycles (median length 5.6 years), we recorded a total of 2043 incident cases of hypertension (5-year hypertension incidence was 13.6 per 100). Of these, 1690 person-examinations were associated with baseline prehypertension and 353 with baseline normotension. For non-hypertension cases at follow-up, the corresponding figures were 5312 and 6324 respectively, giving an odds ratio of incident hypertension, for those with baseline prehypertension compared to those with normotension, of 5.70 (95%CI 5.04 – 6.44).
High Framingham score (>20% predicted risk) was a significantly better predictor of incident hypertension than prehypertension. Among those not developing hypertension, the net percentage of individuals correctly reclassified (ie correct reclassifications - incorrect reclassifications) using the Framingham score compared with the prehypertension risk category was 24.6%. Among those with incident hypertension, the net percentage was −18.0%. The overall net reclassification improvement from defining high risk based on the Framingham score rather than prehypertension was therefore 6.6% (95% CI 3.2 – 10.1%). Repeating this analysis with the high risk group defined by the Framingham score corresponding to >10% and >15% predicted risks resulted in net reclassification improvements of 4.5% (95% CI 2.1 – 7.0%) and 8.5% (95% CI 5.6 – 11.3%). These findings suggest that the superior prediction of incident hypertension with the Framingham hypertension risk score rather than prehypertension status was robust to various cut-off points to define high risk.
Developing a Comparison Score (the Whitehall II Risk Score)
To create a comparison risk score based on the Whitehall II data, we drew a 60% random sample from the total data. This derivation dataset included 8207 person-examinations. The Weibull β-coefficients for incident hypertension from a multivariable-adjusted model were used to calculate the Whitehall II hypertension risk score (table 3). The hazard ratio for BMI was slightly greater (1.071 v 1.039) than that obtained in the Framingham study,12 but differences in all other hazard ratios between the present study and the Framingham study were non-significant.
Table 3.
Stepwise Multivariable-adjusted Weibull Estimates and Hazard Ratios for Incident Hypertension in the Derivation Cohort (8207 Person-examination Observations)
| Parameter/predictor | Weibull β-coefficient (±SE) | Hazard ratio (95% CI) | P value | Comparison with Framingham* |
|---|---|---|---|---|
| Intercept | 12.0068 ± 0.3756 | |||
| Age† (per year) | −0.0301 ± 0.0029 | 1.051 (1.041 – 1.061) | <0.0001 | ‡ |
| Women (vs men) | −0.0716 ± 0.0385 | 1.125 (0.994 – 1.274) | 0.063 | 0.27 |
| Systolic blood pressure (per 1 mm Hg) | −0.0377 ± 0.0022 | 1.064 (1.056 – 1.072) | <0.0001 | 0.62 |
| Diastolic blood pressure§ (per 1 mm Hg) | −0.0263 ± 0.0030 | 1.044 (1.034 – 1.054) | <0.0001 | ‡ |
| Current smoking (vs not) | −0.1224 ± 0.0503 | 1.223 (1.040 – 1.439) | 0.015 | 0.89 |
| Parental hypertension (vs not) | −0.1567 ± 0.0352 | 1.294 (1.156 – 1.450) | <0.0001 | 0.70 |
| Body mass index (per unit) | −0.0419 ± 0.0047 | 1.071 (1.055 – 1.088) | <0.0001 | <0.001 |
| Age by diastolic blood pressure|| | 0.0018 ± 0.0003 | 0.9970 (0.9959 –0.9980) | <0.0001 | 0.19 |
| Scale parameter | 0.6074 ± 0.0159 | NA | NA | |
| Weibull shape | 1.6464 ± 0.0430 | NA | NA |
P for difference in hazard ratios between this study and the Framingham study12
Main effect of age is given for a diastolic blood pressure of 75 mm Hg.
Age and diastolic blood pressure terms not compared since model contains age by diastolic interaction term
Main effect of diastolic blood pressure is given for an age of 50 years.
The effect of increasing diastolic blood pressure on the incidence of hypertension decreases with age.
Comparison Between the Framingham and Whitehall II Risk Scores
The validation dataset was independent of the derivation data and comprised a total of 5472 person-examinations. The overall agreement between the predicted and observed incidence of hypertension was high across the risk score distribution for both the Framingham and Whitehall II risk scores (Figure 1). The predicted-to-observed ratio for incident hypertension was close to one: 1.08 for both the Framingham risk score and the Whitehall II risk score. The Framingham score slightly overestimated hypertension risk among men younger than 50 and those with normal weight, but not in other subgroups (table 4). There were no differences in risk prediction between the three study cycles (p=0.13).
Figure 1.
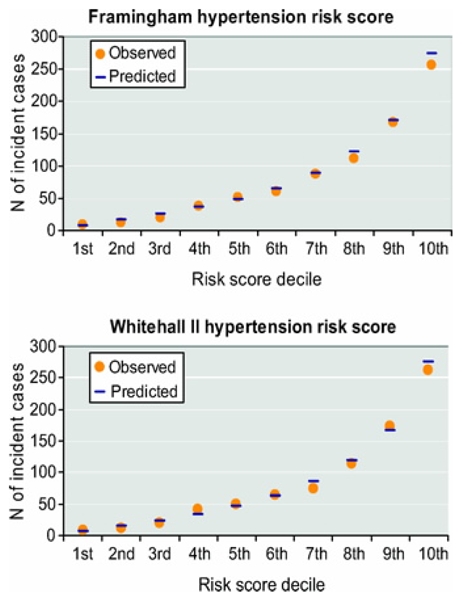
Predicted and Observed Incident Hypertension Cases by Deciles of the Framingham Risk Score (Upper Panel) and the Whitehall II Risk Score (Lower Panel).
Table 4.
Ratios of Predicted to Observed (P/O) Hypertension Incidence for the Framingham and Whitehall II Risk Scores by Sex and Age in the Validation Cohort (N=5472)
| Framingham risk score |
Whitehall II risk score |
|||||
|---|---|---|---|---|---|---|
| Population | N (cases) | Observed 5-year risk (per 100) | Predicted 5-year risk (per 100) | P/O ratio* (95% CI) | Predicted 5-year risk (per 100) | P/O ratio* (95% CI) |
| All | 5472 (785) | 13.1 | 14.1 | 1.08 (1.00 – 1.15) | 14.1 | 1.08 (1.00 – 1.15) |
| Men, age | ||||||
| <50 yr. | 2255 (258) | 10.5 | 12.1 | 1.16 (1.02 – 1.31) | 11.9 | 1.14 (1.01 – 1.28) |
| 50+ yr. | 1509 (298) | 17.9 | 17.7 | 0.99 (0.88 – 1.11) | 18.6 | 1.04 (0.93 – 1.17) |
| Women, age | ||||||
| <50 yr. | 992 (94) | 8.7 | 10.3 | 1.18 (0.96 – 1.44) | 8.7 | 1.08 (0.89 – 1.33) |
| 50+ yr. | 716 (135) | 17.3 | 17.7 | 1.02 (0.87 – 1.21) | 17.8 | 1.03 (0.87 – 1.22) |
| Smoking | ||||||
| Current smokers | 703 (99) | 13.0 | 14.8 | 1.14 (0.93 – 1.39) | 14.5 | 1.12 (0.92 – 1.36) |
| Non-smokers | 4769 (686) | 13.1 | 14.0 | 1.06 (0.99 – 1.15) | 14.0 | 1.07 (0.99 – 1.15) |
| Parental hypertension | ||||||
| No | 3573 (461) | 11.8 | 12.5 | 1.06 (0.96 – 1.16) | 12.8 | 1.09 (0.99 – 1.19) |
| Yes | 1899 (324) | 15.6 | 17.1 | 1.10 (0.98 – 1.22) | 16.5 | 1.06 (0.95 – 1.18) |
| BMI, kg/m2 | ||||||
| <25.0 | 3239 (326) | 9.2 | 10.9 | 1.19 (1.06 – 1.32) | 10.3 | 1.12 (1.00 – 1.24) |
| ≥ 25.0 | 2233 (459) | 18.8 | 18.6 | 0.99 (0.91 – 1.09) | 19.7 | 1.05 (0.96 – 1.15) |
| Risk prediction cycle | ||||||
| 1985/88 to 1991/93 | 2411 (270) | 10.7 | 12.5 | 1.17 (1.04 – 1.32) | 11.7 | 1.10 (0.97 – 1.24) |
| 1991/93 to 1997/99 | 1840 (294) | 13.9 | 14.7 | 1.06 (0.95 – 1.19) | 15.0 | 1.08 (0.96 – 1.21) |
| 1997/99 to 2003/04 | 1221 (221) | 16.5 | 16.1 | 0.97 (0.85 – 1.11) | 17.2 | 1.04 (0.91 – 1.19) |
Based on the predicted and observed incidence of hypertension between successive cycles.
The C-statistic was 0.803 for the Framingham risk score and 0.804 for the Whitehall II risk score, indicating good discrimination for both. Hosmer-Lemeshow chi-square values of 11.5 for the Framingham score and 14.3 for the Whitehall II score were both lower than 20, indicating good calibration.
Reclassification
Table 5 shows the reclassification of individuals between risk categories after replacing the Framingham risk score with the Whitehall II risk score. Among the incident hypertension cases, 32 person-examinations were appropriately reclassified to higher risk categories whereas 20 person-examinations were inappropriately reclassified to lower risk categories. Among those who did not develop hypertension, 175 person-examinations were appropriately classified to lower risk categories and 261 person-examinations inappropriately to higher risk categories. As the net reclassification improvement was −0.3%, replacing the Framingham risk score with the Whitehall II risk score did not result in a better prediction of incident hypertension.
Table 5.
Reclassification of the Predicted Risk of Incident Hypertension between Phases of Follow-up, Based on the Framingham vs Whitehall II Risk Score in the Validation Cohort (5472 Observations).
| Predicted 5-year risk (Whitehall II) |
Reclassified |
||||||
|---|---|---|---|---|---|---|---|
| Status at follow-up examination | Predicted 5-year risk (Framingham) | Low (<5%) | Medium (5%–20%) | High (>20%) | Increased risk | Decreased risk | Net correctly reclassified (%) |
| Hypertensive (N=785) | |||||||
| <5% | 22 | 5 | 0 | 32 | 20 | 1.5% | |
| 5–20% | 3 | 218 | 27 | ||||
| >20% | 0 | 17 | 493 | ||||
| Non-hypertensive (N=4687) | |||||||
| <5% | 1313 | 170 | 0 | 261 | 165 | −2.0% | |
| 5–20% | 80 | 2053 | 91 | ||||
| >20% | 0 | 85 | 895 | ||||
| Net Reclassification Improvement (95% CI) | −0.5% (−2.5 to 1.5)* | ||||||
On repeating this analysis with the highest risk groups split into a high risk (20–40%) group and a very high risk (>40%) group we found the net reclassification improvement was −1.0%, again showing that the Whitehall risk score did not result in a better prediction of incident hypertension than the Framingham hypertension risk score.
DISCUSSION
In a large cohort of non-hypertensive men and women aged 35 to 68, we showed that the Framingham hypertension risk score has high calibration and discrimination for predicting the risk of incident hypertension. The ratio of predicted-to-observed absolute risk of incident hypertension was close to 1 through the entire score distribution. Reclassification showed that the original Framingham risk score performs as well as the alternative Whitehall risk score derived here. These findings provide strong support for the validity of the Framingham hypertension risk score.
Clinical trials have demonstrated that treatment of prehypertensive individuals can prevent hypertension.1, 11, 12, 19 However, prehypertension is highly prevalent and therefore treating all prehypertensive people would require substantial resources.13 Our results show the Framingham hypertension risk score improves prediction of incident hypertension compared to that based on prehypertension status alone, and enabled a better identification of non-hypertensive individuals at the greatest risk. Superior prediction by the Framingham score is unsurprising given that it takes into account multiple independent risk factors. Furthermore, the algorithm treats blood pressure as a continuous variable rather than as a categorical one; this corresponds to the observation that the risk of cardiovascular disease increases in a continuous manner by increasing systolic and diastolic blood pressure levels above 115/75 mm Hg.2
Studies evaluating a risk score on the same data on which the score was developed are prone to over-optimistic estimates of predictive performance. Our analysis shows that the results of the Framingham Offspring study which developed the hypertension risk score were highly replicable in an independent cohort and thus probably realistic. Several similarities in the Whitehall II and Framingham Offspring studies may have contributed to the similar predictive performance of the Framingham hypertension risk score observed in these two cohorts. That is, both were predominantly Caucasian populations and free of diabetes; there was little difference in mean age (45 vs 42 years), mean blood pressure (119/75 mm Hg vs 116/75 mm Hg) or hypertension incidence. It may be that the measurement of blood pressure, with a mercury-column sphygmomanometer in the Framingham Offspring study rather than the Hawksley random-zero sphygmomanometer as in the Whitehall II study, partially explains the slightly higher blood pressure values in our cohort).20, 21 Differences between the two cohorts, in turn, support the generalizability of the hypertension risk score across heterogeneous populations. Indeed, the British Whitehall II participants were leaner (BMI 24.3 vs 25.1 kg/m2), with lower prevalence of current smokers (16% vs 35%) and from a different cultural settings (European vs American, metropolitan vs moderate-sized town) than the Framingham Offspring cohort.13
No previous study has examined the predictive performance of the Framingham hypertension risk score by sex, age and in specific subgroups. We found the predicted-to-observed ratio was very similar in men and women, smokers and non-smokers, and participants with and without a history of parental hypertension. The score slightly overestimated risk for normal weight people and those younger than 50. Thus, if the Framingham hypertension risk score was used, preventive treatment would be considered for these specific groups at a lower level of absolute hypertension risk than for the other groups.
Strengths and Limitations
The present study benefits from the large sample size, a design with multiple screening cycles, and the standardized protocols to assess risk factors. This study also has several limitations. First, the initial examination was in late 1980s when the prevalence of obesity was lower than at present. However, credibility that the Framingham hypertension risk score may also be valid in more contemporary cohorts is increased by our findings confirming the predictive validity of this score in the most recent data cycle between years 1997–99 and 2003–04 and among overweight participants. Second, we measured blood pressure with a random-zero sphygmomanometer at the first three examinations, but used an automated oscillometric device at the latest examination. Although the latter device is known to provide higher blood pressure values,22 sensitivity analyses showed the predictive performance of the Framingham hypertension risk score to be similar in the cycle with change in blood pressure device as in those cycles with blood pressure measurement undertaken with the same device. Third, we used self-report data to assess the history of parental hypertension while in the original Framingham Offspring study parents’ blood pressure was measured. Direct measurement of parental hypertension is likely to provide more accurate information, but such data are seldom available. As the hypertension risk score will typically be determined based on self-reported parental hypertension in clinical practice, our measurement method is justified and strengthens ecological validity. Fourth, as our cohort comprised mostly white participants and did not include the unemployed, further validation studies are needed to confirm the generalisability of the findings in more heterogeneous populations.
Perspective
Risk models are used to target preventive treatments to individuals at the highest risk in order to facilitate cost effectiveness. Our investigation represents a crucial step in validating the simple office-based Framingham hypertension risk score which has not previously been tested beyond the cohort the scoring method was developed. Our study validated this risk score in a well-characterized British cohort that was larger than the original derivation dataset; we also demonstrated the predictive validity of the score separately among men and women and various risk groups. This evidence further justifies use of the Framingham hypertension risk score in clinical practice to identify individuals at increased near-term risk of developing hypertension.
Acknowledgments
Sources of Funding
Medical Research Council; British Heart Foundation; Wellcome Trust; Health and Safety Executive; Department of Health; Agency for Health Care Policy Research, UK; John D and Catherine T MacArthur Foundation Research Networks on Successful Midlife Development and Socio-economic Status and Health; National Institute on Aging, NIH, US; Academy of Finland, Finland; and European Science Foundation. David Batty is a Wellcome Trust Fellow.
Footnotes
Conflict(s) of Interest/Disclosure(s) Statement
No author has anything to disclose.
References
- 1.Chobanian AV, Bakris GL, Black HR, Cushman WC, Green LA, Izzo JL, Jr, Jones DW, Materson BJ, Oparil S, Wright JT, Jr, Roccella EJ. Seventh report of the Joint National Committee on Prevention, Detection, Evaluation, and Treatment of High Blood Pressure. Hypertension. 2003;42:1206–1252. doi: 10.1161/01.HYP.0000107251.49515.c2. [DOI] [PubMed] [Google Scholar]
- 2.Turnbull F Blood Pressure Lowering Treatment Trialists’ Collaboration. Effects of different blood-pressure-lowering regimens on major cardiovascular events: results of prospectively-designed overviews of randomised trials. Lancet. 2003;362:1527–1535. doi: 10.1016/s0140-6736(03)14739-3. [DOI] [PubMed] [Google Scholar]
- 3.Psaty BM, Lumley T, Furberg CD, Schellenbaum G, Pahor M, Alderman MH, Weiss NS. Health outcomes associated with various antihypertensive therapies used as first-line agents: a network meta-analysis. JAMA. 2003;289:2534–2544. doi: 10.1001/jama.289.19.2534. [DOI] [PubMed] [Google Scholar]
- 4.Lewington S, Clarke R, Qizilbash N, Peto R, Collins R. Age-specific relevance of usual blood pressure to vascular mortality: a meta-analysis of individual data for one million adults in 61 prospective studies. Lancet. 2002;360:1903–1913. doi: 10.1016/s0140-6736(02)11911-8. [DOI] [PubMed] [Google Scholar]
- 5.Vasan RS, Larson MG, Leip EP, Evans JC, O’Donnell CJ, Kannel WB, Levy D. Impact of high-normal blood pressure on the risk of cardiovascular disease. N Engl J Med. 2001;345:1291–1297. doi: 10.1056/NEJMoa003417. [DOI] [PubMed] [Google Scholar]
- 6.Prevention of stroke by antihypertensive drug treatment in older persons with isolated systolic hypertension. Final results of the Systolic Hypertension in the Elderly Program (SHEP) SHEP Cooperative Research Group. JAMA. 1991;265:3255–3264. [PubMed] [Google Scholar]
- 7.Seshadri S, Beiser A, Kelly-Hayes M, Kase CS, Au R, Kannel WB, Wolf PA. The lifetime risk of stroke: estimates from the Framingham Study. Stroke. 2006;37:345–350. doi: 10.1161/01.STR.0000199613.38911.b2. [DOI] [PubMed] [Google Scholar]
- 8.Messerli FH, Williams B, Ritz E. Essential hypertension. Lancet. 2007;370:591–603. doi: 10.1016/S0140-6736(07)61299-9. [DOI] [PubMed] [Google Scholar]
- 9.McGuinness B, Todd S, Passmore P, Bullock R. The effects of blood pressure lowering on development of cognitive impairment and dementia in patients without apparent prior cerebrovascular disease. Cochrane Database Syst Rev. 2006;2:CD004034. doi: 10.1002/14651858.CD004034.pub2. [DOI] [PubMed] [Google Scholar]
- 10.Staessen JA, Richart T, Birkenhager WH. Less atherosclerosis and lower blood pressure for a meaningful life perspective with more brain. Hypertension. 2007;49:389–400. doi: 10.1161/01.HYP.0000258151.00728.d8. [DOI] [PubMed] [Google Scholar]
- 11.Effects of weight loss and sodium reduction intervention on blood pressure and hypertension incidence in overweight people with high-normal blood pressure. The Trials of Hypertension Prevention, phase II. The Trials of Hypertension Prevention Collaborative Research Group. Arch Intern Med. 1997;157:657–667. [PubMed] [Google Scholar]
- 12.Julius S, Nesbitt SD, Egan BM, Weber MA, Michelson EL, Kaciroti N, Black HR, Grimm RH, Jr, Messerli FH, Oparil S, Schork MA. Feasibility of treating prehypertension with an angiotensin-receptor blocker. N Engl J Med. 2006;354:1685–1697. doi: 10.1056/NEJMoa060838. [DOI] [PubMed] [Google Scholar]
- 13.Parikh NI, Pencina MJ, Wang TJ, Benjamin EJ, Lanier KJ, Levy D, D’Agostino RB, Sr, Kannel WB, Vasan RS. A risk score for predicting near-term incidence of hypertension: the Framingham Heart Study. Ann Intern Med. 2008;148:102–110. doi: 10.7326/0003-4819-148-2-200801150-00005. [DOI] [PubMed] [Google Scholar]
- 14.Marmot MG, Davey Smith G, Stansfeld S, Patel C, North F, Head J, White I, Brunner E, Feeney A. Health inequalities among British civil servants: the Whitehall II study. Lancet. 1991;337:1387–1393. doi: 10.1016/0140-6736(91)93068-k. [DOI] [PubMed] [Google Scholar]
- 15.Tunstall-Pedoe H, Kuulasmaa K, Amouyel P, Arveiler D, Rajakangas AM, Pajak A. Myocardial infarction and coronary deaths in the World Health Organization MONICA Project. Registration procedures, event rates, and case-fatality rates in 38 populations from 21 countries in four continents. Circulation. 1994;90:583–612. doi: 10.1161/01.cir.90.1.583. [DOI] [PubMed] [Google Scholar]
- 16.Rose GA, Blackburn H, Gillum RF, Prineas RJ. Cardiovascular Survey Methods. 2. Geneva: World Health Organization; 1982. [Google Scholar]
- 17.WHO. Definition, diagnosis and classification of diabetes mellitus and its complications. Geneva: World Health Organization; 1997. [Google Scholar]
- 18.Pencina MJ, D’Agostino RB, Sr, D’Agostino RB, Jr, Vasan RS. Evaluating the added predictive ability of a new marker: from area under the ROC curve to reclassification and beyond. Stat Med. 2008;27:157–172. doi: 10.1002/sim.2929. [DOI] [PubMed] [Google Scholar]
- 19.He J, Whelton PK, Appel LJ, Charleston J, Klag MJ. Long-term effects of weight loss and dietary sodium reduction on incidence of hypertension. Hypertension. 2000;35:544–549. doi: 10.1161/01.hyp.35.2.544. [DOI] [PubMed] [Google Scholar]
- 20.Conroy RM, O’Brien E, O’Malley K, Atkins N. Measurement error in the Hawksley random zero sphygmomanometer: what damage has been done and what can we learn? BMJ. 1993;306:1319–1322. doi: 10.1136/bmj.306.6888.1319. [DOI] [PMC free article] [PubMed] [Google Scholar]
- 21.Hense HW. The Hawksley random zero sphygmomanometer. Comparison with mercury instrument is illogical. BMJ. 1993;307:562–563. doi: 10.1136/bmj.307.6903.562-a. [DOI] [PMC free article] [PubMed] [Google Scholar]
- 22.Stang A, Moebus S, Mohlenkamp S, Dragano N, Schmermund A, Beck EM, Siegrist J, Erbel R, Jockel KH. Algorithms for converting random-zero to automated oscillometric blood pressure values, and vice versa. Am J Epidemiol. 2006;164:85–94. doi: 10.1093/aje/kwj160. [DOI] [PubMed] [Google Scholar]