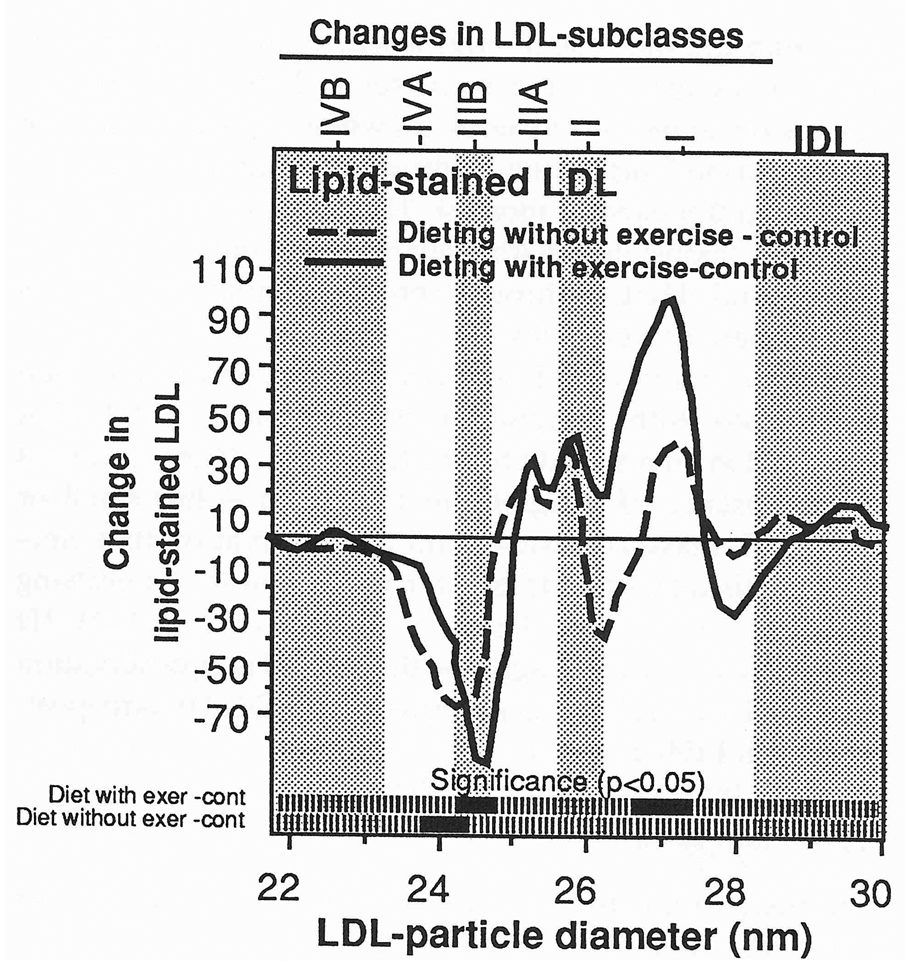
Fig 4.
Mean differences for changes in lipid-stained LDL by particle diameter between the dieting with exercise, dieting without exercise, and control groups. Bars at the bottom of the figures designate significance at P < .05 by two-sample t tests. There were no significant differences between the dieting with exercise and dieting without exercise groups. Significance levels were largely unchanged when adjusted for changes in body mass (analyses not displayed).

