Abstract
This paper reviews recent non-human primate (NHP) neuroimaging literature using MRI in macaque, baboon and chimpanzee. It describes general challenges and limitations for NHP MRI studies, and reviews recent applications of anatomical, diffusion tensor, cerebral blood flow MRI. Applications to NHP stroke is discussed in some detail.
Keywords: magnetic resonance imaging, cerebral blood flow, neuroimaging, stroke, NHP, DTI, BOLD fMRI, arterial spin labeling, DWI
1) INTRODUCTION
Non-human primates (NHPs) are important animal models because of their overall similarities to humans, resulting in better recapitulation of many human diseases compared to rodent models. Research using NHP models have significantly advanced our understanding of neuroscience, neurodegerative disorders, aging and development. NHP models have played a vital role in vaccine, AIDS and infectious disease research.
Magnetic resonance imaging (MRI) has become a powerful research and clinical imaging tool because it can provide non-invasive anatomical, physiological and functional images at high spatial and temporal resolution with excellent soft tissue contrast. Many NHP studies could benefit significantly using non-invasive MRI. A few nonhuman primate research centers have built their own imaging operations or are closely affiliated with MRI centers. Importantly, MRI protocols developed using NHP subjects can be more readily extended to humans because clinical scanners are often used, and the size and complexity of NHP brain are more similar to human brain.
This paper reviews recent NHP MRI neuroimaging literature in macaque, baboon and chimpanzee. It starts by describing some general limitations and challenges in NHP MRI studies, followed by a review of recent applications of anatomical, diffusion tensor, cerebral blood flow MRI. Applications to NHP stroke are discussed in some detail.
2) CHALLENGES AND LIMITATIONS
Some of the potential challenges and limitations in carrying out NHP MRI studies include the need for animal support, custom-made RF coils for NHP to use on human scanners, hardware constraints on spatial resolution, and magnetic susceptibility artifacts.
Animal support
The majority of NHP MRI studies are carried out under anesthesia, which requires veterinary support to provide care for animals during anesthesia and recovery. The common choices of anesthesia are sevoflurane, isoflurane, ketamine and propofol. The choice of anesthetics and dosages vary depending on the types of MRI experiments (i.e., anatomical MRI versus functional MRI (fMRI)) and the duration of the MRI exams. Stimuli for fMRI experiments involving anesthetized NHPs are mostly limited to primary sensory systems (such as visual and somatosensory) because anesthetics suppress high-order cognitive functions, precluding fMRI studies of cognitive and behavioral task paradigms. The use of paralytics along with a combination of low anesthetic dose and opiates (such as fentanyl or morphine) have been successfully applied for NHP fMRI studies (1, 2).
It is necessary to monitor the physiological status of anesthetized NHPs during MRI experiments. Common physiological parameters include heart rate, respiration rate, arterial oxygen saturation, end-tidal CO2, blood pressure, and temperature. The monitoring equipment used for these purposes must be MRI compatible, should yield reliable recordings, and should not introduce noise or artifacts in the MR images. A set of MRI-compatible monitoring equipment that is cost effective and meets the demands we have encountered include a Surgivet’s capnograph (end-tidal CO2, inspired O2 and CO2, respiratory waveforms) and blood-pressure monitor and DigiSense temperature monitor/regulator. Standard MRI-compatible electrode-based EKG systems from human MRI scanners work well on NHP subjects. Optical-based oximetry to derive arterial oxygen saturation and heart rate is unreliable on NHP in our experience likely because of the opaqueness of NHP skin. Multifunctional, MRI-compatible monitoring devices that can monitor EKG, oximetry, end-tidal CO2, inspired gas concentration, respiration waveforms and rate, blood pressure and temperature in a single device are commercially available for human MRI studies. However these units are significantly costlier than systems built from selected individual components.
While the majority of NHP MRI studies are carried out under anesthetized conditions, some are carried out under awake and behaving conditions (1, 3, 4). Awake NHP studies allow mapping of activation sites, response latencies, synchronicity of activation, and behavioral correlates involved in higher order functions. The physiological monitoring need not be as extensive as in anesthetized preparations because awake subjects can better regulate their own physiology. Awake NHP studies have been reported using macaque (3, 5–7) and marmoset (8, 9).
MRI hardware
MRI scanners specifically designed for imaging primates are sparse and there are only a few in operation to date (5, 6). Some animal scanners offer gradients with a clear bore of 15–25 cm inner diameter which could accommodate a small anesthetized macaque. Human scanners however, are more widely used for imaging large (adult macaque and larger species) NHPs (3, 4, 10). The large scanner size and the ease of use for many commonly available MRI protocols make human MRI systems more facile than small-animal imaging systems for translational aspects of NHP imaging research.
The smaller NHP brain volume, compared to human brain volume, make it necessary to acquire images with higher spatial resolution in order to achieve comparable parcellation of anatomical and functional structures. Brain weights for different species are summarized in Table 1 (11, 12). Assuming cubic volume, we estimated the relative spatial resolution (voxel size) for each of the species in the table below. Achieving these spatial resolutions for NHP on clinical scanners could be challenging, especially for protocols other than anatomical MRI. For example, a 1000×1000×1000μm voxel for human brain MRI occupies a comparable fractional brain volume to a 460×460×460 μm voxel for baboon. Achieving allometric spatial resolution for a range of NHP species using a clinical scanner presents a unique set of challenges.
Table 1.
Comparison of brain sizes and comparable pixel resolution of different species.
| Brain | Human | Chimpanzee | Baboon | Macaque | Marmoset | Rat |
|---|---|---|---|---|---|---|
| Weight, g | 1400 | 420 | 137 | 95 | 7 | 2.2 |
| Pixel resolution, μm | 1000 | 670 | 460 | 410 | 170 | 116 |
Strong applied magnetic field gradients are necessary to achieve high spatial resolution (i.e., to increase matrix sizes, reduce FOV and decrease slice thickness). Gradient strengths acheivable on human scanners are typically 20–60 mT/m (per axis), compared to 400–1500 mT/m (per axis) commonly available on small-animal MRI systems. In addition to spatial resolution, some imaging protocols (such as diffusion-tensor imaging and echo-planar imaging) on human are limited by the maximum achievable gradient strength. MRI vendors do not have financial incentive to make custom gradients dedicated for NHP studies. The majority of MRI centers do not have the capability to make custom gradient inserts. However, with the increasing need to push for higher spatial resolution in humans, head-only gradient systems with capability to produce ~80 mT/m magnetic field gradients are becoming commercially available. NHP MRI could also benefit significantly with these head-only gradient inserts. It is expected that this trend will facilitate future NHP MRI research.
Another factor that makes high spatial resolution NHP MRI challenging is the available signal-to-noise ratio (SNR). To achieve optimal SNR, RF coils should have the maximum possible filling factor – that is the RF coils should be the smallest possible that can cover the organs of interest. A limitation of NHP MRI studies on human scanners is that RF coils of different sizes may not be readily available. The few standard human RF coils may not be ideal for various NHP sizes. Thus, centers with a substantial NHP MRI research portfolio may consider developing their own RF coil fabrication capability.
Magnetic susceptibility and signal drop off around the frontal lobe and ear canal are generally worse for NHP brain than human brain because NHP brain has small volume-to-surface ratio. The shimming capability on human MRI scanners is poorer compared to animal scanners. Therefore, susceptibility-induced signal loss and distortion around the frontal lobe and ear canals, for example, are found to be substantially worse in DTI study of chimpanzee brain compared to human brain using typical imaging protocols, such as single-shot echo-planar imaging (EPI) with a matrix size of 64×64. We explored a few approaches that successfully minimize distortion and signal drop off, and these are briefly described below. High-resolution field mapping improves EPI quality (13, 14). Segmented EPI could be used to reduce readout time and echo time which reduce distortion and signal drop off, respectively, but at the expense of longer scanner time and increased segmentation artifacts. Reconstructing two sets of images acquired with opposite phase encoding directions (15) is helpful in removing spatial distortion but it doubles the imaging time. However, if signal averaging is needed, this is not an issue. Multiple thinner imaging slices can be employed to reduce intravoxel dephasing (and thus signal drop off) and these slices can be summed to recover SNR (15). This approach may be confounded by slice selection imperfection, and could lengthen TR, and thus, total acquisition time. Finally, parallel imaging (16) to reduce EPI readout time is helpful at the expense of SNR. These approaches can also be used in combination for several applications.
3) ANATOMICAL AND DIFFUSION TENSOR MRI
Anatomical contrast in MRI arise from differences in spin density, spin-lattice relaxation time (T1), spin-spin relaxation time (T2) and properties of translational diffusion of water in tissue. These MRI parameters are dependent on the local tissue environment including water content, cellular structure, macromolecule content, and ion concentrations. Many diseases alter these biophysical parameters, causing visible changes in image contrast. These changes may occur in early stages of disease progression, prior to clinical symptom onset. Anatomical NHP MRI has been used for surgical planning, to guide stereotaxic brain injection, volumetric studies of brain anatomy and anatomical changes associated with development, aging, sex and species differences, as well as several other applications. Figure 1 shows an assortment of high-resolution anatomical images of rhesus and chimpanzee brains. T1-weighted, T2-weigthed, FLAIR (fluid-attenuated inversion-recovery) and fractional anisotropy MRI provide excellent contrast both in vivo and post-mortem. Anatomical MRI is reviewed elsewhere in this special issue and will not be further discussed here.
Figure 1.
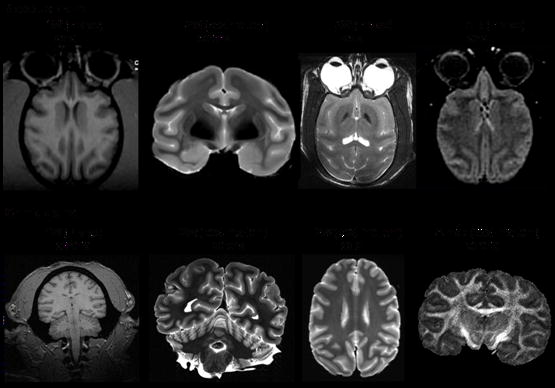
Anatomical images of (Top) rhesus and (bottom) chimpanzee brains. T1W: T1-weighted, T2W: T2-weighted, FLAIR: fluid-attenuated inversion-recovery, FA: fractional anisotropy.
Diffusion tensor imaging (DTI) (17, 18) has become a widely used tool for non-invasive imaging of anatomical connectivity (19–22) and brain microstructural morphology (23–25). DTI contrast arises from barriers (such as cell membranes of axons and oligodendrocytes) that hinder water diffusion in some orientations more than others, giving rise to anisotropic diffusion. In white matter, for example, water diffusion perpendicular to fiber tracts is more restricted than that parallel to the fiber tracts (26, 27). DTI has been used for detecting changes in myelination in the developing brain (28–30) and in demyelinating diseases (31, 32).
Although there have been numerous DTI studies in humans and rodents, DTI studies of NHP are sparse by comparison. Only a small number of NHP studies have been reported (33–42) and many of those utilized postmortem brain tissue. Figure 2 shows a typical DTI tractography data from our laboratory obtained on a macaque brain at 3T.
Figure 2.
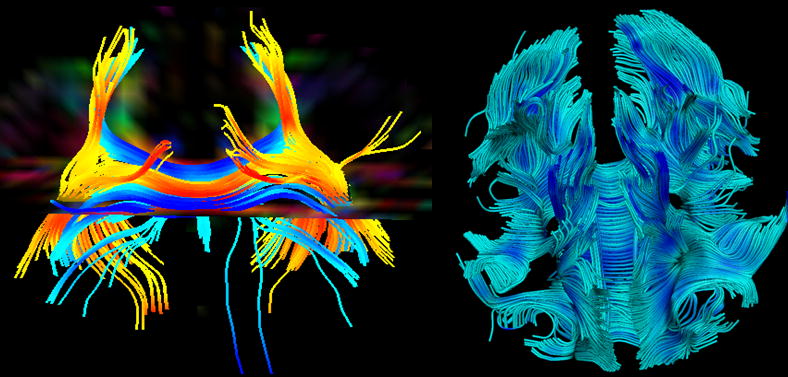
Fiber tracking of the corpus callosum (A) and whole brain (B) of a macaque at 3T. [Copyright permission in progress]
D’Arceuil and co-workers (43) investigated very high-SNR and high-resolution DTI of fixed macaque brain (Figure 3). They modified the water relaxation properties within fixed tissue to obtain conditions most compatible with constraints imposed by the MRI system hardware. Relaxivity measurements in gray and white matter allowed optimization of Gd-DTPA (gadolinium diethylenetriamine penta-acetic acid) concentration with respect to SNR, resulting in a 2-fold improvement. Fractional anisotropy (FA) changed little with Gd concentrations of up to 10 mM, although the ADC was reduced by the presence of 5 to 10 mM contrast agent. Comparison of in vivo, fresh ex vivo and fixed brains showed no significant FA changes but reductions in ADC of about 50% in fresh ex vivo, and 64% and 80% in fixed gray and white matter respectively. They also studied the temperature dependence of diffusion in these tissues and the data suggest that a 30 degrees increase in sample temperature may yield an improvement of up to 55% in SNR for a given diffusion weighting.
Figure 3.
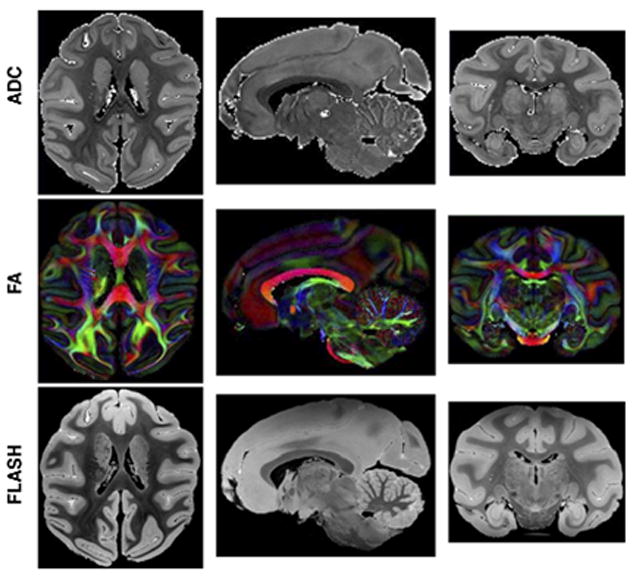
(A) Orthogonal planes through high resolution (425 microns) trace ADC maps, direction encoded Fractional Anisotropy (FA) maps and gradient echo FLASH (175 microns) images of a fixed macaque brain acquired at 4.7 Tesla. Voxel color in FA maps encode principle eigenvector directions in the usual way (red = left-right, green = anterior-posterior, blue = Superior-inferior). (43) [Copyright permission in progress]
Cerebral cortical development involves complex changes in cellular architecture and connectivity that occur at regionally varying rates. Kroenke et al. (40) investigated gestational development in fixed post-mortem baboon brain using DTI (Figure 4) and characterized regional changes in diffusion anisotropy using surface-based visualization methods. They concluded that anisotropy values vary across the thickness of the cortical wall, being higher in superficial layers. Further, cortical diffusion anisotropy exhibits a regional spatial dependence, and this pattern potentially parallels expansion of cortical surface, which does not occur uniformly in all regions.
Figure 4.
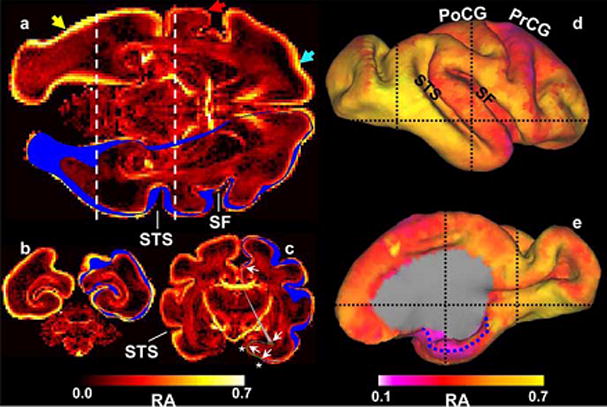
Heterogeneity in isocortical diffusion anisotropy at E125. In each image plane, the intersection of the right hemisphere isocortical surface is shown in blue. a, Laminar (light blue arrow) and regional (compare regions near yellow and red arrows) patterns of anisotropy variation are observable. Regional variation is also apparent in the coronal views (b, c; positions of these image planes are indicated by dashed lines in a, d, and e). For example, anisotropy caudal/inferior to the STS is larger than rostral/superior to the STS. The dotted blue line in e indicates the medial extent of the parahippocampal gyrus.
Rilling et al. (44) used DTI to perform comparative studies on human, chimpanzee and macaque (Figure 5). They focused on the arcuate fasciculus, a white-matter fiber tract which, in humans, is involved in human language processing. They found that the prominent temporal lobe projection of the human arcuate fasciculus was much smaller or absent in nonhuman primates. They concluded that this human specialization may be relevant to the evolution of language.
Figure 5.

Color maps of principal diffusion direction in one in vivo human, a postmortem chimpanzee and a postmortem macaque macaque brain (sagittal view). Yellow arrow points to red, mediolaterally oriented fibers in chimpanzee brain (44). [Copyright permission in progress]
Liu et al. (36) reported an in vivo macaque DTI study at high spatial resolution (1×1×1 mm) and evaluated variants on their acquisition protocol, susceptibility distortion correction method, and image resolution. They concluded that in vivo high-resolution monkey brain DTI on a clinical 3-Tesla scanner can be achieved within practical time. Other studies also explored more advanced DTI tracking algorithms in NHP, such as diffusion spectrum imaging tractography of crossing fibers (45).
In sum, NHP DTI studies offer unique perspectives on development and comparative white-matter connectivity across species.
4) BLOOD FLOW MRI
Non-invasive cerebral blood flow (CBF) measurements using MRI are widely used to study normal physiology and pathophysiology. Quantitative CBF can be obtained at high temporal and spatial resolution. Functional MRI based on changes in CBF is spatially more specific to the site of increased neural activity than traditional blood-oxygenation-level-dependent (BOLD) methods, capable of resolving cortical columns (46), which makes CBF-based data easier to interpret than the BOLD fMRI signals. CBF fMRI is also less susceptible to pathologic perturbation, and therefore is associated with less inter-subject and cross-day variability (47). Combined cerebral blood flow and BOLD fMRI measurements offer the means to estimate the stimulus-evoked changes in cerebral metabolic rate of oxygen metabolism (48–50). The main drawbacks of CBF fMRI measurements are relatively low temporal resolution, arising from low SNR per unit time achievable for this technique, and greater vulnerability to motion artifacts (47, 51).
CBF can be measured by using an exogenous intravascular contrast agent or by magnetically labeling the endogenous water in blood (47, 51). The former is efficient but it is incompatible with dynamic fMRI experiments because the long half life of the contrast agent allows only one CBF measurement per bolus injection. Arterial spin labeling (ASL) techniques, on the other hand, utilize endogenous compounds, and the labeled molecular tracer (magnetization-prepared water) has a short half-life (~ blood water T1) making it possible to perform multiple repeated measurements, which can be used to augment spatial resolution and/or signal-to-noise ratio. ASL is compatible with dynamic CBF fMRI studies.
ASL can be performed using pulsed labeling (52–54) or continuous labeling (55–57); both are capable of multislice and whole-brain imaging. Continuous ASL (cASL) can be achieved with the same radiofrequency (RF) coil used for imaging or a separate neck coil. cASL with a separate neck coil is generally more sensitive relative to the single-coil technique (52, 53, 58), particularly in small animals such as rodents which have a short arterial transit time (59, 60). Another advantage of utilizing a separate neck coil is that potential confounds associated with magnetization-transfer effects are eliminated, provided the coils are properly decoupled. This results in a larger signal difference between labeled and non-labeled images, and thus improved CBF SNR. RF power deposition is localized to the neck area and unlabeled images can be acquired without labeling RF, reducing the specific absorption rate (SAR) (61). While the cASL technique for measuring quantitative basal CBF and CBF-based MRI is more readily available on animal scanners for rodent imaging (59, 60), similar studies on humans and large non-human primates are sparse because clinical scanners generally lack the necessary hardware and software. cASL using a separate neck coil has been reported on General Electric scanners for human studies (56, 57). The typical spatial resolution of basal ASL CBF measurements on human scanners was 70 mm3 (56, 57) which may be inadequate for NHP MRI. CBF-based fMRI using cASL with a separate neck coil on human scanners remains to be demonstrated.
We implemented a three-coil arterial spin-labeling technique on a Siemens 3-Tesla Trio clinical scanner for non-human primate (macaque monkey) studies at high spatial resolution up to 3.4 mm3 (10). To overcome the difficulty and safety concerns in re-configuring hardware clinical MRI system, a stand-alone hardware unit for cASL using a separate neck coil was constructed. Hardware components which included an external RF amplifier, control electronics, optical-electrical relays, active decoupling circuits and radiofrequency probes were built, interfaced and tested on a Siemens 3-Tesla Trio. Figure 6 shows the schematic layout of the stand-alone ASL setup, placement of the RF coils and labeled arteries.
Figure 6.
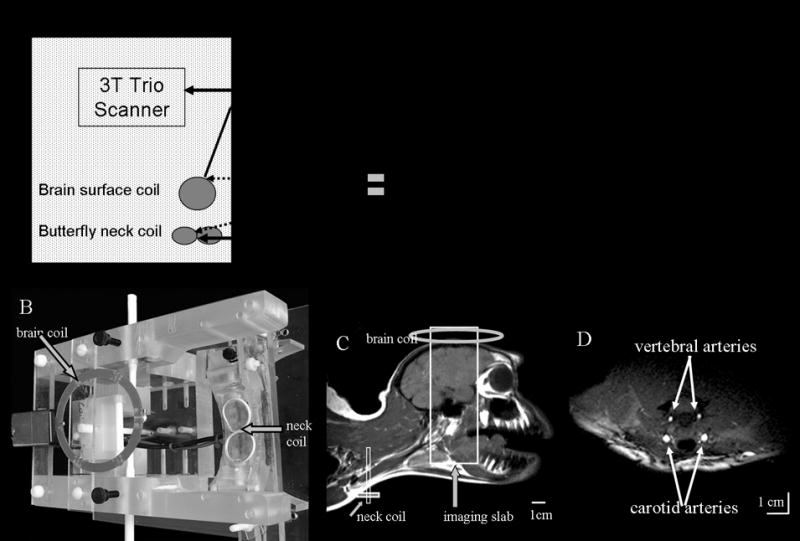
(A) Schematics of a stand alone unit for the three-coil arterial-spin-labeling technique. (B) A picture of the head-holder apparatus with neck and brain coils. (C) MR image of a monkey head and neck using a “volume coil” for demonstration of the approximate positions of the coils only. (D) Cross-sectional image of the neck showing the carotid and vertebral arteries. Neck coil was used as the transceiver (10). [Copyright permission in progress]
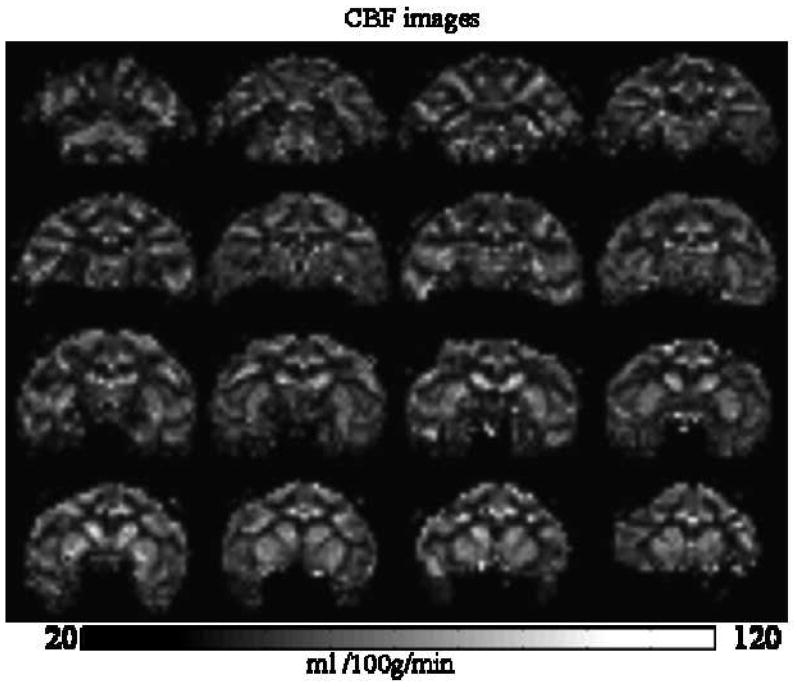
Figure 7 shows the labeling efficiency curve. The optimal labeling power was 2 Watts, labeling efficiency was 92 ± 2 %. Through a series of variable post-labeling delay measurements, the optimal post-labeling delay was determined to be 0.8 s. Whole-brain average ΔS/S was 1.0–1.5 %. Figure 8 shows the multislice quantitative CBF images obtained in 3 mins with 1.5-mm isotropic resolution. GM CBF was 104 ± 3 ml/100g/min (n = 6, SD) and WM CBF was 45 ± 6 ml/100g/min in isoflurane-anesthetized macaque monkeys, with the CBF GM/WM ratio of 2.3 ± 0.2.
Figure 7.
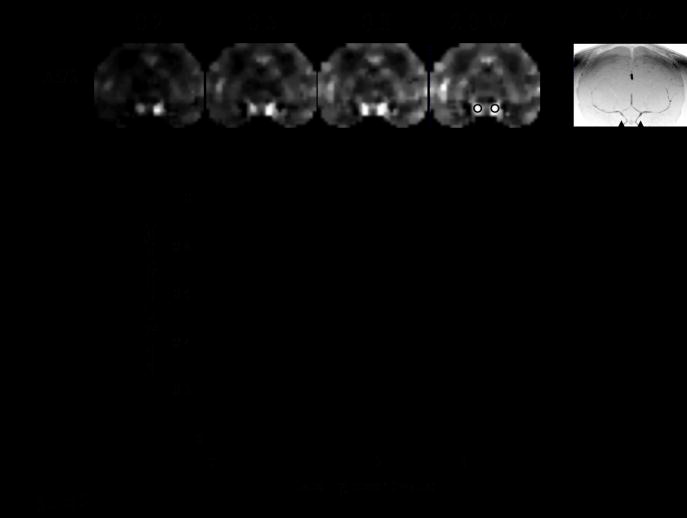
Labeling efficiency. ΔS/S images at different labeling RF powers and the angiograms are shown. The ROI’s of the arteries were used to quantify labeling efficiency. The optimal labeling power was 2 Watts which yielded 92% labeling efficiency (10). [Copyright permission in progress
Figure 8.
Quantitative CBF images using the optimized parameters (10). [Copyright permission in progress]
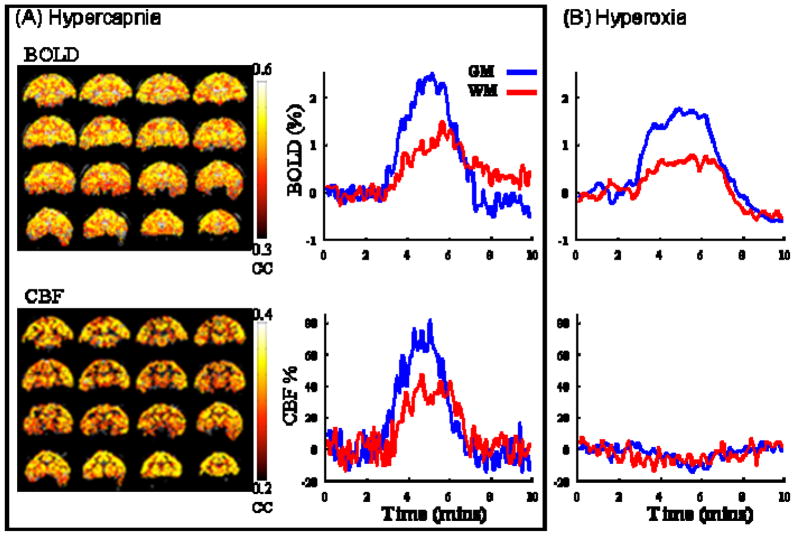
Combined CBF and BOLD (blood-oxygenation-level-dependent) fMRI associated with hypercapnia and hyperoxia were made with 8-s temporal resolution (Figure 9). CBF fMRI responses to 5% CO2 were 59 ± 10 % (GM) and 37 ± 4 % (WM); BOLD fMRI responses were 2.0 ± 0.4 % (GM) and 1.2 ± 0.4 % (WM). CBF fMRI responses to 100% O2 were −9.4 ± 2 % (GM) and −3.9 ± 2.6 % (WM); BOLD responses were 2.4 ± 0.7 % (GM) and 0.8 ± 0.2 % (WM).
Figure 9.
Single-animal BOLD and CBF fMRI of (A) hypercapnic and (B) hyperoxic challenge. Color bar indicates cross-correlation coefficients. BOLD and CBF changes are heterogeneous with larger changes in the gray matter and smaller changes in the white matter (10). [Copyright permission in progress]
The CBF GM to WM ratio was 2.3 which is within the ranges reported previously of 1.7 (57), 2.7 (62) 3 (63) by MRI, and 2.0 by PET (64). The GM CBF was 104 ± 3 ml/100g/min and WM CBF was 45 ± 6 ml/100g/min in isoflurane-anesthetized monkeys. Dynamic contrast-enhanced MRI only reported a CBF GM:WM ratio in anesthetized monkeys (63). PET reported quantitative CBF of 23–43 ml/100g/min (whole-brain) in propofol-anesthetized monkeys (65), and GM CBF value of 56–68 ml/100g/min in the cerebral cortex and a WM CBF value of 34 ml/100g/min in ketamine-anesthetized monkeys (66). Our CBF values in isoflurane-anesthetized monkeys were high compared to those in awake humans and anesthetized monkeys. The major cause of such difference is likely due to isoflurane anesthetic which is an established potent vasodilator. Similarly high CBF under isoflurane (67, 68) relative to other anesthetics (60) and awake conditions (68) have been well documented in rodents (isoflurane:awake CBF ratio in rat was 1.48 (60, 68) and the isoflurane:α-chloralose CBF ratio was 1.84 (68)). NHP CBF measurements have also been reported on a Bruker scanner using the built-in second RF channel (69, 70).
The use of a separate neck coil for spin labeling significantly increased the CBF signal-to-noise ratio and the use of small receive-only surface coil significantly increase the image signal-to-noise ratio and spatial resolution. ASL CBF measurements are helpful to many NHP studies such as stroke MRI as described below.
5) NHP MRI STUDIES of STROKE
Stroke in the rhesus macaque
Stroke is the third leading cause of death and the leading cause of long-term disability. It has been estimated that 5.8 million Americans have permanent neurological deficits from stroke, and that 71% of these stroke survivors can’t return to work. The American Heart Association estimated that $65.5 billion will be expended on the care of stroke patients in 2008. The cost is steadily rising because the conditions that put people at risk for stroke (such as heart disease and obesity) are also steadily on the rise. Despite the tremendous effort invested in ischemic stroke research, our ability to minimize neurological deficit by protecting ischemic neurons in stroke patients remains extremely limited.
While numerous neuroprotective drugs have shown positive results on experimental rodent stroke models, none has proven to be effective clinically. One widely accepted view to account for this disappointing outcome is that the rodent stroke model simply does not adequately reflect the complexity of human stroke. The Stroke Therapy Academic Industry Roundtable (STAIR), a committee commissioned by the American Heart Association has recommended that clinically relevant non-human primate stroke models be established for developing and assessing neuroprotective drugs.
Few MRI studies have focused on experimental NHP stroke, and most studies that have been performed used conventional MRI (such as T2 and FLAIR) to characterize the non-acute phase of injury, at a single time point (71–73), often at endpoint to quantify lesion volume. A MRS NHP stroke study has been reported (74). Multimodality MRI to serially image acute NHP stroke is only reported recently (75). In these studies, ischemia was induced in macaque using an endovascular technique. Figure 10 shows the T2, FLAIR, ADC and FA images from 3-hour and permanent occlusion in macaque. These results demonstrate that stroke can be reproducibly studied in a clinically more relevant animal model in which the precise stroke onset is known. NHP stroke model combined with clinically relevant MRI approaches could positively impact stroke research.
Figure 10.
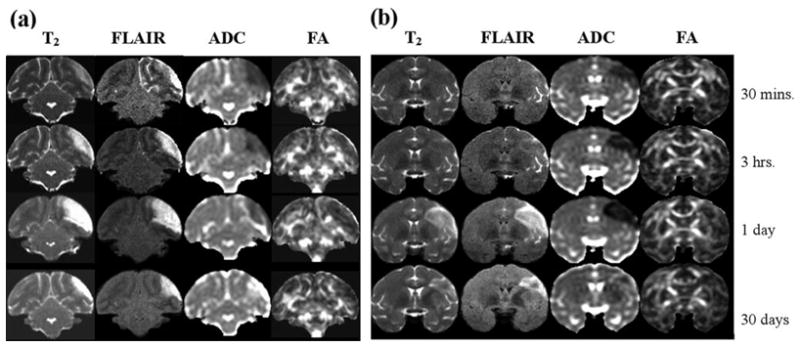
(a) Serial MRI data (1 slice) for an animal with a 3-hour middle cerebral artery occlusion as a function of time after occlusion. T2-weigthed MRI show subtle hyperintensity soon after reperfusion, while ADC is clearly reduced hyperacutely. (b) Serial MRI data (1 slice) for an animal with permanent middle cerebral artery occlusion, showing minimal hyperacute T2 elevation but more severe and longer duration acute ADC decrease (75). [Copyright permission in progress]
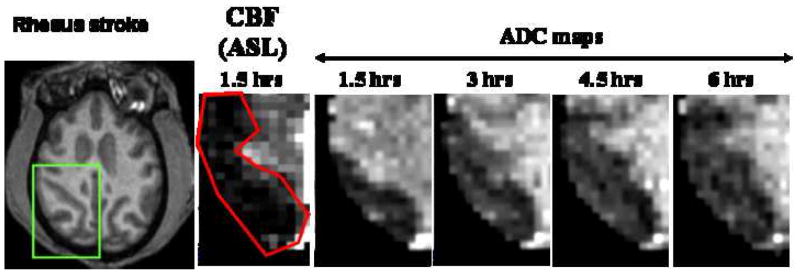
We have performed similar studies, with the addition of serial perfusion MRI using arterial spin-labeling technique and echo-planar imaging to image the perfusion-diffusion mismatch. The perfusion-diffusion mismatch approximates the ischemic penumbra. We employed an embolic stroke model using endovascular technique similar to that described in (75). Figure 11 shows a perfusion (CBF) and diffusion (ADC) image from one animal (coronal view). The CBF image was obtained using the arterial spin-labeling technique (10, 53). The region of perfusion deficit after stroke induction could be clearly delineated. CBF-defined lesion volume did not change over time for up to 6 hours (permanent occlusion) and thus only the CBF image at 1.5 hours after stroke is shown. In contrast, the ADC-defined lesion grew progressively until it matched the CBF deficit volume, in good agreement with observations in rats (76, 77) and humans (78, 79) albeit the temporal evolution of the perfusion-diffusion mismatch differ among the three species. Differences in ischemic evolution, as well as others species-dependent characteristics, underscore the importance of NHP stroke model.
Figure 11.
(A) Anatomy, CBF, and ADC at different time after permanent occlusion (embolic model). (B) Normalized whole-brain lesion volumes for 4 monkeys determined by CBF and ADC MRI. Lesion volumes were defined using the threshold method established in our laboratory on rodents (76, 77). Resolution: 750×750×1500 microns. [Copyright permission in progress]
Stroke in a chimpanzee (a natural stroke with Alzheimer’s disease-like deposits)
A 41-year-old, socially housed female chimpanzee (Pan troglodytes; CO494) spontaneously developed acute lethargy and rapidly progressive unilateral motor dysfunction, indicative of stroke of the middle cerebral artery territory. The animal was anesthetized, intubated and MRI was performed. Physiological parameters heart rate, respiration rate and arterial O2 saturation were within normal physiological ranges and were similar to other normal animals. A T2-weighted MRI revealed a massive, left-hemispheric lesion involving mainly the temporal, parietal, and occipital lobes with a substantial shifted in the midline (Figure 12) (80). In contrast, T1-weighted MRI of the brain performed 10 years earlier on the same animal showed no apparent abnormalities. Diffusion-weighted MRI lesion volume obtained using echo-planar imaging matched those of the T2-weighted images (Figure 13) and did not evolve over the duration of the MRI exam (~2 hrs). Post-mortem staining for tissue viability using 2,3,5 triphenyl tetrazolium chloride (TTC) of roughly the same slices confirmed infraction. Together with the timing of discovery of clinical symptoms and behavioral assessment, the lesion was estimated to be 6–12 hours old at the time of MRI. Gross examination of the post-mortem brain confirmed a substantial region of ischemic, non-hemorrhagic necrosis in the left hemisphere. The right hemisphere was grossly normal. The previous medical history was unremarkable except for a chronic systolic heart murmur first diagnosed at 15 years of age, moderate obesity (weight at death 61.5 kg), and high serum cholesterol (80).
Figure 12.
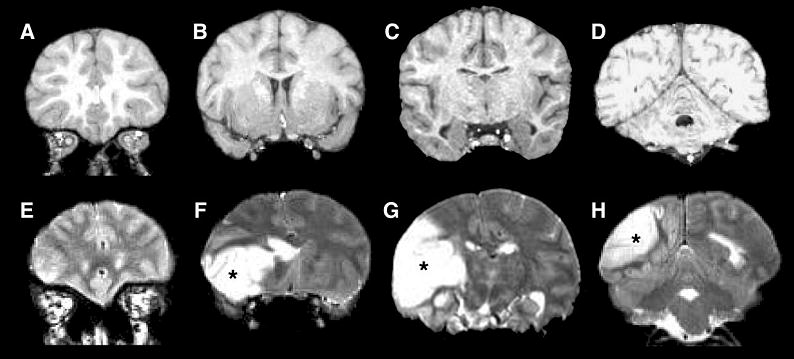
MR images of the chimpanzee brain before and during the stroke. A–D: An anterior-posterior series of coronal, T1-weighted MR images made 10 years prior to stroke. E–H: T2-weighted MR images captured after the symptoms had emerged, with the location of affected tissue in the left hemisphere indicated by asterisks. (A T2-weighted scan was not run prior to the stroke.) (80) [Copyright permission in progress]
Figure 13.
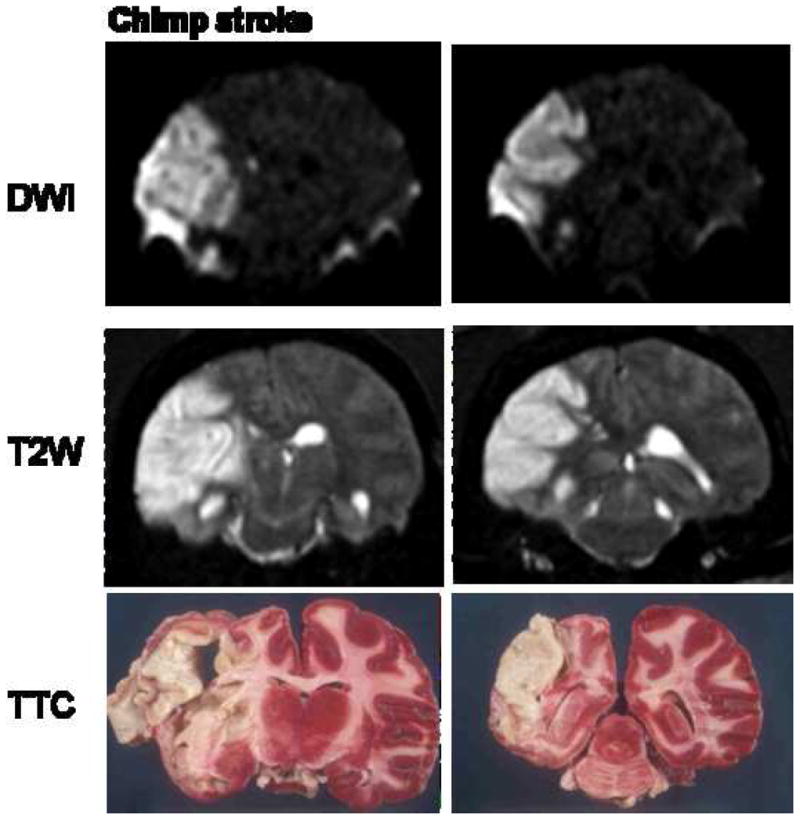
A naturally occurring stroke in a chimpanzee. High intensity lesion was detected over left middle cerebral artery territory. This includes left temporal (inferior and middle temporal artery), left frontal (operculum artery) and left basal ganglia (perforators from M1).
Interestingly, in addition to stroke pathology, histological analysis showed tauopathy with paired helical filaments in an aged chimpanzee (Figure 14) (80). The neurodegenerative tauopathies are typified by the intracellular aggregation of hyperphosphorylated microtubule associated protein tau and the dysfunction and death of affected neurons. The neurofibrillary tangles consisted of tauimmunoreactive paired helical filaments with a diameter and helical periodicity indistinguishable from those of Alzheimer’s disease. A moderate degree of Aβ deposition was present in the cerebral vasculature and in senile plaques. The co-presence of paired helical filaments and Aβ-amyloidosis indicates that the molecular mechanisms for the pathogenesis of the two canonical Alzheimer lesions – neurofibrillary tangles and senile plaques – are present in aged chimpanzees. This is the first documented case of tauopathy with helical filaments in NHP. Given Alzheimer’s disease is considered uniquely, these findings compel us to reconsider the assumption that humans are the only primates to manifest Alzheimer-like tauopathy with age.
Figure 14.
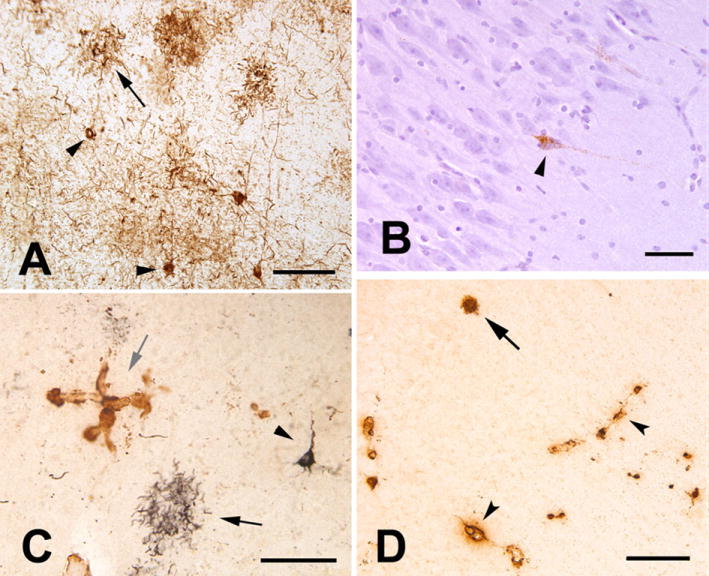
Tau and Aβ pathology in the aged chimpanzee. A: Tauimmunoreactive somata (two indicated by arrowheads) and neuritic tau plaques (one indicated by arrow) in the left prefrontal cortex. Numerous tau-immunoreactive processes (threads) occupy the intervening neuropil. Antibody AT8. B: Tau-immunoreactive neuron (arrowhead) in area CA1 of the right hippocampus; note the integrity of the nearby pyramidal cells. Antibody AT8, hematoxylin counterstain. C: Double-immunostained section showing tau (CP13/nickel-DAB, black, developed first) and Aβ (R398/DAB, brown) immunoreactivity in the left prefrontal cortex. A tau plaque (black arrow) and a taupositive pyramidal neuron (arrowhead) are present. A focus of Aβ-immunoreactive CAA is indicated by the gray arrow. D: Cerebral amyloid angiopathy (arrowheads denote two blood vessels) and a senile plaque (arrow) in the right temporal neocortex. Antibody 6E10. Scale bars 100 μm in A,C; 50 μm in B; 200 μm in D. (80) [Copyright permission in progress]
6) CONCLUDING REMARKS
This review summarizes recent development and application of MRI to study NHP brains. Non-invasive MRI can clearly provide clinically useful structural, physiological and functional data in a single setting at very high spatiotemporal resolution. There are however some significant challenges in carrying out MRI studies on NHP. The main challenges are associated with 1) the need for anesthetized preparations which preclude many fMRI studies of cognitive functions, and 2) the use of human scanners which are suboptimal for NHP due to size differences. We anticipate that continuing advances in MRI technologies, such as improving custom-made RF coil detectors and gradient capabilities, will improve and expand NHP MRI applications.
Acknowledgments
This work is funded in part by the American Heart Association’s Established Investigator Award EIA 0940104N. The author would like to thank Drs. Frank Tong, Yoji Tanaka, Tsukasa Nagaoka and Xiaodong Zhang, and the Yerkes Vet team, for their contributions to the stroke project from which Figure 11 was derived. I would also like to thank Drs. Helen D’Arceuil and Alex de Crespigny for numerous discussions on the NHP stroke project.
ABBREVIATIONS
- ADC
apparent diffusion coefficient
- ASL
arterial spin labeling
- BOLD
blood oxygenation level dependent
- cASL
continuous arterial spin labeling
- CBF
cerebral blood flow
- DWI
diffusion weighted imaging
- DTI
diffusion tensor imaging
- EPI
echo planar imaging
- FA
fractional anisotropy
- fMRI
functional MRI
- FOV
field of view
- Gd-DTPA
gadolinium-diethylene-tri-amine-pentaacetic acid
- MRI
magnetic resonance imaging
- NHP
nonhuman primate
- RF
radiofrequency
- SNR
signal-to-noise ratio
- T1
spin-lattice relaxation time
- T2
spin-spin relaxation time
Footnotes
Invited review, Special Issue in METHODS, edited by Dr. Chris Kroenke
Publisher's Disclaimer: This is a PDF file of an unedited manuscript that has been accepted for publication. As a service to our customers we are providing this early version of the manuscript. The manuscript will undergo copyediting, typesetting, and review of the resulting proof before it is published in its final citable form. Please note that during the production process errors may be discovered which could affect the content, and all legal disclaimers that apply to the journal pertain.
References
- 1.Logothetis NK, Pauls J, Augath M, Trinath T, Oeltermann A. Nature. 2001;412:150–57. doi: 10.1038/35084005. [DOI] [PubMed] [Google Scholar]
- 2.Logothetis NK. Philos Trans R Soc Lond B Biol Sci. 2002;357:1003–37. doi: 10.1098/rstb.2002.1114. [DOI] [PMC free article] [PubMed] [Google Scholar]
- 3.Andersen AH, Zhang Z, Barber T, Rayens WS, Zhang J, Grondin R, Hardy P, Gerhardt GA, Gash DM. J Neurosci Methods. 2002;118:141–52. doi: 10.1016/s0165-0270(02)00123-1. [DOI] [PubMed] [Google Scholar]
- 4.Leite FP, Tsao D, Vanduffel W, Fize D, Sasaki Y, Wald LL, Dale AM, Kwong KK, Orban GA, Rosen BR, Tootell RB, Mandeville JB. Neuroimage. 2002;16:283–94. doi: 10.1006/nimg.2002.1110. [DOI] [PubMed] [Google Scholar]
- 5.Logothetis NK, Guggenberger H, Peled S, Pauls J. Nature Neuroscience. 1999;2:555–62. doi: 10.1038/9210. [DOI] [PubMed] [Google Scholar]
- 6.Gamlin PD, Ward MK, Bolding MS, Grossmann JK, Twieg DB. Methods. 2006;38:210–20. doi: 10.1016/j.ymeth.2005.08.004. [DOI] [PubMed] [Google Scholar]
- 7.Vanduffel W, Fize D, Mandeville JB, Nelissen K, Van Hecke P, Rosen BR, Tootell RB, Orban GA. Neuron. 2001;32:565–77. doi: 10.1016/s0896-6273(01)00502-5. [DOI] [PubMed] [Google Scholar]
- 8.Ferris CF, Snowdon CT, King JA, Duong TQ, Ziegler TE, Ugurbil K, Ludwig R, Schultz-Darken NJ, Wu Z, Olson DP, Sullivan JM, Jr, Tannenbaum PL, Vaughan JT. Neuroreport. 2001;12:2231–6. doi: 10.1097/00001756-200107200-00037. [DOI] [PubMed] [Google Scholar]
- 9.Ferris CF, Snowdon CT, King JA, Sullivan JM, Jr, Ziegler TE, Olson DP, Schultz-Darken NJ, Tannenbaum PL, Ludwig R, Wu Z, Einspanier A, Vaughan JT, Duong TQ. J Magn Reson Imaging. 2004;19:168–75. doi: 10.1002/jmri.10456. [DOI] [PMC free article] [PubMed] [Google Scholar]
- 10.Zhang X, Nagaoka T, Auerbach EJ, Champion R, Zhou L, Hu X, Duong TQ. Neuroimage. 2007;34:1074–83. doi: 10.1016/j.neuroimage.2006.10.011. [DOI] [PMC free article] [PubMed] [Google Scholar]
- 11.Stephan H, Frahm H, Baron G. Folia Primatol (Basel) 1981;35:1–29. doi: 10.1159/000155963. [DOI] [PubMed] [Google Scholar]
- 12.Stelkis H, Erwin J. Comparative Primate Biology. Alan R. Liss; New York: 1988. [Google Scholar]
- 13.Lamberton F, Delcroix N, Grenier D, Mazoyer B, Joliot M, Priest AN, De Vita E, Thomas DL, Ordidge RJ, Reber PJ, Wong EC, Buxton RB, Frank LR. J Magn Reson Imaging. 2007;26:747–55. doi: 10.1002/jmri.21039. [DOI] [PubMed] [Google Scholar]
- 14.Reber PJ, Wong EC, Buxton RB, Frank LR. Magn Reson Med. 1998;39:328–30. doi: 10.1002/mrm.1910390223. [DOI] [PubMed] [Google Scholar]
- 15.Liu G, Ogawa S. J Magn Reson Imaging. 2006;24:683–9. doi: 10.1002/jmri.20672. [DOI] [PubMed] [Google Scholar]
- 16.Pruessmann KP. Top Magn Reson Imaging. 2004;15:237–44. doi: 10.1097/01.rmr.0000139297.66742.4e. [DOI] [PubMed] [Google Scholar]
- 17.Basser PJ, Mattiello J, LeBihan D. Biophys J. 1994;66:259–67. doi: 10.1016/S0006-3495(94)80775-1. [DOI] [PMC free article] [PubMed] [Google Scholar]
- 18.Basser PJ, Mattiello J, LeBihan D. J Magn Reson B. 1994;103:247–54. doi: 10.1006/jmrb.1994.1037. [DOI] [PubMed] [Google Scholar]
- 19.Mori K. Current Opinion in Neurobiology. 1995;5:467–74. doi: 10.1016/0959-4388(95)80007-7. [DOI] [PubMed] [Google Scholar]
- 20.Xue R, van Zijl PC, Crain BJ, Solaiyappan M, Mori S. Magn Reson Med. 1999;42:1123–7. doi: 10.1002/(sici)1522-2594(199912)42:6<1123::aid-mrm17>3.0.co;2-h. [DOI] [PubMed] [Google Scholar]
- 21.Nakada T, Matsuzawa H. Neurosci Res. 1995;22:389–98. doi: 10.1016/0168-0102(95)00917-i. [DOI] [PubMed] [Google Scholar]
- 22.Makris N, Worth AJ, Sorensen AG, Papadimitriou GM, Wu O, Reese TG, Wedeen VJ, Davis TL, Stakes JW, Caviness VS, Kaplan E, Rosen BR, Pandya DN, Kennedy DN. Ann Neurol. 1997;42:951–62. doi: 10.1002/ana.410420617. [DOI] [PubMed] [Google Scholar]
- 23.Zhang J, van Zijl PC, Mori S. Neuroimage. 2002;15:892–901. doi: 10.1006/nimg.2001.1012. [DOI] [PubMed] [Google Scholar]
- 24.Mori S, Itoh R, Zhang J, Kaufmann WE, van Zijl PC, Solaiyappan M, Yarowsky P. Magn Reson Med. 2001;46:18–23. doi: 10.1002/mrm.1155. [DOI] [PubMed] [Google Scholar]
- 25.Mori S, Itoh R, Kaufmann WE, van Zijl PCM, Solaiyappan M, Yarowsky P. Magn reson med. 2001;46:18–23. doi: 10.1002/mrm.1155. [DOI] [PubMed] [Google Scholar]
- 26.Le Bihan D, Turner R, Douek P. Neuroreport. 1993;4:887–90. doi: 10.1097/00001756-199307000-00012. [DOI] [PubMed] [Google Scholar]
- 27.Beaulieu C, Allen PS. Magn Reson Med. 1994;31:394–400. doi: 10.1002/mrm.1910310408. [DOI] [PubMed] [Google Scholar]
- 28.Wimberger DM, Roberts TP, Barkovich AJ, Prayer LM, Moseley ME, Kucharczyk J. J Comput Assist Tomogr. 1995;19:28–33. doi: 10.1097/00004728-199501000-00005. [DOI] [PubMed] [Google Scholar]
- 29.Prayer D, Roberts T, Barkovich AJ, Prayer L, Kucharczyk J, Moseley M, Arieff A. Neuroradiology. 1997;39:320–5. doi: 10.1007/s002340050416. [DOI] [PubMed] [Google Scholar]
- 30.Neil JJ, Shiran SI, McKinstry RC, Schefft GL, Snyder AZ, Almli CR, Akbudak E, Aronovitz JA, Miller JP, Lee BC, Conturo TE. Radiology. 1998;209:57–66. doi: 10.1148/radiology.209.1.9769812. [DOI] [PubMed] [Google Scholar]
- 31.Guo AC, Petrella JR, Kurtzberg J, Provenzale JM. Radiology. 2001;218:809–15. doi: 10.1148/radiology.218.3.r01mr14809. [DOI] [PubMed] [Google Scholar]
- 32.Larsson EM, Englund E, Sjobeck M, Latt J, Brockstedt S. Dement Geriatr Cogn Disord. 2004;17:316–9. doi: 10.1159/000077162. [DOI] [PubMed] [Google Scholar]
- 33.D’Arceuil H, de Crespigny A. Neuroimage. 2007;36:64–8. doi: 10.1016/j.neuroimage.2007.02.039. [DOI] [PMC free article] [PubMed] [Google Scholar]
- 34.Dauguet J, Peled S, Berezovskii V, Delzescaux T, Warfield SK, Born R, Westin CF. Neuroimage. 2007;37:530–8. doi: 10.1016/j.neuroimage.2007.04.067. [DOI] [PubMed] [Google Scholar]
- 35.Hofer S, Merboldt KD, Tammer R, Frahm J. Cereb Cortex. 2008;18:1079–84. doi: 10.1093/cercor/bhm141. [DOI] [PubMed] [Google Scholar]
- 36.Liu X, Zhu T, Gu T, Zhong J. Magn Reson Imaging. 2008 doi: 10.1016/j.mri.2008.07.004. [DOI] [PubMed] [Google Scholar]
- 37.Schmahmann JD, Pandya DN, Wang R, Dai G, D’Arceuil HE, de Crespigny AJ, Wedeen VJ. Brain. 2007;130:630–53. doi: 10.1093/brain/awl359. [DOI] [PubMed] [Google Scholar]
- 38.Kroenke CD, Bretthorst GL, Inder TE, Neil JJ. Neuroimage. 2005;25:1205–13. doi: 10.1016/j.neuroimage.2004.12.045. [DOI] [PubMed] [Google Scholar]
- 39.Kroenke CD, Bretthorst GL, Inder TE, Neil JJ. Magn Reson Med. 2006;55:187–97. doi: 10.1002/mrm.20728. [DOI] [PubMed] [Google Scholar]
- 40.Kroenke CD, Van Essen DC, Inder TE, Rees S, Bretthorst GL, Neil JJ. J Neurosci. 2007;27:12506–15. doi: 10.1523/JNEUROSCI.3063-07.2007. [DOI] [PMC free article] [PubMed] [Google Scholar]
- 41.Makris N, Papadimitriou GM, van der Kouwe A, Kennedy DN, Hodge SM, Dale AM, Benner T, Wald LL, Wu O, Tuch DS, Caviness VS, Moore TL, Killiany RJ, Moss MB, Rosene DL. Neurobiol Aging. 2007;28:1556–67. doi: 10.1016/j.neurobiolaging.2006.07.005. [DOI] [PubMed] [Google Scholar]
- 42.Parker GJ, Stephan KE, Barker GJ, Rowe JB, MacManus DG, Wheeler-Kingshott CA, Ciccarelli O, Passingham RE, Spinks RL, Lemon RN, Turner R. Neuroimage. 2002;15:797–809. doi: 10.1006/nimg.2001.0994. [DOI] [PubMed] [Google Scholar]
- 43.D’Arceuil HE, Westmoreland S, de Crespigny AJ. Neuroimage. 2007;35:553–65. doi: 10.1016/j.neuroimage.2006.12.028. [DOI] [PubMed] [Google Scholar]
- 44.Rilling JK, Glasser MF, Preuss TM, Ma X, Zhao T, Hu X, Behrens TE. Nat Neurosci. 2008;11:426–8. doi: 10.1038/nn2072. [DOI] [PubMed] [Google Scholar]
- 45.Wedeen VJ, Wang RP, Schmahmann JD, Benner T, Tseng WY, Dai G, Pandya DN, Hagmann P, D’Arceuil H, de Crespigny AJ. Neuroimage. 2008;41:1267–77. doi: 10.1016/j.neuroimage.2008.03.036. [DOI] [PubMed] [Google Scholar]
- 46.Duong TQ, Kim DS, Ugurbil K, Kim SG. Proc Natl Acad Sci USA. 2001;98:10904–09. doi: 10.1073/pnas.191101098. [DOI] [PMC free article] [PubMed] [Google Scholar]
- 47.Barbier EL, Lamalle L, Decorps M. J Magn Reson Imaging. 2001;13:496–520. doi: 10.1002/jmri.1073. [DOI] [PubMed] [Google Scholar]
- 48.Davis TL, Kwong KK, Weisskoff RM, Rosen BR. Proc Natl Acad Sci USA. 1998;95:1834–39. doi: 10.1073/pnas.95.4.1834. [DOI] [PMC free article] [PubMed] [Google Scholar]
- 49.Kim SG, Ugurbil K. Magn Reson Med. 1997;38:59–65. doi: 10.1002/mrm.1910380110. [DOI] [PubMed] [Google Scholar]
- 50.Hoge RD, Atkinson J, Gill B, Crelier GR, Marrett S, Pike GB. Proc Natl Acad Sci. 1999;96:9403–08. doi: 10.1073/pnas.96.16.9403. [DOI] [PMC free article] [PubMed] [Google Scholar]
- 51.Calamante F, Thomas DL, Pell GS, Wiersma J, Turner R. J Cereb Blood Flow Metab. 1999;19:701–35. doi: 10.1097/00004647-199907000-00001. [DOI] [PubMed] [Google Scholar]
- 52.Wong EC, Buxton RB, Frank LR. Magn Reson Med. 1998;39:702–08. doi: 10.1002/mrm.1910390506. [DOI] [PubMed] [Google Scholar]
- 53.Wang J, Zhang Y, Wolf RL, Roc AC, Alsop DC, Detre JA. Radiology. 2005;235:218–28. doi: 10.1148/radiol.2351031663. [DOI] [PubMed] [Google Scholar]
- 54.Detre JA, Zhang W, Roberts DA, Silva AC, Williams DS, Grandis DJ, Koretsky AP, Leigh JS. NMR in Biomed. 1994;7:75–82. doi: 10.1002/nbm.1940070112. [DOI] [PubMed] [Google Scholar]
- 55.Silva AC, Zhang W, Williams DS, Koretsky AP. Magn Reson Med. 1995;33:209–14. doi: 10.1002/mrm.1910330210. [DOI] [PubMed] [Google Scholar]
- 56.Zaharchuk G, Ledden PJ, Kwong KK, Reese TG, Rosen BR, Wald LL. Magn Reson Med. 1999;41:1093–98. doi: 10.1002/(sici)1522-2594(199906)41:6<1093::aid-mrm4>3.0.co;2-0. [DOI] [PubMed] [Google Scholar]
- 57.Talagala SL, Ye FQ, Ledden PJ, Chesnick S. Magn Reson Med. 2004;52:131–40. doi: 10.1002/mrm.20124. [DOI] [PubMed] [Google Scholar]
- 58.Kim SG. Magn Reson Med. 1995;34:293–301. doi: 10.1002/mrm.1910340303. [DOI] [PubMed] [Google Scholar]
- 59.Silva A, Lee SP, Yang C, Iadecola C, Kim S-G. J Cereb Blood Flow Metab. 1999;19:871–79. doi: 10.1097/00004647-199908000-00006. [DOI] [PubMed] [Google Scholar]
- 60.Duong TQ, Silva AC, Lee SP, Kim SG. Magn Reson Med. 2000;43:383–92. doi: 10.1002/(sici)1522-2594(200003)43:3<383::aid-mrm10>3.0.co;2-q. [DOI] [PubMed] [Google Scholar]
- 61.Zhang W, Silva A, Williams D, Koretsky A. Magn Reson Med. 1995;33:370–76. doi: 10.1002/mrm.1910330310. [DOI] [PubMed] [Google Scholar]
- 62.Ye FQ, Frank JA, Weinberger DR, McLaughlin AC. Magn Reson Med. 2000;44:1236–49. doi: 10.1002/1522-2594(200007)44:1<92::aid-mrm14>3.0.co;2-m. [DOI] [PubMed] [Google Scholar]
- 63.Pedersen M, Klarhofer M, Christensen S, Ouallet JC, Ostergaard L, Dousset V, Moonen C. J Mag Reson Imaging. 2004;20:930–40. doi: 10.1002/jmri.20206. [DOI] [PubMed] [Google Scholar]
- 64.Ye FQ, Berman KF, Ellmore T, Esposito G, van Horn JD, Yang Y, Duyn J, Smith AM, Frank JA, Weinberger DR, McLaughlin AC. Magn Reson Med. 2000;44:450–56. doi: 10.1002/1522-2594(200009)44:3<450::aid-mrm16>3.0.co;2-0. [DOI] [PubMed] [Google Scholar]
- 65.Kudomi N, Hayashi T, Teramoto N, Watabe H, Kawachi N, Ohta Y, Kim KM, Iida H. J Cereb Blood Flow and Metab. 2005;25:1209–24. doi: 10.1038/sj.jcbfm.9600118. [DOI] [PubMed] [Google Scholar]
- 66.Enlund M, Andersson J, Hartvig P, Valtysson J, Wiklund L. Acta Anaesthesiol Scand. 1997;41:1002–10. doi: 10.1111/j.1399-6576.1997.tb04827.x. [DOI] [PubMed] [Google Scholar]
- 67.Sicard KM, Duong TQ. NeuroImage. 2005;25:850–58. doi: 10.1016/j.neuroimage.2004.12.010. [DOI] [PMC free article] [PubMed] [Google Scholar]
- 68.Sicard K, Shen Q, Brevard ME, Sullivan R, Ferris CF, King JA, Duong TQ. J Cereb Blood Flow Metab. 2003;23:472–81. doi: 10.1097/01.WCB.0000054755.93668.20. [DOI] [PMC free article] [PubMed] [Google Scholar]
- 69.Zappe AC, Reichold J, Burger C, Weber B, Buck A, Pfeuffer J, Logothetis NK. Magn Reson Imaging. 2007;25:775–83. doi: 10.1016/j.mri.2006.11.028. [DOI] [PubMed] [Google Scholar]
- 70.Zappe AC, Pfeuffer J, Merkle H, Logothetis NK, Goense JB. J Cereb Blood Flow Metab. 2007 doi: 10.1038/sj.jcbfm.9600564. [DOI] [PubMed] [Google Scholar]
- 71.Mack WJ, Komotar RJ, Mocco J, Coon AL, Hoh DJ, King RG, Ducruet AF, Ransom ER, Oppermann M, DeLaPaz R, Connolly ES., Jr Neurol Res. 2003;25:846–52. doi: 10.1179/016164103771953943. [DOI] [PubMed] [Google Scholar]
- 72.D’Ambrosio AL, Sughrue ME, Mocco J, Mack WJ, King RG, Agarwal S, Connolly ES., Jr Methods Enzymol. 2004;386:60–73. doi: 10.1016/S0076-6879(04)86002-6. [DOI] [PubMed] [Google Scholar]
- 73.Huang J, Mocco J, Choudhri TF, Poisik A, Popilskis SJ, Emerson R, DelaPaz RL, Khandji AG, Pinsky DJ, Connolly ES., Jr Stroke. 2000;31:3054–63. doi: 10.1161/01.str.31.12.3054. [DOI] [PubMed] [Google Scholar]
- 74.Coon AL, Arias-Mendoza F, Colby GP, Cruz-Lobo J, Mocco J, Mack WJ, Komotar RJ, Brown TR, Connolly ES., Jr AJNR Am J Neuroradiol. 2006;27:1053–8. [PMC free article] [PubMed] [Google Scholar]
- 75.Liu Y, D’Arceuil HE, Westmoreland S, He J, Duggan M, Gonzalez RG, Pryor J, de Crespigny AJ. Stroke. 2007;38:138–45. doi: 10.1161/01.STR.0000252127.07428.9c. [DOI] [PubMed] [Google Scholar]
- 76.Shen Q, Meng X, Fisher M, Sotak CH, Duong TQ. J Cereb Blood Flow and Metab. 2003;23:1479–88. doi: 10.1097/01.WCB.0000100064.36077.03. [DOI] [PMC free article] [PubMed] [Google Scholar]
- 77.Meng X, Fisher M, Shen Q, Sotak CH, Duong TQ. Ann Neurol. 2004;55:207–12. doi: 10.1002/ana.10803. [DOI] [PMC free article] [PubMed] [Google Scholar]
- 78.Warach S, Dashe J, Edelman R. J Cereb Blood Flow Metab. 1996;16:53–59. doi: 10.1097/00004647-199601000-00006. [DOI] [PubMed] [Google Scholar]
- 79.Kidwell CS, Alger JR, Saver JL. Stroke. 2003;34:2729–35. doi: 10.1161/01.STR.0000097608.38779.CC. [DOI] [PubMed] [Google Scholar]
- 80.Rosen RF, Farberg AS, Gearing M, Dooyema J, Long PM, Anderson DC, Davis-Turak J, Coppola G, Geschwind DH, Pare JF, Duong TQ, Hopkins WD, Preuss TM, Walker LC. J Comp Neurol. 2008;509:259–70. doi: 10.1002/cne.21744. [DOI] [PMC free article] [PubMed] [Google Scholar]


