

Abstract
Background
Currently, tumor grade is the best predictor of outcome at first presentation of noninvasive papillary (Ta) bladder cancer. However, reliable predictors of Ta tumor recurrence and progression for individual patients, which could optimize treatment and follow-up schedules based on specific tumor biology, are yet to be identified.
Objective
To identify genes predictive for recurrence and progression in Ta bladder cancer at first presentation using a quantitative, pathway-specific approach.
Design, setting, and participants
Retrospective study of patients with Ta G2/3 bladder tumors at initial presentation with three distinct clinical outcomes: absence of recurrence (n = 16), recurrence without progression (n = 16), and progression to carcinoma in situ or invasive disease (n = 16).
Measurements
Expressions of 24 genes that feature in relevant pathways that are deregulated in bladder cancer were quantified by real-time polymerase chain reaction on tumor biopsies from the patients at initial presentation.
Results and limitations
CCND3 (p = 0.003) and HRAS (p = 0.01) were predictive for recurrence by univariate analysis. In a multivariable model based on CCND3 expression, sensitivity and specificity for recurrence were 97% and 63%, respectively. HRAS (p < 0.001), E2F1 (p = 0.017), BIRC5/Survivin (p = 0.038), and VEGFR2 (p = 0.047) were predictive for progression by univariate analysis. Multivariable analysis based on HRAS, VEGFR2, and VEGF identified progression with 81% sensitivity and 94% specificity. Since this is a small retrospective study using medium-throughput profiling, larger confirmatory studies are needed.
Conclusions
Gene expression profiling across relevant cancer pathways appears to be a promising approach for Ta bladder tumor outcome prediction at initial diagnosis. These results could help differentiate between patients who need aggressive versus expectant management.
Keywords: Noninvasive urothelial carcinoma, First presentation, Recurrence, Progression, CCND3, HRAS, E2F1, Survivin, VEGFR2, VEGF
1. Introduction
Urothelial carcinoma (UC) of the urinary bladder is the ninth most common cancer worldwide, accounting for 3% of the global cancer incidence [1]. Most UC cases present at first occurrence as urothelium-confined tumors (noninvasive Ta UC) [2]. After initial diagnosis, some patients with Ta tumors will never have a recurrence, but 50–70% of patients will reexperience a Ta tumor within 5 yr and 10% will progress to invasive disease [3,4]. This diverse biologic behavior compels current guidelines to recommend intense follow-up and invasive treatment [5]. Therefore, it is crucial to determine the recurrence and invasive potential of these tumors. Predicting such behavior is clinically important as invasion bears a significant risk of metastasis and impaired survival [6-8].
While grade and number of foci are the best estimators of subsequent Ta tumor behavior at first diagnosis [4], they are relatively imprecise measures for an individual patient. For monitoring, traditional noninvasive tests have clear limitations and the more reliable invasive techniques such as cystoscopy and biopsy cause patient discomfort and incur substantial costs [9]. Despite efforts to identify molecular markers, no single determinant has changed clinical management of Ta tumors. This study used a pathway-specific approach to profile 24 genes using real-time quantitative reverse transcriptase-polymerase chain reaction (qRT-PCR) in primary Ta G2/3 UC tumor biopsies. This unique cohort was composed of frozen primary UC tissues obtained at first presentation from three equally-sized patient groups with noninvasive papillary tumors who (1) did not recur after long-term follow-up, (2) recurred locally without progressing after long-term follow-up, and (3) later progressed to carcinoma in situ (CIS) or higher stage. While we recognize that tumorigenesis involves accumulation of several genetic mutations over time [10], the purpose of this study was to examine if molecular alterations in primary UC tumors at the time of first overt clinical presentation can predict eventual recurrence and/or progression.
2. Patients and methods
2.1. Patient cohort
The entire study population consisted of 177 patients diagnosed with first occurrence of Ta G2/3 UC at Herlev Hospital, University of Copenhagen, Denmark, between March 1993 and November 2004. Tumors were staged and graded according to standard criteria [11,12]. The study cohort included three groups (n = 16 each) based on distinct clinical outcomes: group 1 included patients without recurrence; group 2 included patients with recurrence but without progression; group 3 included patients with progression. Recurrence was defined as one or more relapses of Ta tumor without CIS after initial presentation. Progression was defined as one or more relapses after initial presentation where CIS or invasive disease (T1 or higher) was identified. Follow-up was at least 5 yr in the first two groups (median: 7.9 yr). In addition to first tumor occurrence and the minimum follow-up period, other inclusion criteria were absence of concomitant CIS, and no administration of systemic or intravesical immuno- or chemotherapy at first presentation. Twenty-three, 39, and 16 patients met the inclusion criteria for the three groups, respectively; 16 patients were randomly selected from the first two groups to achieve equally sized subcohorts.
Cold-cup biopsies were taken during white-light cystoscopy at initial tumor occurrence prior to any intervention. Cold-cup biopsies were preferred over transurethral resection of bladder tumor (TURBT) samples for RNA extraction to ensure exclusive tumor content and avoid thermal artifacts that could potentially compromise RNA quality [13]. Samples were frozen, embedded in optimal cutting temperature compound, and stored at −80°C. All patients were treated with TURBT alone at initial presentation. Random quadrant biopsies were taken in all cases; three patients in group 3 had concomitant Ta tumors. Patients were followed by cystoscopy and cytology every 3 mo in the first year. If tumors did not recur, patients were then followed by cystoscopy every 6–12 mo for at least 5 yr.
The study was approved by the respective institutional review boards. Informed consent was obtained in all cases.
2.2. Expression profiling
Twenty-four genes that feature in biologically relevant cellular processes in bladder and other cancer types and that are associated with major pathways in the Kyoto Encyclopedia of Genes and Genomes (KEGG) were chosen for analysis (Fig. 1) [14-18]. Gene expression levels were analyzed by qRT-PCR from each biopsy specimen blinded to patient history and clinicopathologic information (Table 1).
Fig. 1. Kyoto Encyclopedia of Genes and Genomes (KEGG) pathways associated with genes included in the analysis.
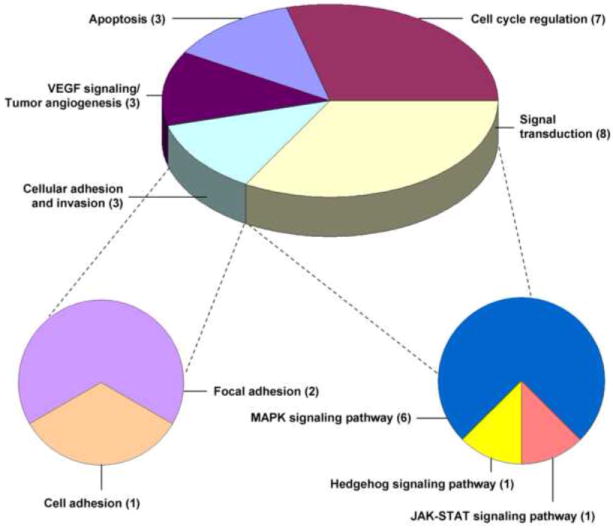
Signal transduction includes the mitogen-activated protein kinase (MAPK), Hedgehog, and Janus kinase (JAK)–signal transducer and activator of transcription (STAT) signaling pathways. Cellular adhesion and invasion includes the focal and cell adhesion pathways. Numbers in parentheses indicate the number of genes associated with each major pathway.
VEGF = vascular endothelial growth factor.
Table 1.
Genes profiled in study cohort
| Gene (and associated major KEGG pathway) | Full name | GeneID |
|---|---|---|
| ANXA5a | annexin A5 | 308 |
| BCL2L1a | B-cell CLL/lymphoma 2-like 1 | 598 |
| BIRC5 / Survivina | baculoviral IAP repeat-containing 5 | 332 |
| BMP6b | bone morphogenetic protein 6 | 654 |
| CCND3c | cyclin D3 | 896 |
| CDK8c | cyclin-dependent kinase 8 | 1024 |
| CDKN1Ac | cyclin-dependent kinase inhibitor 1A (p21, Cip1) | 1026 |
| CDKN2Ac | cyclin-dependent kinase inhibitor 2A | 1029 |
| E2F1c | E2F transcription factor 1 | 1869 |
| ERBB2d | v-erb-b2 erythroblastic leukemia viral oncogene homolog 2 | 2064 |
| FGFR3e | fibroblast growth factor receptor 3 | 2261 |
| HRASe | v-Ha-ras Harvey rat sarcoma viral oncogene homolog | 3265 |
| ICAM1f | intercellular adhesion molecule 1 | 3383 |
| IGF1d | insulin-like growth factor 1 | 3479 |
| JUNe | jun oncogene | 3725 |
| MAP2K6e | mitogen-activated protein kinase kinase 6 | 5608 |
| MYCe | v-myc myelocytomatosis viral oncogene homolog | 4609 |
| NFKB1e | nuclear factor of kappa light polypeptide gene enhancer in B-cells 1 | 4790 |
| PDGFRLg | platelet-derived growth factor receptor-like | 5157 |
| RB1c | retinoblastoma 1 | 5925 |
| STAT3h | signal transducer and activator of transcription 3 | 6774 |
| TP53c | tumor protein p53 | 7157 |
| VEGFg | vascular endothelial growth factor A | 7422 |
| VEGFR2g | kinase insert domain receptor | 3791 |
| TBPi,k | TATA box binding protein | 6908 |
| SDHAj,k | succinate dehydrogenase complex, subunit A, flavoprotein (Fp) | 6389 |
KEGG = Kyoto Encyclopedia of Genes and Genomes; MAPK = mitogen-activated protein kinase.
Major KEGG pathway:
Apoptosis.
Hedgehog signaling pathway.
Cell-cycle regulation.
Focal adhesion.
MAPK signaling pathway.
Cell adhesion.
VEGF signaling/tumor angiogenesis.
Jak-STAT signaling pathway.
Basal transcription factor.
Citrate cycle.
Reference gene.
Presence of at least 90% UC tissue in each specimen was confirmed on hematoxylin and eosin-stained slides. Embedded tissues were sectioned and RNA extracted using the Bio-Rad PureZOL RNA isolation kit (Bio-Rad Laboratories, Inc., Hercules, CA, USA) following manufacturer s instructions. RNA yield and purity were determined by A254 optical density measurements and A254/280 and A254/230 ratios. After complementary DNA synthesis using the Bio-Rad iScript kit, an RT-PCR for β-actin with product visualization on agarose gel was performed. Quantitative RT-PCR reactions were performed on the Stratagene Mx3000P thermocycler (Stratagene, La Jolla, CA, USA) with TaqMan Expression assays (Biosearch Technologies, Novato, CA, USA). Primers and probes were designed using Primer Express 2.0 (Applied Biosystems, Foster City, CA, USA) or obtained from published literature [19,20], and crossed at least one intron–exon junction, thereby minimizing amplification of contaminating genomic DNA. Expression levels were normalized against TBP and SDHA, which are constitutively expressed genes that are appropriate qRT-PCR reference transcripts for UC [19]. All measurements were made in triplicates. For each primer–pair/probe combination, reaction efficiency estimates were derived from standard curves generated using serial dilutions of RNA from the RT4 cell line. Efficiencies were between 89% and 104% and between 94% and 95% for interrogated and reference genes, respectively. Relative quantification (ΔΔCt) was employed to normalize raw Ct values using the geometric mean of expression of both reference genes [21]. Thus, transcript expressions were reported as fold changes compared to the reference genes, and were quantitative and reproducible.
2.3. Statistics and outcome analysis
Univariate analysis was performed using Wilcoxon rank-sum test in three steps. First, differences in expression levels of each individual gene among the three groups were evaluated. Second, to identify associations with recurrence, patients without recurrence (group 1) were compared to patients with recurrence (without/with progression; groups 2 and 3). Third, to identify associations with progression, patients without progression (without/with recurrence; groups 1 and 2) were compared to patients with progression (group 3) (Fig. 2). The permutation method was used to obtain p values adjusted for multiple testing [22]. To identify genes that, in combination, could predict recurrence or progression, a multivariable, nonparametric, recursive partitioning (RP) analysis was performed. Specifically, a classification and regression tree model using RPART, an S-plus function, was constructed [23]. In this process, the entire cohort was divided into subgroups with the greatest dissimilarities in clinical outcome based on gene expression levels. The trees were validated using 100 bootstrap samples.
Fig. 2. Normalized expression levels of 24 genes in the prognostic subgroups.
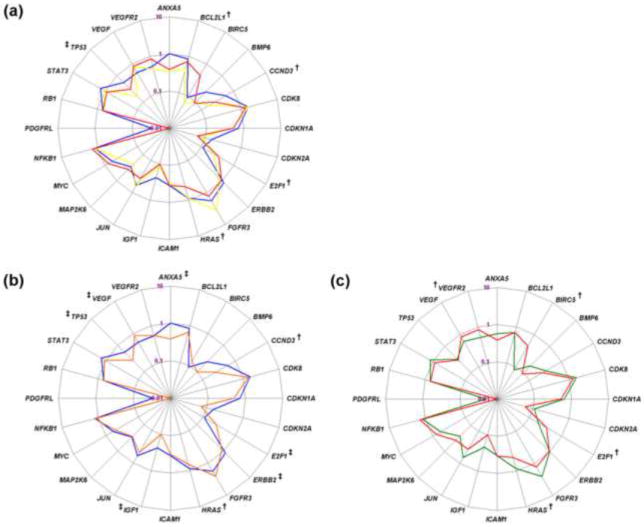
Radar plots show the median relative quantification (ΔΔCt) values of all interrogated genes on a logarithmic scale. Comparisons were made between (a) the individual groups (group 1, blue; group 2, yellow; group 3, red), (b) patients without recurrence (group 1, blue) and with recurrence (groups 2 and 3, orange), and (c) patients without progression (groups 1 and 2, green) and with progression (group 3, red).
†p ≤ 0.050.
‡ 0.050 < p ≤ 0.100.
3. Results
3.1. Clinicopathologic parameters and clinical outcome
The median patient age was 67.5 yr (range: 29–86 yr), and median follow-up was 87.2 mo (range: 10.3–149.6 mo). Median age, tumor grade, and multifocality were comparable across the groups (Table 2). Tumor staging and grading of the subsequent TURBT specimen was identical to biopsy in all cases. Patients in group 2 had a median of four recurrences, with median time to first recurrence of 11.3 mo. Median time to first progression was 31.8 mo (range: 3.3–94.7 mo), including progression to CIS (n = 3), T1 (n = 12), and T3a (n = 1). Median time to first clinically significant event (ie, either recurrence or progression, whichever came first) for group 3 patients was 7.4 mo. At last follow-up, 35 patients were alive, 2 patients in group 3 had died of UC, and 11 patients had died from other causes without evidence of UC.
Table 2.
Clinicopathologic characteristics of patient groups in the study cohort†
| No Recurrence | Recurrence |
|||
|---|---|---|---|---|
| Group 1 (n = 16) | Without progression Group 2 (n = 16) | With progression Group 3 (n = 16) | p value | |
| Gender (%) | 0.025a | |||
| Female | 1 (6) | 7 (44) | 7 (44) | |
| Male | 15 (94) | 9 (56) | 9 (56) | |
| Median age, yr (range) | 66.5 (29–83) | 64.5 (39–76) | 67 (62–86) | 0.38b |
| Tumor grade (%) | 0.47a | |||
| G2 | 14 (88) | 15 (94) | 12 (75) | |
| G3 | 2 (12) | 1 (6) | 4 (25) | |
| Multifocality (%) | 0.11a | |||
| Multifocal | 1 (6) | 0 (0) | 4 (25) | |
| Single tumor | 15 (94) | 16 (100) | 12 (75) | |
| Median follow-up, yr (range) | 7.9 (5.1–12.0) | 8.0 (5.5–12.5) | 5.7 (0.9–10.0) | 0.017b |
| Median no. of recurrences before progression (range) | – | 4 (1–9) | 2.5 (0–7) | 0.035b |
| Median time to first clinically significant event, mo* (95% CI) | – | 11.3 (8.6–43.8) | 7.4 (4.2–12.1) | 0.012c |
| Clinical probability of recurrence§ (%) | – | |||
| Intermediate | 16 (100) | 16 (100) | 16 (100) | |
| Clinical probability of progression§ (%) | 0.051a | |||
| Low | 13 (81) | 15 (94) | 9 (56) | |
| Intermediate to high | 3 (19) | 1 (6) | 7 (44) | |
Event is recurrence for group 2, and recurrence or progression (whichever occurred first) for group 3.
Based on European Organization for Research and Treatment of Cancer Ta T1 bladder cancer risk tables [4].
Fisher exact test.
Wilcoxon rank-sum test.
Log-rank test.
Except for a higher proportion of males in group 1, all groups had comparable demographic and pathologic features.
When clinicopathologic parameters were input into the European Organization for Research and Treatment of Cancer (EORTC) recurrence calculator, all patients scored between 1 and 5, indicating an intermediate risk of recurring (5-yr recurrence probability 46–62%) [4]. When the factors were assessed against the EORTC progression calculator, 37 patients were at low risk for progression while 11 patients were at intermediate-high risk (5-yr progression probability 0.8% vs 6–17%, respectively). The progression calculator labeled four patients who did not eventually progress as candidates at intermediate risk for progression (88% specificity) and nine patients who eventually progressed as low risk candidates (44% sensitivity) (Table 2).
3.2. Comparison of gene expression levels among the three patient groups
Differences in gene expression levels were first evaluated across the individual patient groups. Expression levels were significantly different for HRAS (p = 0.002), CCND3 (p = 0.009), BCL2L1 (p = 0.039), and E2F1 (p = 0.047) and showed a trend towards significance for TP53 (p = 0.051) by univariate analysis (Fig. 3a, Table 3). These genes could therefore independently differentiate among the three outcome categories.
Fig. 3. Distribution of HRAS, CCND3, BCL2L1, E2F1, BIRC5/Survivin, and VEGFR2 relative expression levels in the prognostic subgroups.
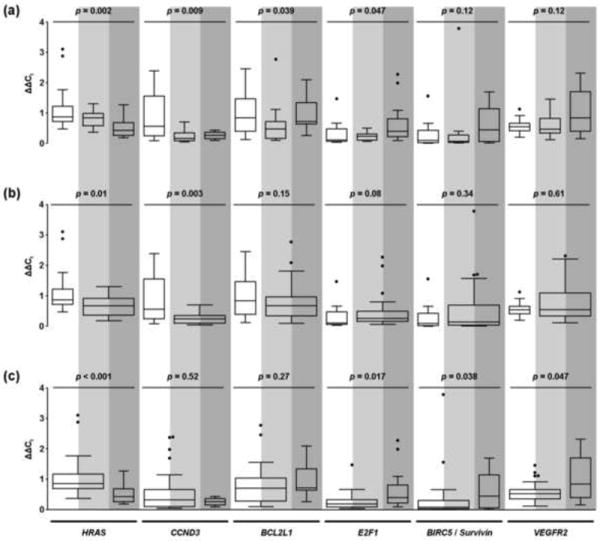
The white, light grey, and dark grey areas denote patient groups 1, 2, and 3, respectively. Tukey boxplots for the six genes are shown (a) across each of the individual prognostic subgroups; (b) in patients with no recurrence (group 1, white area) versus patients with recurrence, without or with progression (groups 2 and 3, light and dark grey areas); and (c) in patients with no progression, without or with recurrence (groups 1 and 2, white and light grey areas) versus patients with progression (group 3, dark grey area). The boxes represent median with interquartile range; whiskers go 1.5 times the interquartile distance or to the highest or lowest point, whichever is shorter. Dots represent outliers.
Table 3.
Differential gene expressions between the individual prognostic groups†
| Individual groups (1 vs 2 vs 3) | No recurrence vs recurrence (1 vs 2 + 3) | No progression vs progression (1 + 2 vs 3) | |||||
|---|---|---|---|---|---|---|---|
| median (range) | p value | median (range) | p value | median (range) | p value | ||
| HRAS | 1 | 0.87 (0.47–3.11) | 0.002* | 0.87 (0.47–3.11) | 0.01 | 0.85 (0.37–3.11) | <0.001* |
| 2 | 0.84 (0.37–1.31) | 0.67 (0.18–1.31) | |||||
| 3 | 0.43 (0.18–1.27) | 0.43 (0.18–1.27) | |||||
| CCND3 | 1 | 0.56 (0.09–2.39) | 0.009 | 0.56 (0.09–2.39) | 0.003* | 0.32 (0.05–2.39) | 0.52 |
| 2 | 0.16 (0.05–0.70) | 0.24 (0.05–0.70) | |||||
| 3 | 0.26 (0.09–0.43) | 0.26 (0.09–0.43) | |||||
| BCL2L1 | 1 | 0.84 (0.12–2.45) | 0.039 | 0.84 (0.12–2.45) | 0.15 | 0.71 (0.10–2.77) | 0.27 |
| 2 | 0.47 (0.10–2.77) | 0.67 (0.10–2.77) | |||||
| 3 | 0.71 (0.26–2.09) | 0.71 (0.26–2.09) | |||||
| E2F1 | 1 | 0.11 (0.04–1.47) | 0.047 | 0.11 (0.04–1.47) | 0.08 | 0.19 (0.04–1.47) | 0.017 |
| 2 | 0.23 (0.07–0.50) | 0.25 (0.00–2.27) | |||||
| 3 | 0.34 (0.00–2.27) | 0.34 (0.00–2.27) | |||||
| BIRC5/Survivin | 1 | 0.09 (0.00–1.56) | 0.12 | 0.09 (0.00–1.56) | 0.34 | 0.08 (0.00–3.78) | 0.038 |
| 2 | 0.06 (0.01–3.78) | 0.14 (0.01–3.78) | |||||
| 3 | 0.44 (0.01–1.69) | 0.44 (0.01–1.69) | |||||
| VEGFR2 | 1 | 0.54 (0.20–1.13) | 0.12 | 0.54 (0.20–1.13) | 0.61 | 0.52 (0.12–1.45) | 0.047 |
| 2 | 0.46 (0.12–1.45) | 0.55 (0.12–2.31) | |||||
| 3 | 0.84 (0.15–2.31) | 0.84 (0.15–2.31) | |||||
Values for median and range are relative quantification (ΔΔCt) values; p values given for univariate analysis with Wilcoxon rank-sum test: Group 1, no recurrence; Group 2, recurrence without progression; Group 3, progression without or with recurrence.
Adjusted p values were significant for HRAS between the individual groups (p = 0.029) and no progression versus progression groups (p = 0.010) and for CCND3 between no recurrence versus recurrence groups (p = 0.053).
3.3. Identification of genes predictive for recurrence
Gene expression levels in patients without recurrence (group 1) were compared with those in patients with recurrence (without/with progression; groups 2 and 3). By univariate analysis, CCND3 (p = 0.003) and HRAS (p = 0.01) were significantly lower in patients with recurrence (Fig. 3b, Table 3). By multivariate RP analysis, CCND3 was an independent predictor of recurrence. Ninety-seven percent of patients who recurred had low CCND3 expression (sensitivity), while 63% of patients without recurrence had high expression levels (specificity) (Fig. 4a). The model proved robust in this cohort with CCND3 appearing in 54% of bootstrap validation samples.
Fig. 4. Recursive partitioning analysis for outcome prediction.
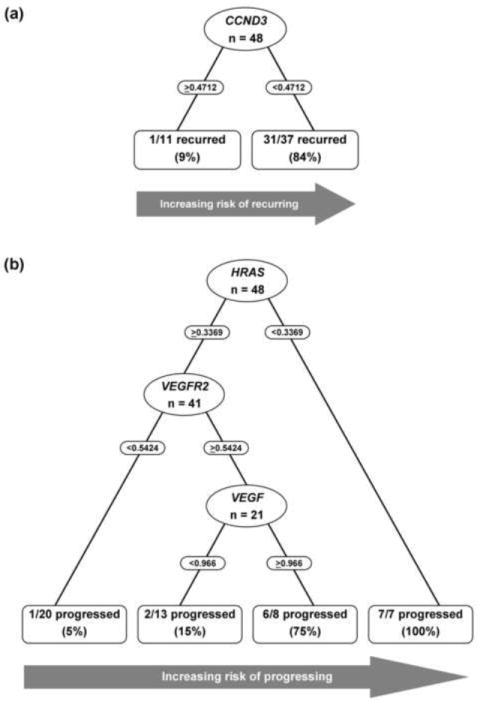
(a) CCND3 expression level with a cut-off value of 0.4712 was identified as a predictor for recurrence. Thirty-one of 32 patients with recurrence and 10 of 16 patients without recurrence were correctly identified. (b) Expression levels of HRAS, VEGFR2, and VEGF were identified as predictors for progression, with cut-off values of 0.3369, 0.5424, and 0.966, respectively. Thirteen of 16 patients with progression and 30 of 32 patients without progression were correctly identified.
3.4. Identification of genes predictive for progression
Gene expression levels in patients without progression (without/with recurrence; groups 1 and 2) were compared to those in patients with progression (group 3). By univariate analysis, progression was significantly associated with decreased HRAS expression (p < 0.001), and increased expression of E2F1 (p = 0.017), BIRC5/Survivin (p = 0.038), and VEGFR2 (p = 0.047) (Fig. 3c, Table 3). In multivariate RP analysis, the first split was based on HRAS expression (Fig. 4b). All patients with low HRAS developed progression. HRAS inclusion in the RP analysis was robust with it being part of 70% of bootstrap samples. Among patients with high HRAS, those with low VEGFR2 had the lowest probability of progression. However, for patients with high HRAS and VEGFR2, VEGF expression provided another tier of discrimination for progression probabilities. In this subgroup, patients with high HRAS, VEGFR2, and VEGF had a 75% probability of progressing, compared with 15% probability in patients with high HRAS and VEGFR2, and low VEGF levels. While these tier additions were compelling, VEGFR2 and VEGF appeared in only 19% and 5% of bootstrap samples, respectively. This model correctly identified 81% of patients with progression (sensitivity) and 94% of patients without progression (specificity).
4. Discussion
This study used a quantitative, reproducible, gene expression profiling approach while choosing an efficient case-control patient-selection design to specifically represent distinct and important clinical outcomes after first occurrences of Ta UC. Two genes were identified by univariate analysis (CCND3, HRAS), one of which was also identified by multivariable analysis (CCND3) to significantly predict recurrence. Four genes were identified by univariate analysis (HRAS, E2F1, BIRC5, VEGFR2) to significantly predict progression; three were also identified by multivariable analysis (HRAS, VEGFR2, VEGF) for this outcome measure. CCND3 and HRAS were particularly robust predictors of recurrence and progression, respectively. Tumors that progressed displayed molecular characteristics of invasive disease at first presentation (ie, activation of angiogenesis and decreased activity of the Ras–mitogen-activated protein kinase pathway). This study therefore identified genes that could, either individually or in combination, significantly predict recurrence (two genes) and progression (five genes) in patients with noninvasive papillary UC at first presentation with high sensitivity and specificity and better than standard clinicopathologic criteria. Current methods have limited reliability in predicting biological behavior of individual Ta UCs at first presentation. Therefore, all patients, especially those with G2/3 tumors, are treated by TURBT, often followed by intravesical therapy; and frequent, expensive, and invasive surveillance procedures. In our study cohort, EORTC risk calculators performed poorly in predicting recurrence, classifying all patients to the same intermediate risk category. It performed better for progression, but still missed most patients who eventually progressed, resulting in modest specificity but low sensitivity. The clinical implications are clear: Reliable identification of patients who will not recur, and more importantly, those who will not progress, can lead to optimization of follow-up schedules and personalization of adjuvant treatment strategies.
Rather than evaluating expression levels between different tumor stages, we sought to identify genes that predicted outcome in a unique cohort that was very homogenous through defined patient selection. We compared patients with similar clinicopathologic characteristics at initial diagnosis who subsequently experienced distinct clinical courses: no recurrence, recurrence without progression, and progression. Due to the treatment regimen followed at time of diagnosis, no patient received systemic, intravesical, or adjuvant therapy at first tumor occurrence. This implies that the genes may not only predict tumor behavior, but can also identify patients who could benefit from additional therapy (ie, those at risk for recurrence or progression).
T1 tumors were excluded because combined analysis of Ta and T1 UC as “superficial” disease is not a valid approach [6,7]. Furthermore, the cohort’s long follow-up ensured that patients in groups 1 and 2 would very likely never recur or progress, respectively. These results support the view that multiple distinct pathways are responsible for the biological behavior of UC [15]. Ta tumors that became invasive harbored molecular alterations characteristic of aggressive behavior at first presentation. They had decreased HRAS and increased VEGF and VEGFR2 expressions. These genetic changes have been associated with invasive tumors [17]. Although the prognostic role of HRAS is unclear, activating mutations are more common in low-grade/low-stage disease than invasive disease [17,24,25]. Intriguingly, while FGFR3 mutations have been documented in Ta tumors [15], we did not observe any significant association of its expression levels with prognosis in our cohort. Activation of proangiogenic factors is a rate-limiting step in neoplastic progression as the tumor develops its own blood supply. In melanoma, ovarian carcinoma, prostate carcinoma, and colon carcinoma, overexpression of VEGF and its receptor VEGFR2 are associated with tumor progression and poor prognosis [26,27]. VEGFR2 is also overexpressed in muscle-invasive and advanced UC [26]. This is also consistent with our findings that VEGFR2 expression is predictive for nodal metastasis in UC [28]. The significant association of survivin expression with Ta UC outcome is also supported by previous studies that show its ability to predict recurrence without controlling for progression as a distinct outcome parameter [20].
The role of cyclin D3 (encoded by CCND3) in Ta/T1 UC progression has been previously demonstrated [29,30]. Our results add an interesting aspect from a biological and mechanistic viewpoint: Decreased CCND3 expression identified patients with recurrence. As activation of this pathway has been linked with invasive disease, we expected a more important role in progression and CCND3 to be decreased in nonrecurrent tumors [31,32]. However, when the three groups were compared individually, the transcription factor E2F1, which is functionally associated with CCND3, was expressed the lowest in nonrecurring tumors (p = 0.047). Thus, although CCND3 is upregulated in nonrecurring tumors, decreased E2F1 may potentially subvert CCND3 activity, making it functionally ineffective. We postulate that in recurring tumors, other cyclin proteins may be overexpressed and compensate for decreased CCND3 expression; additional studies are needed to test this hypothesis.
Our findings are based on a relatively small cohort. However, only a fraction of Ta tumors progress to more aggressive disease. In fact, within our entire clinical cohort of 177 patients, about 10% cases showed progression, which is consistent with other reports [3,4]. This low percentage naturally limited their sample size in our study cohort. Nevertheless, these patients are indeed those who justify the rigid follow-up schedule currently implemented for all Ta cases. Also, while patients with identifiable concomitant CIS were excluded from our cohort, there exists a probability that concomitant CIS foci may have been missed by white-light cystoscopy. While the recent advent of hexyl aminolevulinate fluorescence cystoscopy allows more focused sampling [33], and this is superior to random biopsy [34], it should be noted that none of the significant genes in this study are part of any established CIS-gene expression signature classifier [35], thereby suggesting that these markers are truly prognostic for outcome and not representative of concomitant CIS. Furthermore, while our medium-throughput expression profiling approach was limited in its discovery potential compared with oligonucleotide microarray technology, it is nevertheless more hypothesis-driven, quantitative, and reproducible [36,37].
Given the low rate of Ta UC progression, it is important to identify patients at impending risk. This could also identify the large proportion of patients who do not require aggressive treatment and surveillance.
5. Conclusions
Using biopsies from initial occurrences of noninvasive papillary UC, we quantified expressions of relevant genes in a reproducible fashion and identified a set of transcripts that can predict recurrence and progression at first presentation better than standard clinicopathologic criteria. The multivariable modeling showed promise with high sensitivity and specificity. These findings could affect Ta tumor management, including surveillance frequency, administration of adjuvant treatment, and selection of candidates for expectant approach. While these findings are preliminary and need further validation, this study indicates that the identified genes and their associated pathways may be critical for noninvasive UC prognosis.
Acknowledgments
Funding/Support and role of the sponsor: This study was funded by the National Cancer Institute (NCI P30 CA 14089), National Institutes of Health (CA86871), and the Candy Foundation of the Danish Cancer Society. The funding organizations did not play any role in the study design, data acquisition, management, analysis or interpretation, or in preparation, review or approval of this manuscript. Funding was provided based on the merits of proposal(s) submitted for investigating the molecular pathogenesis of bladder cancer.
The authors thank Dr. Shouying Du for her assistance.
Footnotes
Author contributions: Richard J. Cote had full access to all the data in the study and takes responsibility for the integrity of the data and the accuracy of the data analysis.
Study concept and design: Birkhahn, Mitra, Datar, Groshen, Cote.
Acquisition of data: Birkhahn, Mitra, Williams.
Analysis and interpretation of data: Birkhahn, Mitra, Ye, Groshen, Cote.
Drafting of the manuscript: Birkhahn, Mitra, Williams, Lam, Ye, Datar, Balic, Groshen, Steven, Cote.
Critical revision of the manuscript for important intellectual content: Birkhahn, Mitra, Groshen, Cote.
Statistical analysis: Ye, Groshen.
Obtaining funding: Steven, Cote.
Administrative, technical, or material support: Williams, Lam, Balic, Steven.
Supervision: Datar, Groshen, Steven, Cote.
Other (specify): None.
Financial disclosures: I certify that all conflicts of interest, including specific financial interests and relationships and affiliations relevant to the subject matter or materials discussed in the manuscript (eg, employment/ affiliation, grants or funding, consultancies, honoraria, stock ownership or options, expert testimony, royalties, or patents filed, received, or pending), are the following: None.
Publisher's Disclaimer: This is a PDF file of an unedited manuscript that has been accepted for publication. As a service to our customers we are providing this early version of the manuscript. The manuscript will undergo copyediting, typesetting, and review of the resulting proof before it is published in its final citable form. Please note that during the production process errors may be discovered which could affect the content, and all legal disclaimers that apply to the journal pertain.
References
- 1.Parkin DM, Bray F, Ferlay J, Pisani P. Global cancer statistics, 2002. CA Cancer J Clin. 2005;55:74–108. doi: 10.3322/canjclin.55.2.74. [DOI] [PubMed] [Google Scholar]
- 2.Ro JY, Staerkel GA, Ayala AG. Cytologic and histologic features of superficial bladder cancer. Urol Clin North Am. 1992;19:435–53. [PubMed] [Google Scholar]
- 3.Lutzeyer W, Rubben H, Dahm H. Prognostic parameters in superficial bladder cancer: an analysis of 315 cases. J Urol. 1982;127:250–2. doi: 10.1016/s0022-5347(17)53725-8. [DOI] [PubMed] [Google Scholar]
- 4.Sylvester RJ, van der Meijden AP, Oosterlinck W, et al. Predicting recurrence and progression in individual patients with stage Ta T1 bladder cancer using EORTC risk tables: a combined analysis of 2596 patients from seven EORTC trials. Eur Urol. 2006;49:466–5. doi: 10.1016/j.eururo.2005.12.031. discussion 475–7. [DOI] [PubMed] [Google Scholar]
- 5.Montie JE, Abrahams NA, Bahnson RR, et al. Bladder cancer. Clinical guidelines in oncology. J Natl Compr Canc Netw. 2006;4:984–1014. doi: 10.6004/jnccn.2006.0083. [DOI] [PubMed] [Google Scholar]
- 6.Soloway MS. It is time to abandon the “superficial” in bladder cancer. Eur Urol. 2007;52:1564–5. doi: 10.1016/j.eururo.2007.07.011. [DOI] [PubMed] [Google Scholar]
- 7.Bryan RT, Wallace DM. ‘Superficial’ bladder cancer—time to uncouple pT1 tumours from pTa tumours. BJU Int. 2002;90:846–52. doi: 10.1046/j.1464-410x.2002.03053.x. [DOI] [PubMed] [Google Scholar]
- 8.Fitzpatrick JM. Superficial bladder carcinoma. Factors affecting the natural history. World J Urol. 1993;11:142–7. doi: 10.1007/BF00211408. [DOI] [PubMed] [Google Scholar]
- 9.Carmack AJ, Soloway MS. The diagnosis and staging of bladder cancer: from RBCs to TURs. Urology. 2006;67(suppl 1):3–8. doi: 10.1016/j.urology.2006.01.026. discussion 8-10. [DOI] [PubMed] [Google Scholar]
- 10.Hanahan D, Weinberg RA. The hallmarks of cancer. Cell. 2000;100:57–70. doi: 10.1016/s0092-8674(00)81683-9. [DOI] [PubMed] [Google Scholar]
- 11.Greene FL, Page DL, Fleming ID, et al., editors. Urinary bladder. AJCC cancer staging manual. 6. New York, NY: Springer-Verlag; 2002. pp. 367–74. [Google Scholar]
- 12.Mostofi FK, Sobin HL, Torlini H. Histologic typing of urinary bladder tumors. Geneva, Switzerland: World Health Organization; 1973. [Google Scholar]
- 13.Sharir S, Evans AJ, Gospodarowicz MK, Jewett MAS. Issues in staging of Ta, Tis, T1 bladder cancers. In: Lerner SP, Schoenberg MP, Sternberg CN, editors. Textbook of bladder cancer. Oxon, UK: Taylor & Francis; 2006. pp. 287–95. [Google Scholar]
- 14.Mitra AP, Lin H, Datar RH, Cote RJ. Molecular biology of bladder cancer: prognostic and clinical implications. Clin Genitourin Cancer. 2006;5:67–77. doi: 10.3816/CGC.2006.n.020. [DOI] [PubMed] [Google Scholar]
- 15.Mitra AP, Datar RH, Cote RJ. Molecular pathways in invasive bladder cancer: new insights into mechanisms, progression, and target identification. J Clin Oncol. 2006;24:5552–64. doi: 10.1200/JCO.2006.08.2073. [DOI] [PubMed] [Google Scholar]
- 16.Mitra AP, Lin H, Cote RJ, Datar RH. Biomarker profiling for cancer diagnosis, prognosis and therapeutic management. Natl Med J India. 2005;18:304–12. [PubMed] [Google Scholar]
- 17.Mitra AP, Cote RJ. Molecular pathogenesis and diagnostics of bladder cancer. Annu Rev Pathol. 2009;4:251–85. doi: 10.1146/annurev.pathol.4.110807.092230. [DOI] [PubMed] [Google Scholar]
- 18.KEGG: Kyoto Encyclopedia of Genes and Genomes. Kanehisa Laboratories Web site. [January 20, 2009]; http://www.genome.jp/kegg/. Updated 2009.
- 19.Ohl F, Jung M, Radonic A, Sachs M, Loening SA, Jung K. Identification and validation of suitable endogenous reference genes for gene expression studies of human bladder cancer. J Urol. 2006;175:1915–20. doi: 10.1016/S0022-5347(05)00919-5. [DOI] [PubMed] [Google Scholar]
- 20.Schultz IJ, Kiemeney LA, Witjes JA, et al. Survivin mRNA expression is elevated in malignant urothelial cell carcinomas and predicts time to recurrence. Anticancer Res. 2003;23:3327–31. [PubMed] [Google Scholar]
- 21.Vandesompele J, De Preter K, Pattyn F, et al. Accurate normalization of real-time quantitative RT-PCR data by geometric averaging of multiple internal control genes. Genome Biol. 2002;3:research0034.1–11. doi: 10.1186/gb-2002-3-7-research0034. [DOI] [PMC free article] [PubMed] [Google Scholar]
- 22.Westfall PH, Young SS. Resampling-based multiple testing: examples and methods for p-value adjustment. New York, USA: Wiley-Interscience; 1993. [Google Scholar]
- 23.Therneau TM, Atkinson EJ. Mayo Clinic Technical Report No. 61. Rochester, MN: Mayo Clinic, Section of Biostatistics, Department of Health Sciences Research; 1997. An introduction to recursive partitioning using the RPART routines. [Google Scholar]
- 24.Jebar AH, Hurst CD, Tomlinson DC, Johnston C, Taylor CF, Knowles MA. FGFR3 and Ras gene mutations are mutually exclusive genetic events in urothelial cell carcinoma. Oncogene. 2005;24:5218–25. doi: 10.1038/sj.onc.1208705. [DOI] [PubMed] [Google Scholar]
- 25.Theodorescu D, Cornil I, Fernandez BJ, Kerbel RS. Overexpression of normal and mutated forms of HRAS induces orthotopic bladder invasion in a human transitional cell carcinoma. Proc Natl Acad Sci U S A. 1990;87:9047–51. doi: 10.1073/pnas.87.22.9047. [DOI] [PMC free article] [PubMed] [Google Scholar]
- 26.Xia G, Kumar SR, Hawes D, et al. Expression and significance of vascular endothelial growth factor receptor 2 in bladder cancer. J Urol. 2006;175:1245–52. doi: 10.1016/S0022-5347(05)00736-6. [DOI] [PubMed] [Google Scholar]
- 27.Takahashi Y, Tucker SL, Kitadai Y, Koura AN, Bucana CD, Cleary KR, et al. Vessel counts and expression of vascular endothelial growth factor as prognostic factors in node-negative colon cancer. Arch Surg. 1997;132:541–6. doi: 10.1001/archsurg.1997.01430290087018. [DOI] [PubMed] [Google Scholar]
- 28.Mitra AP, Almal AA, George B, et al. The use of genetic programming in the analysis of quantitative gene expression profiles for identification of nodal status in bladder cancer. BMC Cancer. 2006;6:159. doi: 10.1186/1471-2407-6-159. [DOI] [PMC free article] [PubMed] [Google Scholar]
- 29.Lopez-Beltran A, Luque RJ, Alvarez-Kindelan J, et al. Prognostic factors in survival of patients with stage Ta and T1 bladder urothelial tumors: the role of G1-S modulators (p53, p21Waf1, p27Kip1, cyclin D1, and cyclin D3), proliferation index, and clinicopathologic parameters. Am J Clin Pathol. 2004;122:444–52. doi: 10.1309/LTFU-3UUM-BY09-5HUM. [DOI] [PubMed] [Google Scholar]
- 30.Lopez-Beltran A, Luque RJ, Alvarez-Kindelan J, et al. Prognostic factors in stage T1 grade 3 bladder cancer survival: the role of G1-S modulators (p53, p21Waf1, p27kip1, cyclin D1, and cyclin D3) and proliferation index (ki67-MIB1) Eur Urol. 2004;45:606–12. doi: 10.1016/j.eururo.2003.11.011. [DOI] [PubMed] [Google Scholar]
- 31.Birkhahn M, Mitra AP, Cote RJ. Molecular markers for bladder cancer: the road to a multimarker approach. Expert Rev Anticancer Ther. 2007;7:1717–27. doi: 10.1586/14737140.7.12.1717. [DOI] [PubMed] [Google Scholar]
- 32.Mitra AP, Birkhahn M, Cote RJ. p53 and retinoblastoma pathways in bladder cancer. World J Urol. 2007;25:563–71. doi: 10.1007/s00345-007-0197-0. [DOI] [PubMed] [Google Scholar]
- 33.Jichlinski P, Guillou L, Karlsen SJ, et al. Hexyl aminolevulinate fluorescence cystoscopy: A new diagnostic tool for photodiagnosis of superficial bladder cancer—a multicenter study. J Urol. 2003;170:226–9. doi: 10.1097/01.ju.0000060782.52358.04. [DOI] [PubMed] [Google Scholar]
- 34.Mynderse L, Stenzl A, Denzinger S, et al. Hexaminolevulinate fluorescence cystoscopy improves detection and resection of papillary bladder cancer lesions and reduces early recurrences. J Urol. 2009;181(suppl 4):689. [Google Scholar]
- 35.Dyrskjot L, Kruhoffer M, Thykjaer T, et al. Gene expression in the urinary bladder: a common carcinoma in situ gene expression signature exists disregarding histopathological classification. Cancer Res. 2004;64:4040–8. doi: 10.1158/0008-5472.CAN-03-3620. [DOI] [PubMed] [Google Scholar]
- 36.Schultz IJ, Wester K, Straatman H, et al. Prediction of recurrence in Ta urothelial cell carcinoma by real-time quantitative PCR analysis: a microarray validation study. Int J Cancer. 2006;119:1915–9. doi: 10.1002/ijc.22059. [DOI] [PubMed] [Google Scholar]
- 37.Kuo WP, Jenssen TK, Butte AJ, Ohno-Machado L, Kohane IS. Analysis of matched mRNA measurements from two different microarray technologies. Bioinformatics. 2002;18:405–12. doi: 10.1093/bioinformatics/18.3.405. [DOI] [PubMed] [Google Scholar]