

Abstract
Structural imaging research offers excellent translational benefits when non-human primate (NHP) models are employed. In this paper, we will discuss the development of anatomical MR imaging protocols for two important applications of structural imaging in NHP: studies of genetic variability in brain morphology and longitudinal imaging of fetal brain maturation trends. In contrast with imaging studies of adult humans, structural imaging in the NHP is challenging due to a comparatively small brain size (2-200 fold smaller volume, depending on the species). This difference in size is further accentuated in NHP studies of brain development, in which fetal brain volumes are 10-50% of their adult size. The sizes of cortical gyri and sulci scale allometrically with brain size. Thus, achieving spatial sampling that is comparable to that of high-quality human studies (∼1.0 mm3) requires a brain-size-adjusted reduction in the sampling volumes of from 500-to-150 microns3. Imaging at this spatial resolution while maintaining sufficient contrast and signal to noise ratio necessitates the development of specialized MRI protocols. Here we discuss our strategy to optimize the protocol parameters for two commonly available structural imaging sequences: MPRAGE and TrueFisp. In addition, computational tools developed for the analysis of human structural images were applied to the NHP studies. These included removal of non-brain tissues, correction for RF inhomogeneity, spatial normalization, building of optimized target brain and analysis of cerebral gyrification and individual cortical variability. Finally, recent findings in the genetics of cerebral gyrification and tracking of maturation trends in the fetal, newborn and adult brain are described
Introduction
Scientists are challenged to seek the most appropriate animal model of biological relevance to a given question and then to match the model with the measurement tool(s) best suited to test their hypothesis. Non-primate models for both normative and perturbed biology can yield invaluable findings, but non-human primate (NHP) models are uniquely suitable for translational imaging research in genetics, morphology and maturation of cortical landscape [1-4]. Genetically, Old World NHPs share up to 99% of the human genome [1]. NHPs are also well suited for multi-generation pedigree studies. In contrast with whole genome association studies typically performed in humans, a multi-generational pedigree design offers an advantage in statistical power, supporting precise identification of genetic loci with far fewer subjects (<1000 versus 10,000 for whole-genome association studies) [5-7]. Genetic studies in NHPs have already been used to map quantitative trait loci that influence a number of complex phenotypes directly related to human health and disease[8-12].
Developmentally, NHPs and humans share a highly orchestrated pattern of cerebral development. Formation of cerebral landscape, or primary gyrification, begins in the early stages of telencephalic development. Its onset coincides with completion of neuronal proliferation and migration and its progression is accompanied by an explosive increase in cerebral growth [4, 20, 21]. The onset of primary gyrification is coupled with the beginning of neuronal differentiation that partitions the cortical lamina into an intricate mosaic of specialized functional areas [22]. During primary gyrogenesis, primary cortical sulci and gyri appear in a tightly controlled ontogenic sequence, which has been found to be highly conserved across the primate species, including humans[20, 21, 23]. Therefore, imaging of the developing brain in NHPs offers a unique way to study the transmogrification that the brain undergoes with the gyrification of the cerebral cortex.
Here we highlight two anatomical MR imaging protocols and several image analysis methods that were optimized for two important applications of structural imaging in NHPs: studies of genetic variability in brain morphology and serial imaging of the fetal brain to establish maturational trends. Our ultimate goal is to merge them into a study of longitudinal cerebral development of animals with different genetic makeup in order to identify chromosome regions that might influence the gyrification process.
Methods and Development
The objective for developing imaging protocols for NHPs was to at match the quality to that of high-resolution human structural imaging. While this objective was technologically challenging, modern high-field MR scanners equipped with high performance gradients and multi-channel RF receivers, make it achievable.
Development of MR imaging protocols
Challenges in imaging of NHP
The main challenge in imaging NHPs is that adult brain volumes are much smaller than the human brain volume by a factor of from 2-200 (Figure 1). Brain volumes of the most commonly used research NHPs can be as small as 5 to 8 cm3, for new world primates such as marmoset, and up to 800 cm3 for old world primates, such as the great apes (Figure 1). The brain volumes for the two most commonly used laboratory NHP primates, rhesus (macaca mulata) and baboon (papio hamadryasis) are on average 80 cm3 and 170 cm3 respectively, which make them 1/16 and 1/8 the volume of a human brain. An important consideration in the design of an imaging protocol is spatial resolution with which brain morphology is sampled. While the brain volumes of NHP are much smaller than human brains, not all internal brain structures scale allometrically with brain volume. For example, the thickness of cerebral cortex is very similar among mammals[24]. However, the characteristic sizes of the morphological features of cortical landscape structure, gyri and sulci, scale directly with brain volume (Figures 1,2). Hence, to achieve allometric spatial sampling in NHP brains that is comparable to spatial resolution of high resolution human studies (∼1.0mm3) requires a spatial resolution of 150-to-500 microns3. Imaging at this resolution, while maintaining sufficient contrast and signal to noise ratio, often requires development of an optimized MRI protocol.
Figure 1.

Degree of gyrification (solid) and brain volume (dotted), measured from data acquired using T1w translational imaging protocol, show profound changes in primates, however, the regional pattern of primary cortical features remains evolutionary preserved from species to species
Figure 2.

Optimized, T1w, motion-corrected, MR imaging protocol with allometric, isotropic, spatial resolution was used to acquire structural data in human and non-human primates. The image acquisition time is 24 min for humans and up to 1 hour for NHP.
Steps in development of MRI protocols
Development of an optimal MRI protocol begins with determining basic MR tissue properties, including T1/T2 relaxation times and relative difference in hydrogen proton density. Next, an appropriate MR imaging pulse sequence is chosen and sequence parameters modeled to achieve the desired tissue contrast and SNR. First, we will discuss the protocol development and implementation of a translational, brain-size-adjusted resolution (isotropic sampling from 0.2-to-0.8mm), high white matter (WM)/gray matter (GM) contrast (24%), high SNR (25) imaging of adult brains (Figures 1,2). Further, we will discuss the development of MR sequences for in utero imaging of the developing brain and extra challenges associated with in utero imaging.
MR tissue properties
Three relevant parameters that define tissue contrast and signal in structural brain imaging are the T1 and T2 relaxation times and relative hydrogen proton density (PD or ρ). T1 is a tissue- and MR-field specific time constant that reflects the time it takes for hydrogen proton spin states to reach equilibrium in the presence of an external magnetic field. T2 is a tissue-specific time constant, describing the decay of transverse (perpendicular to the main magnetic field) magnetization for hydrogen protons. Relative PD is a concentration of hydrogen protons in a given tissue calculated relative to pure water. To measure T1 and PD values within adult and fetal NHP brain, a spin-echo sequence was use with a repletion time (TR) of 500, 700, 1200, 3000 and 4000 msec at the echo time (TE) of 8 msec. To measure T2, images were obtained using spin-echo sequence with TE in the increments of 8ms from TE= 8 to 144 msec and Repetition Times (TR) of 500 msec (Figure 3). A least-square, multi-exponential fitting method was used to calculate T1 & T2 time constrants and relative PD for GM/WM compartments based on the ROI placed in deep cerebral WM and cortical GM (MathCad, MathSoft,Cambridge, MA) (see Table 1A). Calculated gray matter (GM) and white matter (WM) T1/T2 relaxation times and PD for five live adult baboons were not statistically different from these values calculated in five human volunteers (Table 1A).
Figure 3.

A subset of the images from T2-relaxometry studies in an adult (top) and 18 week-old fetal baboon brains, showing significant relaxation difference between adult and fetal brains
Table 1.
| Table 1A. Average T1, T2 and PD (Relative to Water) for Five Adult Baboons and Five Human subjects | |||
|---|---|---|---|
| Tissue type | T1 (msec) | T2 (msec) | PD |
| Gray matter | 1548 ± 193 | 85.2 ± 3.0 | 0.76 ± 0.07 |
| White matter | 1118 ± 61 | 54.5 ± 5.9 | 0.62 ± 0.06 |
| Table 1B. T1, T2 and PD (Relative to Water) measure for a 17 week-old fetal brain | |||
| Tissue type | T1 (msec) | T2 (msec) | PD |
| Gray matter | 2100 | 385 | 0.93 |
| White matter | 2150 | 450 | 0.85 |
Tissue parameters play a key role in modeling the pulse sequence to achieve optimal signal and contrast. In fully myelinated adult brains, there is a substantial (∼30%) difference in T1 relaxation times between the GM and WM compartments (Table 1A). Therefore, a T1-weighted sequence can produce excellent GM/WM tissue imaging contrast. Fetal brain is not myelinated and therefore WM and GM compartments have very similar T1 values (Table 1B). Additionally, fetal brain WM and GM T1-relaxation times are virtually indistinguishable from the T1 time of amniotic fluid that surrounds the fetal head (Figure 4). Hence, fetal brain imaging is usually performed with T2-weighted sequences to produce imaging contrast based on tissues' difference in the T2-relaxation times.
Figure 4.

Fetal brain imaged in-utero with T1w, spoiled gradient echo sequence, fast field echo and balanced steady state free precession (TrueFisp) sequences.
Selection and modeling of structural MRI pulse sequence in adult population
Sequences used for high-resolution imaging of adult brain, commonly utilize tissues' differences in T1-relaxation times (T1-weighted). We chose to use a 3D, magnetization-prepared, transient steady state, rapid gradient echo (MPRAGE) sequence with an adiabatic inversion recovery (IR) preparation pulse and a linear k-space sampling scheme (Figure 5). This sequence is superior to other T1-weighted sequences such as spoiled gradient echo sequences, as its adiabatic contrast forming inversion pulse leads to a uniform contrast throughout the brain volume [25]. Another important consideration in the choice of a sequence for translational research is that it should be capable of accommodating a range of field-of-view sizes, while maintaining spatial resolution and consistent imaging contrast. The MPRAGE sequence is fully capable of acquiring very high resolution datasets (150-200 micron isotropic) on modern clinical scanners equipped with pulsed magnetic field gradient systems capable of producing 40 mT/meter or greater magnetic field gradients. The MPRAGE sequence consists of three parts: a magnetization preparation segment that forms tissue contrast, a gradient echo segment that samples a logical partition of 3D k-space and a delay segment that allows for recovery of longitudinal magnetization [25]. From preliminary testing we determined that the spatial resolution should scale linearly with brain size while the optimal WM/GM image contrast and SNR are 25% and 25 respectively. Images with this resolution, contrast and SNR were compatible with most of the commonly used image analysis tools. Therefore the goal of the protocol development was to seek sequence parameters to satisfy these conditions in the shortest acquisition time.
Figure 5.

RF timing diagrams for magnetization prepared transient state equilibrium, rapid gradient echo (MPRAGE) (top) and balanced gradient echo (TrueFISP) (bottom) sequences). Logical partition is a segment of k-space data in the phase or slice encoding directions
The MPRAGE sequence is controlled by 5 parameters; TI, TR1, TE, TR2 and flip angle (Figure 5). However, only three parameters are typically controlled by the user: TI, TR1 and flip angle (θ). The TE and TR2 for the gradient echo are typically kept as short as allowed by the hardware configuration. In considering the values of sequence parameters, one should try to keep the TR1 time longer than GM's T1 relaxation time for improved SNR. TR1 also controls the total duration of the experiment as during a single TR1 interval an entire logical partition (a slice along phase either of the two encoding direction) is sampled. Hence, the total sequence running time is the product of TR1 and the number of logical partitions. Typically, the TR1 parameter of an MPRAGE sequence is set to ∼2000 msec. Two other parameters TI and θ are open for optimization.
The analytical formulation of MPRAGE signal dependences on T1, T2, tissue's proton density and sequence control parameters is provided in [26]. The complex multi-factorial modeling process can be simplified by using the following rules. (A) The inversion time that simultaneously maximizes the signal and the contrast between two tissues is found as the average of their T1 relaxation times. For an MPRAGE sequence with a linear phase encoding schema this time can be found as TI= (T1gm+T1wm − Tsample)/2. (B) Flip angle,θ, for the sampling part should be chosen in the range of 5-15 degrees. Within that range, a higher flip angle will improve SNR but produce a corresponding reduction in GM/WM contrast. Increasing flip angle beyond 15 degrees can lead to unstable results and reduce both SNR and contrast. (C) Longer delay time (TD) increases signal by a factor ∼exp(-(TI+Tsampling part + TD)/T1), but at the sacrifice of prolonging the acquisition time.
T1/T2/PD values from Table 1 were used provide estimates for WM-GM contrast and WM+GM signal as a function of TI and θ (Figure 6). First, the excitation angle of 9 degrees was established in order to produce the optimal contrast-to-noise ratio. The TI was then calculated to provide a WM-GM contrast of 25% (TI=785 ms). Finally, the number of averages was calculated to achieve an SNR of ∼25 for a given spatial resolution. The model-determined imaging sequence parameters were verified in a group of five baboons, where group-averaged WM-GM contrast was calculated to be 24.4 ± 2% [27].
Figure 6.

Modeling process of MRI contrasts and signal versus the flip angle and TI parameters of the magnetization prepared, transient state equilibrium sequence (MPRAGE)
Selection and modeling of structural MRI pulse sequence for in utero imaging
Our objectives in development of the in utero imaging protocol were to achieve high-SNR and 3D, isotropic coverage of a fetal brain enabling a longitudinal study of gyrification. The choice of sequences for in utero imaging is generally limited to sequences that emphasize tissue differences in T2 relaxation times (T2-weighted). In unmyelinated fetal brain, GM/WM T1-relaxation times are nearly identical (Table 1B). Hence, the T1-weighted sequences will produce insufficient contrast until the brain is fully myelinated at the age of approximately six months (Figure 7). Additional complications arise due to amniotic fluid that surrounds the fetal head. Its T1-relaxation time is similar to that of brain tissue, thus complicating segmentation procedures (Table 1, Figure 4). Fortunately, there is sufficient difference in the T2 relaxation times among cerebral WM, GM and amniotic fluid (∼2000 ms), allowing for sufficient brain tissue contrast and excellent brain/amniotic fluid contrast (Table 1B, Figure 4).
Figure 7.
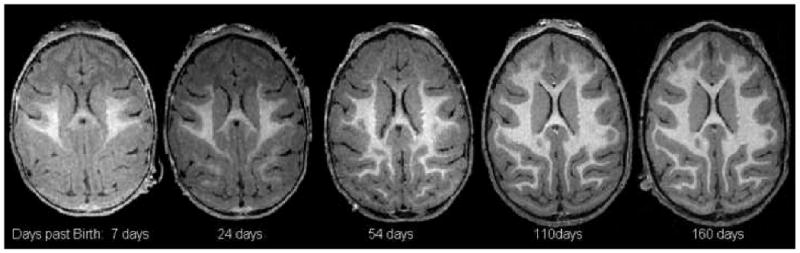
Longitudinal changes in regional T1-weighted contrast between GM and WM compartments. The regional gray matter and white matter contrast remains poor until brain is fully myelinated at the age of approximately 6 month.
Another factor that makes fetal brain imaging difficult is the periodic, respiratory motion of the mother's diaphragm at the rate of ∼8-10 times per minute. To suppress artifacts association with this motion we use respiratory gating in combination with mechanical ventilation. During respiratory gating, the animal breathing pattern is monitored using the tidal volume measurement provided by the mechanical ventilator. When the diaphragm is fully expanded, a trigger signal is sent to the host computer. Following a trigger delay time, set to be sufficiently long for an animal to exhale, data acquisition is performed in the 3-5 second intervals when the diaphragm is at rest. This strategy limited the choice of MRI pulse sequence to those that can perform segmented data acquisition.
T2-weighted tissue contrast is normally achieved by setting the echo time for the pulse sequence to a large value relative WM T2 values thus allowing for transverse relaxation to take place. Historically, fast field echo (FFE) sequences have been used for in utero brain imaging[28]. An FFE sequence is capable of quickly acquiring T2-weighted data. It is sufficiently flexible to be adapted for segmented, respiratory-gated acquisition. Unfortunately, its usefulness at higher magnetic field (2 Tesla and above) is limited by its energy deposition rate, a limitation known as specific absorption ratio (SAR). FFE sequences employ a long trail of high-energy refocusing radiofrequency pulses separated by short (∼10ms) time intervals. The radiofrequency heating due to energy deposition may therefore cause an unsafe elevation of the core body temperature. The SAR can be especially high for thin slice 3-D FFE imaging experiments where the train of refocusing pulses can be 200-300 pulses long. The SAR limitation forces some to use 2D, thicker-slice acquisition methods and interlace high and low SAR sequences, resulting in a loss of contiguity in imaging data [29]
To overcome the SAR limitations of the FFE sequences, we chose a 3D balanced gradient echo (TrueFisp) sequence (Figure 4, right; Figure 5, bottom). Balanced gradient echo sequences are notable for providing the highest level of signal per TR-interval among all MR sequences. This makes the TrueFisp sequence highly desirable for SNR-limited high-resolution 3D imaging. Image contrast in a TrueFisp pulse sequence depends on the T2/T1 ratio as opposed to T2. Tissues with long T2 relaxation times show very high signal (Figure 4). In fetal brain imaging, the tissue contrast is qualitatively similar to that of the T2w FFE sequence, providing an excellent delineation of fetal cerebrum (Figure 4). TrueFisp image contrast is controlled by three parameters; flip angle (θ), TE and TR. In reality, TE and TR are usually set to the shortest allowable values to prevent appearance of black-band artifacts. The flip angle is usually set to the value θmax that maximizes the SNR (eq 1).
| (Eq1) |
The TrueFisp sequence is sufficiently flexible to be adapted for segmented, respiration-gated acquisition of imaging data (Figure 5, bottom). The typical respiration frequency of 8-10 resp/min and 1 second trigger delay time allows for data acquisition cycles that are 3-4 seconds long. Segmentation is achieved by acquiring an entire logical partition, usually a slice along the phase-encoding direction, within a single acquisition cycle. Short TR (∼5ms) allows one to acquire a slice consisting of 300-500 phase encoding lines within a single respiration cycle.
Reduction of motion-related artifacts
We acquire structural images using a retrospective motion-corrected approach [30]. This is necessary to reduce artifacts due to the subject's head movements during the scan. High-resolution spatial sampling and the need for sufficient SNR translate into long scan times, requiring subjects to be motionless for periods of 20-60 min. Unfortunately, long scan times inevitably lead to the increased likelihood of motion even in anesthetized animals. To prevent motion-related artifacts we partitioned motion into two categories: intra- and inter-scan. Intra-scan motion leads to blurring and phase-related artifacts. Such artifacts cannot be adequately corrected. In contrast, inter-scan movements can be modeled as a 3-D rigid-body motion and corrected using spatial realignment (Figure 8). To reduce the intra-scan motion we segment image acquisition into intervals of only 4-6 min long. The premise is that time-segmentation of data acquisitions helps cast the intra-scan motion into the inter-scan category which can be modeled and corrected.
Figure 8.

Retrospective motion correction of high resolution anatomical data
Processing of structural images
High-resolution, high-SNR images of NHP can be analyzed using a wealth of computational morphology tools developed for human structural brain analysis. Commonly, the processing steps of structural imaging are assembled into a pipeline where the output of preceding step data is used as an input for the following step (Figure 9). This allows for a simple automation of sequential processing steps. We will present on the structural imaging pipeline developed in our center using commonly available image processing tools. Our pipeline consists of the following steps: removal of non-brain tissue, correction for RF-inhomogeneity artifacts, global spatial normalization and advanced cortical processing steps. Each of these steps is discussed in detail below.
Figure 9.

Structural image processing pipeline.
Removal of non-brain tissue
Processing of anatomical images starts with removal of non-brain tissue (skull stripping) (Figure 9A). We use brain extraction tool, BET [31], distributed as a part of the FSL package[32]. BET works by expanding a spherical surface from inside the brain while deforming it to match the edges of the brain [31]. Though the BET algorithm was designed for use on human data sets, it is also applicable to the brains of non-human primates. The following adjustments were found to be useful in improving the quality and reliability of brain extraction. Thresholding images at the intensity level of CSF can improve detection of the brain/skull interface. When used with default parameters BET often erroneously removes inferior and anterior aspects of the frontal lobe due to oblong shape of the primate brain. Using a custom BET starting point, calculated as the center of mass for the brain, will help to reduce this error. However, manual editing is often necessary to insure anatomically correct brain extraction.
Correction for RF-inhomogeneity artifacts
Structural MR images are often corrupted by RF-inhomogeneity artifact. RF inhomogeneity artifact manifests itself as a low-frequency variation of MRI image intensity (Figure 9A). This artifact is caused by the non-uniform receive profile of the MRI coil and can impede intensity-based image analysis unless corrected. We used a correction algorithm implemented as the part of the FAST tool and distributed with FSL package[31]. It improves image quality by estimating and corrected for the regional variations in intensity using 3-D polynomial model. This improvement causes tissue intensities to become tightly clustered with respect to their class means. In our experience, default FAST settings are usually sufficient for this correction.
Global spatial normalization
Anatomical images are typically analyzed in a common reference space[33]. Images are transformed to this space in order to remove individual variations in brain location, size and orientation [34, 35]. This is accomplished by using a parametric description of the whole brain (position, orientation, and dimension) to calculate a spatial transform with up to twelve parameters, three each for rotation, translation, scaling and shearing that will match homologous spatial features of a “source” brain to those of a “atlas” brain. The choice of the atlas is an important step. Best registration is achieved when a population-based atlas is used as a target as this target incorporates anatomical features that are common in a population. A population-based atlas is available for rhesus brain[36]. We built a population-based atlas for baboon brain (http://ric.uthscsa.edu/personalpages/petr). Other groups have built a population-based atlas for other NHP species such as rhesus macaque[37]. However, it is common for researchers to build their own population-based atlases to accommodate for variations in imaging contrast and anatomical features of their populations. We describe the process of building such an atlas below.
Following selection of the atlas brain, individual images are spatially normalized using a fully automated spatial normalized tool FLIRT, distributed with the FSL package[32]. It is important to use higher quality interpolation algorithms as otherwise resampled images are likely to be degraded by interpolation-related blurring. In our experience, resampling with a 9mm or larger sinc kernel minimizes interpolation-related blurring.
Building a population based Baboon atlas
The algorithm for building a population specific atlas was described in Kochunov et al [38] and is shown in Figure 9. The goal of this procedure is to construct a median geometry image, called optimized minimal-deformation target (OMDT), which incorporates anatomical features common to the group and eliminates outlier features [33, 39]. Thirty-two baboon MR studies with equal numbers of males/females in each group were used for this project. The process started with a manual alignment of individual images per Talairach specifications: the AC-PC line was aligned to be parallel to the axial plane and the inter- hemispheric surface was aligned with the sagittal plane. All images were resliced to the isotropic 400μm3 space. Next we performed global target-less spatial normalization (TSN) of individual images to reduce individual spatial variability in size, shape and orientation. The TSN procedure is described in Kochunov et al [38] and is performed to spatially normalize images in a group without introducing a bias associated with selection of a target brain. The TSN is performed in two steps: global and regional. The first step is the global targetless spatial normalization is described in Woods [40] and Kochunov et al [38]. All individual images are collectively globally aligned to each other by performing 9-parameter global spatial normalization of each image to each image. For each image, this step produces N-1 transformation matrixes (N = number of images in the group). These matrices detail the spatial transformation from one image to all others. The spatial transformation that takes an image to the middle of the group's space is then calculated by “averaging” these matrices. This procedure was performed for each image, thereby transforming the group “global average geometry shape” which preserves the average shape and size of the images [40]. Regional TSN processing is similar to global TSN except that high-resolution, non-linear warping is performed to match individual images down to the limiting MRI resolution. Instead of affine transformation matrices, the result of the warp is saved in a deformation field (DF). A DF is a 3-D array of displacements vectors, Δ(x,y,z) which point from a location in source brain image (x,y,z) to an associated location (x + Δx(x,y,z), y + Δy(x,y,z), z + Δz(x,y,z) in the target brain image. We have developed a metric to identify a minimal deformation target (MDT) brain based on the analysis of deformation fields. The MDT brain minimizes the total deformation effort needed to match images in the group to this brain [33]. Once determined, the MDT brain can be further optimized to produce the optimized MDT (OMDT) brain [41] (Figure 10).
Figure 10.
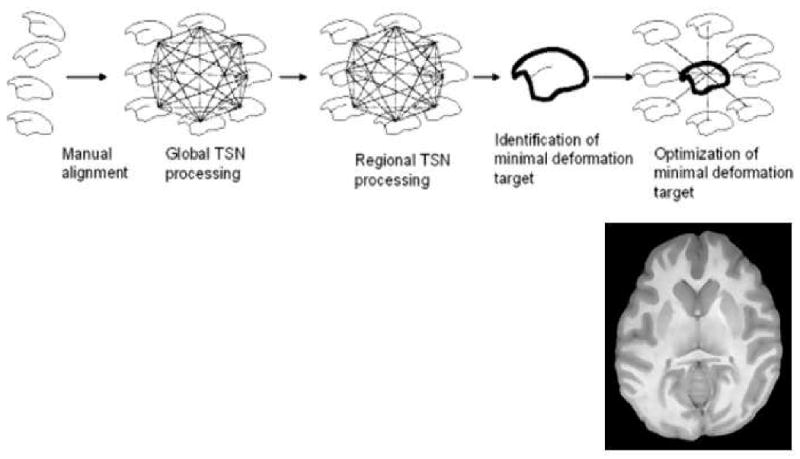
Building an OMDT population-based atlas (top). An axial slice from an OMDT baboon atlas (bottom)
Advanced cortical processing
Removal of non-brain tissue, correction for RF-inhomogeneity artifact and global spatial normalization prepared images for advanced analysis. In our center, images are further processed using the Object Based Morphometry pipeline distributed with BrainVisa software (http://brainvisa.info). This pipeline computes graphs of meshes encoding individual cortical sulci and gyri representing cerebral cortex thereby providing tools to quantify individual variations in cortical anatomy. This pipeline starts with decomposing brain volume into cerebral hemispheres and cerebellum (Figure 9C), then tissue classification maps for WM/GM/CSF are computed (Figure 9D). The cortical ribbon is triangulated into the inner WM and outer GM boundary of the cortical meshes (Figure 9E -F). A “crevasse detector” is used to reconstruct sulcal ribbons as the medial surfaces from the two opposing gyral banks that span from the most internal point of sulcal fold to the convex hull of the cortex[42, 43]. Next, an automated set of sulcal identification and labeling tools, based on 500 artificial neural network pattern classifiers [44], labels cortical sulci (Figure 9H). In the final step, cortical gyri are identified and labeled based on the pattern of cortical sulci (Figure 9I). Regional cortical thickness, cerebral gyrification index, surface area, length and depth of individual sulci are subsequently calculated using in-house tools. These tools are available as brainvisa plug-ins and can be download from (http://ric.uthscsa.edu/personalpages/petr).
Another commonly used advanced approach for processing of structural images is Voxel Based Morphometry (VBM) analysis pipeline distributed as a part of FSL (http://www.fmrib.ox.ac.uk/fsl/fslvbm/) [45]. VBM analysis is designed to produce a 3-D image of regional gray matter density (GMD) (Figure 11). VBM analysis is often used to track voxel-wise changes in the grey matter volume/topography in one population or perform a group comparison between two or more populations. The pre-processed images are further normalized by registering them to a population-based template brain using a non-linear warping algorithm FNIRT. This step is used to reduce anatomical variability seen at various scales, down to the limiting resolution of the 3-D MR brain images. The non-linear transformation is stored in a deformation field (DF), a 3-D array with 3-D displacement vectors that detail displacements needed to warp from a source to a target brain [39, 46]. To develop gray matter density maps, individual images are classified into GM, WM and CSF using the FAST software tool [32] with reference to a population based a priori tissue map. Individual tissue classification maps are converted to 3-D spatial occupancy maps describing the fractional content (0-1.0) of each tissue type within each voxel. Jacobian Modulation (JM) is used to preserve regional gray matter volumes by adjusting for the change in regional volume (compression or expansion) as the regional spatial normalization algorithm will alter regional volume to fit the reference template. The final step in image processing is smoothing with a 3-D Gaussian filter to compensate for noise introduced in various processing steps.
Figure 11.

Voxel-based morphology processing diagram.
Results
Genetics of cerebral variability
Old world monkeys are novel in their suitability as a translational imaging animal model for the genetic analysis of individual variation in brain structure. Aside from apes, no species are more closely related to humans [1]. Old World monkeys include baboons, rhesus macaques, cynomolgus macaques and vervet monkeys. We have chosen to study baboons because they are most suitable for imaging research, having significantly larger brains than macaques or other commonly used laboratory monkey [47, 48]. Therefore, opportunities for detailed structural imaging and the analysis of inter-individual anatomical variation are greater in baboons. Primate species that are more similar to humans and hence are outstanding models for human neuroanatomy (i.e. chimpanzees and gorillas) present only minimal opportunities for intra-species genetic analyses due to the lack of extensive multi-generation pedigrees. In contrast, extended pedigrees of baboons have been used to map quantitative trait loci that influence a number of complex quantitative phenotypes directly related to human health and disease[8-12]. This suggests that the analysis of complex phenotypes in this primate model can lead to new information about the genetic basis of individual variation in biomedically important traits.
Recently, we reported heritability measurements of the brain volume, volume of gray matter, the area of the cortical surface and regional variations in brain shape [27]. The brain volume was calculated as the volume non-zero tissue at the step A of the pipeline (Figure 9). Its estimated heritability, the fraction of the variance explained by genetic differences, was h2 = 0.816 (p= 0.00022). The volume of cerebral gray matter was measured at step C (Figure 9C), was h2 = 0.67 (p = 0.010). The heritability of the area of the cortical surface, measured from cortical meshes extracted at step D (Figure 9) was also very high h2 = 0.730 (p = 0.0069). Lastly, we performed voxel-based analyses of the genetics of the brain shape. The results of the genetic analysis of the variation in local or regional brain size and shape using VBM methods identified substantial differences across brain regions (Figure 12). The size and shape of brain areas associated with more rudimentary motor and sensory functions (such as for body and trunk) are highly heritable, with h2 generally greater than 0.70. Brain regions associated with motor and sensory function for arms, lips and face exhibit somewhat lower but nevertheless substantial heritability (h2 < 0.60). Results for the baboon analogs of brain areas associated with speech processing in humans are particularly interesting. The anatomical equivalents of Broca's area (opercular portion of the inferior frontal gyrus), Wernicke's area (superior temporal gyrus) and the angular gyrus show high local heritability (h2 > 0.70), while the superior parietal structures show markedly lower heritability (h2 < 0.30). These findings were presented in Rogers, Kochunov et al., [27]
Figure 12.

Regional variation in heritability of baboon brain size and shape
Next, we tested two hypotheses regarding the common genetic variance in bran volume and gyrification in parallel in humans and baboons. The first hypothesis was that variations in the measurement of degree of gyrification will be highly heritable. The second hypothesis was that the same genetic factors that influence individual variation in brain volume will also influence gyrification, producing a genetic correlation (ρG) that is both positive and substantial, possibly approaching unity (ρG=1). Testing these hypotheses allowed us to begin investigating the genetic basis of variation in cortical folding. An advantage of our design is that we could simultaneously test the two predictions and determine whether the genetic architecture we find in humans may be different from that in NHP. While the primate brain size has increased throughout the last 50 million years of primate evolution, the human brain has undergone extremely rapid expansion during the last three million years of human evolution[49-51]. This unique acceleration in human lineage necessitates independent assessments of the comparative developmental genetics in humans and NHP because the genetic architecture of these traits may have been altered in that process. Our methodology for measuring gyrification index (GI), an adaptation of a classical 2-D method developed for histological analyses[21, 23, 52], is available for download at (http://ric.uthscsa.edu/personalpages/petr). Quantitative genetic analyses testing our first prediction showed that both brain volume and cortical gyrification are significantly heritable in both species. The heritability (+ s.e.) of brain volume was observed to be h2 = 0.52±0.18 for humans and h2 = 0.85 ± 0.29 for baboons. Estimated heritability for GI in humans was h2 = 0.30 ± 0.16 (p= 0.018). In baboons, the heritability of GI was h2 = 0.71 ± 0.29 (p= 0.0021).
To test our second hypothesis and measure the degree to which the genetic variability that influences brain size also influences degree of gyrification, we performed genetic correlation analysis. The genetic correlations between cerebral volume and GI were estimated as ρG = -0.73 in humans and ρG = -0.77 in baboons. Both genetic correlations are significantly less than 0 (p= 0.045 in humans and p= 0.045 in baboons), and therefore both are also significantly less than +1.0, our predicted result. Consequently, the Prediction Two that pleiotropic effects of overlapping or identical sets of genes produce the positive correlation between brain volume and gyrification had to be rejected. This study demonstrates, for the first time, significant genetic heritability for individual variation in cortical gyrification. We have shown that there are indeed shared genetic effects common to both cerebral volume and gyrification. However, contrary to our prediction, the calculated genetic correlations between cerebral volume and cortical folding are significantly negative in both baboons and humans. Therefore, this study provides clear support for Prediction One, that gyrification is heritable, but we reject Prediction Two, that the positive among-species correlation between gyrification and brain volume results from a common set of genetic changes affecting both traits in the same direction. The negative genetic correlations we observed for both humans and baboons indicate that there are indeed overlapping sets of genes that influence both brain volume and gyrification. But rather than producing parallel increases in both traits, our data indicate that the same genetic variation that acts to increase brain volume within these species also exerts a negative effect on the degree of cortical folding. These findings are presented in Rogers, Kochunov et al.[53].
Longitudinal imaging of fetal brain development in baboon
The reduced complexity of the primate brain and compressed rate of cerebral development make NHP a valuable research model to study brain maturation Morphological imaging of the developing primate brain offers a unique opportunity to study cerebral gyrification. Our specific interest is in quantification of cortical changes during primary gyrification [4, 20, 21]. During this stage of fetal development primary gyri and suci appear in a tightly controlled ontogenic order transmogrifying cerebral landscape from smooth, lissencephalic to a highly gyrified state[20, 21, 23]. During 50 million years of evolution, gyrencephalic primates retained a homologous pattern of primary cortical structures and the ontogenic order in which these structures appear[13]. Cerebral cortex in NHP also expresses a similar spatial mosaic of diverse functional areas[3]. Neuro-physiological studies in primates have shown that primary cortical gyri can serve as spatial landmarks depicting boundaries of cortical functional areas [15-18]. Therefore, the trajectory of maturational changes of individual gyral folds provides an insight on the maturation of the surrounding network of functional areas.
High resolution (500-600 μm isotropic) data were collected using the balanced gradient echo (TrueFisp) imaging protocol described in the methods section. Measurements included whole-brain volume, volumes of specific structures (e.g., corpus callosum) and global and regional measurement of the extent of cerebral gyrification. The global change in cerebral gyrification was tracked using the gyrification index. Regional changes in gyrification were tracked by depth and length of the primary cortical sulci. Five pregnant damns were imaged at approximate gestational weeks 16, 20 and 24 of the 27-week-long term. High-resolution anatomical images from the in utero study were processed with a pipeline shown in Figure 9, with slight modifications. Prior to importing images into step A of the pipeline, the nearby amniotic fluid and tissue were masked by manually placing a 3-D rectangular region of interest over the fetal brain using an in-house image analysis tool, Mango (http://ric.uthscsa.edu/mango). Manual detailing was necessary after the automated skull stripping procedure to insure anatomically correct segmentation. As the fetal brain is unmyelinated, brain images lacked the expected T1-w GM/WM contrast (Figure 13). Instead, an adaptive edge detection algorithm was used to extract pial and GM/WM interfaces which were converted to cortical surfaces using steps D and E of the pipeline (Figure 9). At week 17, the fetal brain was about 23% of the average adult brain volume of 173±21 cm3 [27]. The fetal brain was already undergoing cerebral gyrification with a gyrification index at 72% of the average adult value of 1.89±0.07[53]. Near the end of the gestation, week 25, the brain volume had increased by a factor of two, yet only reached ∼50% of the adult value. In contrast, the gyrification index of the near-term fetus was at 91% of the average adult value.
Figure 13.

Longitudinal in-utero measurements of gyrification and volume of fetal brain.
Concluding Remarks
Structural imaging research in NHPs is a rapidly growing field. MRI studies of NHPs can be used not only to validate basic neuroscience theories regarding gyrification of cerebral cortex but to accelerate the development of new drugs and medical devices. Several challenges must be overcome before achieving the same level of allometric sampling and tissue signals in NHPs as in humans due to their smaller brain volumes. Fortunately, emerging improvements in gradient and multi-channel RF electronics, acquisition software, along with higher magnetic field strengths allow for the acquisition of NHP imaging data that are compatible to the best structural data from humans (based on brain volumes). As reviewed here, careful optimization of MRI acquisition protocols, suppression of motion artifacts and development of an image processing pipeline can produce highly reliable, quantitative data. Using these, or similar, strategies enables investigators to study NHP brain architecture using the wealth of automated computational tools already developed for humans.
Acknowledgments
The authors wish to thank our collaborators for some of the material presented in this paper; Drs. Jeffery Rogers (Baylor), Steven Leigh (Univ. Illinois), Gerald Schatten and Carlos Castro (Univ. Pittsburgh). We also acknowledge technical assistance from the Dept. of Comparative Medicine at the Southwest National Primate Research Center (SNPRC). This work was supported, in part, by the National Institute of Biomedical Imaging and Bioengineering (K01 #EB006395) grant to PK, the SNPRC (NIH #P51-RR013986) and the NIH/NCRR (#1R01AG029412-01) grants to MDD and NIH (#P01 HD047675 and R24 RR013632) grants to GS.
Footnotes
Publisher's Disclaimer: This is a PDF file of an unedited manuscript that has been accepted for publication. As a service to our customers we are providing this early version of the manuscript. The manuscript will undergo copyediting, typesetting, and review of the resulting proof before it is published in its final citable form. Please note that during the production process errors may be discovered which could affect the content, and all legal disclaimers that apply to the journal pertain.
References
- 1.Stewart CB, Disotell TR. Primate evolution - in and out of Africa. Curr Biol. 1998;8(16):R582–8. doi: 10.1016/s0960-9822(07)00367-3. [DOI] [PubMed] [Google Scholar]
- 2.Levitt P. Structural and functional maturation of the developing primate brain. J Pediatr. 2003;143(4 Suppl):S35–45. doi: 10.1067/s0022-3476(03)00400-1. [DOI] [PubMed] [Google Scholar]
- 3.Van Essen DC, Dierker DL. Surface-based and probabilistic atlases of primate cerebral cortex. Neuron. 2007;56(2):209–25. doi: 10.1016/j.neuron.2007.10.015. [DOI] [PubMed] [Google Scholar]
- 4.Armstrong E, et al. Cortical gyrification in the rhesus monkey: a test of the mechanical folding hypothesis. Cereb Cortex. 1991;1(5):426–32. doi: 10.1093/cercor/1.5.426. [DOI] [PubMed] [Google Scholar]
- 5.Williams JT, Blangero J. Comparison of variance components and sibpair-based approaches to quantitative trait linkage analysis in unselected samples. Genet Epidemiol. 1999;16(2):113–34. doi: 10.1002/(SICI)1098-2272(1999)16:2<113::AID-GEPI1>3.0.CO;2-6. [DOI] [PubMed] [Google Scholar]
- 6.Williams JT, Blangero J. Power of variance component linkage analysis to detect quantitative trait loci. Ann Hum Genet. 1999;63(Pt 6):545–63. doi: 10.1017/S0003480099007848. [DOI] [PubMed] [Google Scholar]
- 7.Blangero J. Localization and identification of human quantitative trait loci: king harvest has surely come. Curr Opin Genet Dev. 2004;14(3):233–40. doi: 10.1016/j.gde.2004.04.009. [DOI] [PubMed] [Google Scholar]
- 8.Havill LM, et al. A quantitative trait locus for normal variation in forearm bone mineral density in pedigreed baboons maps to the ortholog of human chromosome 11q. J Clin Endocrinol Metab. 2005;90(6):3638–45. doi: 10.1210/jc.2004-1618. [DOI] [PubMed] [Google Scholar]
- 9.Havill LM, et al. The quantitative trait linkage disequilibrium (QTLD) test: A more powerful alternative to QTDT for use in the absence of population stratification. BMC Genet. doi: 10.1186/1471-2156-6-S1-S91. In press. [DOI] [PMC free article] [PubMed] [Google Scholar]
- 10.Rainwater DL, et al. Localization of genes that control LDL size fractions in baboons. Atherosclerosis. 2003;168(1):15–22. doi: 10.1016/s0021-9150(03)00051-0. [DOI] [PubMed] [Google Scholar]
- 11.Tejero ME, et al. Genome-wide scan of resistin mRNA expression in omental adipose tissue of baboons. Int J Obes (Lond) 2005;29(4):406–12. doi: 10.1038/sj.ijo.0802699. [DOI] [PubMed] [Google Scholar]
- 12.Tejero ME, et al. Quantitative genetic analysis of glucose transporter 4 mRNA levels in baboon adipose. Obes Res. 2004;12(10):1652–7. doi: 10.1038/oby.2004.205. [DOI] [PubMed] [Google Scholar]
- 13.Welker W. Comparative structure and evolution of cerebral cortex, Part II, vol 8B. 8B. New York: 1990. Why does cerebral cortex fissure and fold? A review of determinants of gyri and sulci. A review of determinants of gyri and sulci; pp. 3–136. [Google Scholar]
- 14.Tamraz J, Comair Y. With functional correlations. New York: Springer; 2006. Atlas of regional anatomy of the brain using MRI. [Google Scholar]
- 15.Brodmann K, G J. Brodmann's: Localisation in the Cerebral Cortex. 1st. Springer; 2005. [Google Scholar]
- 16.Rademacher J, et al. Topographical variation of the human primary cortices: implications for neuroimaging, brain mapping, and neurobiology. Cereb Cortex. 1993;3(4):313–29. doi: 10.1093/cercor/3.4.313. [DOI] [PubMed] [Google Scholar]
- 17.Rademacher J, et al. Variability and asymmetry in the human precentral motor system. A cytoarchitectonic and myeloarchitectonic brain mapping study. Brain. 2001;124(Pt 11):2232–58. doi: 10.1093/brain/124.11.2232. [DOI] [PubMed] [Google Scholar]
- 18.Rademacher J, et al. Probabilistic mapping and volume measurement of human primary auditory cortex. Neuroimage. 2001;13(4):669–83. doi: 10.1006/nimg.2000.0714. [DOI] [PubMed] [Google Scholar]
- 19.Fischl B, et al. Cortical Folding Patterns and Predicting Cytoarchitecture. Cereb Cortex. 2007 doi: 10.1093/cercor/bhm225. [DOI] [PMC free article] [PubMed] [Google Scholar]
- 20.Armstrong E, et al. The ontogeny of human gyrification. Cereb Cortex. 1995;5(1):56–63. doi: 10.1093/cercor/5.1.56. [DOI] [PubMed] [Google Scholar]
- 21.Pillay P, Manger PR. Order-specific quantitative patterns of cortical gyrification. Eur J Neurosci. 2007;25(9):2705–12. doi: 10.1111/j.1460-9568.2007.05524.x. [DOI] [PubMed] [Google Scholar]
- 22.Neal J, et al. Insights into the gyrification of developing ferret brain by magnetic resonance imaging. J Anat. 2007;210(1):66–77. doi: 10.1111/j.1469-7580.2006.00674.x. [DOI] [PMC free article] [PubMed] [Google Scholar]
- 23.Zilles K, et al. Gyrification in the cerebral cortex of primates. Brain Behav Evol. 1989;34(3):143–50. doi: 10.1159/000116500. [DOI] [PubMed] [Google Scholar]
- 24.Hutsler JJ, Lee DG, Porter KK. Comparative analysis of cortical layering and supragranular layer enlargement in rodent carnivore and primate species. Brain Res. 2005;1052(1):71–81. doi: 10.1016/j.brainres.2005.06.015. [DOI] [PubMed] [Google Scholar]
- 25.Mugler JP, 3rd, Brookeman JR. Three-dimensional magnetization-prepared rapid gradient-echo imaging (3D MP RAGE) Magn Reson Med. 1990;15(1):152–7. doi: 10.1002/mrm.1910150117. [DOI] [PubMed] [Google Scholar]
- 26.Deichmann R, et al. Optimization of 3-D MP-RAGE sequences for structural brain imaging. Neuroimage. 2000;12(1):112–27. doi: 10.1006/nimg.2000.0601. [DOI] [PubMed] [Google Scholar]
- 27.Rogers J, et al. Heritability of brain volume, surface area and shape: An MRI study in an extended pedigree of baboons. Hum Brain Mapp. 2007;28(6):576–83. doi: 10.1002/hbm.20407. [DOI] [PMC free article] [PubMed] [Google Scholar]
- 28.Hata T, et al. Magnetic resonance imaging of the fetus: initial experience. Gynecol Obstet Invest. 1990;29(4):255–8. doi: 10.1159/000293329. [DOI] [PubMed] [Google Scholar]
- 29.Liu F, et al. Study of the development of fetal baboon brain using magnetic resonance imaging at 3 Tesla. Neuroimage. 2008;40(1):148–59. doi: 10.1016/j.neuroimage.2007.11.021. [DOI] [PMC free article] [PubMed] [Google Scholar]
- 30.Kochunov P, et al. A Retrospective Motion Correction Protocol for High-Resolution Anatomical MRI. Human Brain Mapping. 2006 doi: 10.1002/hbm.20235. [DOI] [PMC free article] [PubMed] [Google Scholar]
- 31.Smith SM. Fast robust automated brain extraction. Hum Brain Mapp. 2002;17(3):143–55. doi: 10.1002/hbm.10062. [DOI] [PMC free article] [PubMed] [Google Scholar]
- 32.Smith SM, et al. Advances in functional and structural MR image analysis and implementation as FSL. Neuroimage. 2004;23 1:S208–19. doi: 10.1016/j.neuroimage.2004.07.051. [DOI] [PubMed] [Google Scholar]
- 33.Kochunov P, et al. Regional spatial normalization: toward an optimal target. J Comput Assist Tomogr. 2001;25(5):805–16. doi: 10.1097/00004728-200109000-00023. [DOI] [PubMed] [Google Scholar]
- 34.Fox PT, Perlmutter JS, Raichle ME. A stereotactic method of anatomical localization for positron emission tomography. J Comput Assist Tomogr. 1985;9(1):141–53. doi: 10.1097/00004728-198501000-00025. [DOI] [PubMed] [Google Scholar]
- 35.Lancaster JL, et al. Global spatial normalization of human brain using convex hulls. J Nucl Med. 1999;40(6):942–55. [PubMed] [Google Scholar]
- 36.McLaren DG, et al. A population-average MRI-based atlas collection of the rhesus macaque. Neuroimage. 2008 doi: 10.1016/j.neuroimage.2008.10.058. [DOI] [PMC free article] [PubMed] [Google Scholar]
- 37.McLaren DG, et al. A population-average MRI-based atlas collection of the rhesus macaque. Neuroimage. 2009;45(1):52–9. doi: 10.1016/j.neuroimage.2008.10.058. [DOI] [PMC free article] [PubMed] [Google Scholar]
- 38.Kochunov P, et al. Mapping structural differences of the corpus callosum in individuals with 18q deletions using targetless regional spatial normalization. Hum Brain Mapp. 2005;24(4):325–31. doi: 10.1002/hbm.20090. [DOI] [PMC free article] [PubMed] [Google Scholar]
- 39.Kochunov P, et al. Evaluation of octree regional spatial normalization method for regional anatomical matching. Hum Brain Mapp. 2000;11(3):193–206. doi: 10.1002/1097-0193(200011)11:3<193::AID-HBM50>3.0.CO;2-Z. [DOI] [PMC free article] [PubMed] [Google Scholar]
- 40.Woods CG. Human microcephaly. Curr Opin Neurobiol. 2004;14(1):112–7. doi: 10.1016/j.conb.2004.01.003. [DOI] [PubMed] [Google Scholar]
- 41.Kochunov P, et al. Localized morphological brain differences between English-speaking Caucasians and Chinese-speaking Asians: new evidence of anatomical plasticity. Neuroreport. 2003;14(7):961–4. doi: 10.1097/01.wnr.0000075417.59944.00. [DOI] [PubMed] [Google Scholar]
- 42.Mangin JF, et al. Coordinate-based versus structural approaches to brain image analysis. Artif Intell Med. 2004;30(2):77–97. doi: 10.1016/S0933-3657(03)00064-2. [DOI] [PubMed] [Google Scholar]
- 43.Mangin JF, et al. From 3D Magnetic Resonance Images to Structural Representations of the Cortex Topography Using Topology Preserving Deformations. Journal of Mathematical Imaging and Vision. 1995;5:297–318. [Google Scholar]
- 44.Riviere D, et al. Automatic recognition of cortical sulci of the human brain using a congregation of neural networks. Med Image Anal. 2002;6(2):77–92. doi: 10.1016/s1361-8415(02)00052-x. [DOI] [PubMed] [Google Scholar]
- 45.Good CD, et al. Automatic differentiation of anatomical patterns in the human brain: validation with studies of degenerative dementias. Neuroimage. 2002;17(1):29–46. doi: 10.1006/nimg.2002.1202. [DOI] [PubMed] [Google Scholar]
- 46.Kochunov PV, Lancaster JL, Fox PT. Accurate high-speed spatial normalization using an octree method. Neuroimage. 1999;10(6):724–37. doi: 10.1006/nimg.1999.0509. [DOI] [PubMed] [Google Scholar]
- 47.Martin RD. Primate origins and Evolution. Princeton, NJ: Princeton University press; 1990. [Google Scholar]
- 48.Leigh SR. Brain growth, life history, and cognition in primate and human evolution. Am J Primatol. 2004;62(3):139–64. doi: 10.1002/ajp.20012. [DOI] [PubMed] [Google Scholar]
- 49.Barton RA. Primate brain evolution: Integrating comparative, neurophysiological and ethological data. Evolutionary Anthropol. 2006;15:224–236. [Google Scholar]
- 50.Kaas JH, Preuss TM. In: Human brain evolution, in Fundamental Neuroscience. Squire LRB, McConnell FE, Roberts SK, Spitzer JL, Zigmond NC, J M, editors. Academic Press; New York: 2003. pp. 1147–1166. [Google Scholar]
- 51.Schoenemann PT. Evolution of the size and functional areas of the human brain. Annual Rev Anthropol. 2006;35:379–406. [Google Scholar]
- 52.Zilles K, et al. The human pattern of gyrification in the cerebral cortex. Anat Embryol (Berl) 1988;179(2):173–9. doi: 10.1007/BF00304699. [DOI] [PubMed] [Google Scholar]
- 53.Rogers J, et al. On the genetic architecture of cortical folding and brain volume in primates. Proceedings of the national academy of sciences. 2008 doi: 10.1016/j.neuroimage.2010.02.020. In Review. [DOI] [PMC free article] [PubMed] [Google Scholar]