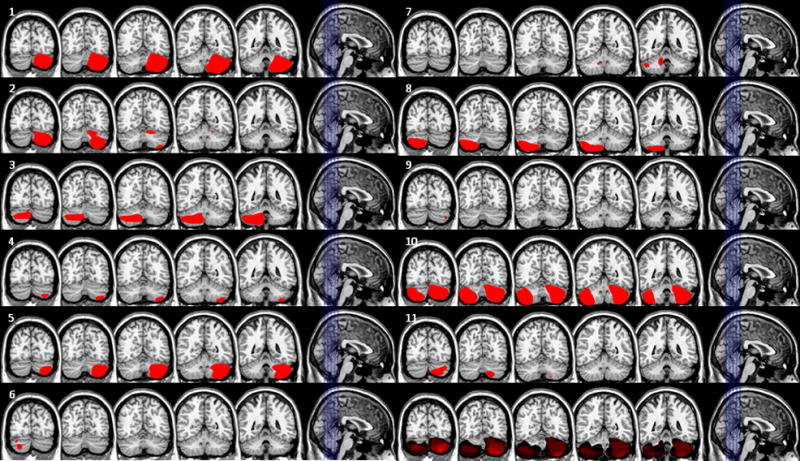
Figure 1.

Patient lesions. Each tile represents one patient. Slices are depicted in the leftmost image in each tile. The number in the upper left of each tile refers to the patient number in Table 1. The bottom right tile shows an overlap of all lesions.
