Abstract
Background. Although pancreas transplantation (PT) is the treatment of choice in selected diabetic patients, the International Pancreas Transplant Registry (IPTR) has reported important differences in activity between USA and Europe. Of all cases reported, 75% are from USA and only 23% from Europe. Therefore, an analysis of PT activity in selected European countries (SEC) and USA was performed.
Materials and methods. We compared national data reports (2002–06) of deceased donors (DD) and deceased solid organ transplantation (DSOT), with special attention to PT activity from 13 SEC countries (375 million inhabitants) and USA (298 million inhabitants).
Results. The number of PT performed in USA was 2-fold higher than in SEC, with the annual rate >2.4 times higher in USA [5.08–4.64 versus 1.61–1.91 per million population (p.m.p.)]. DD and other DSOT activity rates were only slightly higher in USA. In SEC, important differences in PT activity rate were found between countries in the same year (0–6.21 p.m.p.) and in the same country between different years (6.21–2.47 p.m.p.), unrelated to DD or other DSOT activity rate. PT activity rate increased in SEC from 1.61 to 1.91 p.m.p. but decreased in six countries. The waiting list for PT at the end of 2006 was almost 2-fold higher in USA than in SEC.
Conclusions. Differences in PT activity rate between 13 SEC countries and USA were not related to DD or other DSOT activity. Different waiting list inclusion criteria or incidence of diabetes complications may be considered in more specific studies.
Keywords: deceased donors, diabetes mellitus, pancreas transplantation, solid organ transplantation, transplant activity
Introduction
Despite improvement in insulin therapy, pancreas transplantation (PT) is currently the only treatment that restores normal glucose metabolism and substantially improves the quality of life in type 1 diabetes mellitus (T1DM) patients [1,2]. Depending on donor characteristics and the clinical condition of the recipient, there are differences in both graft and patient survival [3,4]. In diabetic patients with end-stage renal disease (ESRD), simultaneous pancreas-kidney transplantation (SPKT) offers lower patient mortality than patients on the waiting list or deceased donor (DD) kidney transplant recipients [5–9]. The advantage in patient survival of pancreas after kidney (PAKT) or pancreas transplantation alone (PTA) over conventional therapy remains controversial [5,6].
According to the International Pancreas Transplant Registry (IPTR), at 31 December 2004, >23 000 pancreas transplants had been reported, with a higher proportion performed in USA (n = 17 132) than in non-USA countries (n = 5294) where 89% were performed in Europe [3]. Moreover, between 2000 and 2004, the annual number of PT reported in USA remained constant at ~1400, while in non-USA countries, the number of reported cases decreased from >450 to ~250 in the same period [3]. The discrepancy in PT activity between USA and Europe may be due, at least in part, to differences in the reporting registry. While the IPTR has a relation with the United Network for Organ Sharing (UNOS) of USA and transplant activity report to UNOS is mandatory, such reports from non-USA countries are voluntary [3]. However other factors, such us decease organ donation, other deceased solid organ transplant (DSOT) activity, waiting list inclusion criteria and prevalence of T1DM or ESRD secondary to T1DM, may play a role in the differences of reported PT worldwide when adjusted to population.
The primary objective of the present study was to compare the true incidence of pancreas transplant activity between USA and 13 selected European countries (SEC) and secondly, to evaluate the relationship with deceased organ donation and other DSOT activity during the period between 2002 and 2006. Obviously, this could help to optimize pancreas transplant policies around the world.
Patients and methods
For the period 2002–06, we analysed databases from different national transplant organizations (France, Italy, Spain, Switzerland and United Kingdom) [10–14], other European countries included in organ exchange organizations, such as Eurotransplant (Austria, Belgium, Germany and The Netherlands) [15], Scandiatransplant (Denmark, Finland, Norway and Sweden) [16], and the UNOS from USA [17]. In all cases, the annual report included the period between 1 January and 31 December, except for the United Kingdom which analysed the financial year (between 1 April and 31 March of the next year) [14]. For the purposes of this study, the 13 European countries previously mentioned are defined as SEC. Other European countries with >105 million inhabitants had some PT activity, such as Bulgaria, Czech Republic, Croatia, Poland, Hungary, Portugal, Ireland and Rumania [18,19], but we were unable to obtain any data from their National Transplant Organizations. In order to ensure the validity of the results from database reports, these were checked independently by the four authors (JMGP, DM, LPT and PG) and then compared with the results published every year by the Council of Europe in the Transplant Newsletter [19]. In most cases, there were no differences or they were minimal and due to the inclusion of some islet cells transplantation activity (see below); in any case, the data reports from the different transplant organizations were taken as accurate.
The number of DD, PT, deceased donor kidney transplantations (DDKT), deceased donor liver transplantations (DDLT) and heart transplantations (HT) for each year was obtained. As the pancreas is the organ most frequently transplanted together with another organ, two categories of PT were considered according to the renal function of the recipient: SPKT in patients with ESRD and solitary PT in patients without current renal disease. Islet cell transplantation was not considered. Likewise, we recorded the number of patients on the pancreas transplant waiting list at the end of each year. As PT from living donors is only exceptionally performed; any transplant activity involving living donors was not included in the analysis.
In order to take into account demographic differences between countries for comparative purposes, the total number of PT, DD and other DSOT activity was calculated, and the rates were expressed as incidence per million population (p.m.p.). The population of each European country in the different years was obtained from the Statistical Office of the European Communities (Eurostat) [20] and the USA population from the US Census Bureau [21].
Results
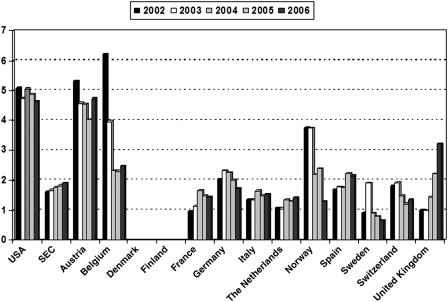
The total number corresponding to DD, PT activity and PT active waiting list are shown in Table 1 together with demographic changes in the different countries and years. In USA, the total number of PT decreased from 1460 in 2002 to 1386 in 2006 (−5%) and the rate from 5.08 p.m.p. in 2002 to 4.64 in 2006 (−8.7%). By contrast, in SEC, the total number increased from 591 in 2002 to 718 in 2006 (21.5%) as well as the rate from 1.61 p.m.p. in 2002 to 1.91 p.m.p. in 2006 (18.6%). This increment was mainly due to increased PT activity rate in five countries (France, Italy, The Netherlands, Spain and especially United Kingdom), which outweighed the decreases recorded in six other countries (Austria, Belgium, Germany, Norway, Sweden and Switzerland). In two SEC (Denmark and Finland), there was no reported PT activity during the period analysed (Table 1 and Figure 1). Only two SEC (Austria and Belgium) showed a higher rate of PT activity than USA for any of the 5 years analysed. Surprisingly, in Belgium, this rate decreased from 6.21 p.m.p. in 2002 to 2.47 p.m.p. in 2006 (−60.2%). The PT rate was at least 2.4 times higher in USA than in SEC for any of the 5 years analysed (Figure 1). In USA, the total number of SPKT increased from 905 in 2002 to 924 in 2006 (2%) representing 62 and 66.5%, respectively, of all PT activity. In SEC, the total number of SPKT increased from 457 in 2002 to 605 in 2006 (32.4%), representing 77 and 84.5%, respectively, of all PT activity. Only Italy showed a similar percentage of SPKT than USA, while Austria and Belgium showed a lower percentage than the SEC median (data not shown).
Table 1.
Population, total number of pancreas transplants, pancreas waiting list and DD in USA and 13 European countries
| USA | Europea | Austria | Belgium | Denmark | Finland | France | Germany | Italy | Netherlands | Norway | Spain | Sweden | Switzerland | UK | |
|---|---|---|---|---|---|---|---|---|---|---|---|---|---|---|---|
| Populationb | |||||||||||||||
| 2002 | 287.67 | 366.73 | 8.07 | 10.31 | 5.37 | 5.19 | 61.40 | 82.44 | 56.99 | 16.10 | 4.52 | 40.96 | 8.91 | 7.25 | 59.22 |
| 2003 | 290.34 | 368.82 | 8.10 | 10.36 | 5.38 | 5.21 | 61.83 | 82.54 | 57.32 | 16.19 | 4.55 | 41.66 | 8.94 | 7.31 | 59.44 |
| 2004 | 293.03 | 371.05 | 8.14 | 10.40 | 5.40 | 5.22 | 62.25 | 82.53 | 57.89 | 16.26 | 4.58 | 42.34 | 8.98 | 7.36 | 59.70 |
| 2005 | 295.73 | 373.34 | 8.21 | 10.45 | 5.41 | 5.24 | 62.64 | 82.50 | 58.46 | 16.30 | 4.61 | 43.04 | 9.01 | 7.41 | 60.06 |
| 2006 | 298.44 | 375.29 | 8.27 | 10.51 | 5.43 | 5.26 | 63.00 | 82.44 | 58.75 | 16.33 | 4.64 | 43.76 | 9.05 | 7.46 | 60.39 |
| Pancreas Txc | |||||||||||||||
| 2002 | 1460 | 591 | 43 | 64 | 0 | 0 | 59 | 161 | 77 | 17 | 17 | 69 | 8 | 13 | 59 |
| 2003 | 1373 | 614 | 37 | 41 | 0 | 0 | 70 | 191 | 77 | 17 | 17 | 74 | 17 | 14 | 59 |
| 2004 | 1483 | 657 | 37 | 24 | 0 | 0 | 103 | 187 | 95 | 22 | 10 | 74 | 8 | 11 | 86 |
| 2005 | 1444 | 678 | 33 | 24 | 0 | 0 | 92 | 165 | 87 | 21 | 11 | 96 | 7 | 9 | 133 |
| 2006 | 1386 | 718 | 39 | 26 | 0 | 0 | 90 | 141 | 90 | 23 | 6 | 94 | 6 | 10 | 193 |
| Pancreas WLd | |||||||||||||||
| 2002 | 2835 | 897 | 38 | 56 | 0 | 0 | 189 | 180 | 245 | 15 | 11 | 47 | 20 | 6 | 90 |
| 2003 | 2747 | 877 | 42 | 56 | 0 | 0 | 199 | 145 | 213 | 14 | 11 | 75 | 19 | 5 | 98 |
| 2004 | 2388 | 918 | 36 | 53 | 0 | 0 | 178 | 158 | 216 | 34 | 13 | 79 | 14 | 8 | 132 |
| 2005 | 2071 | 920 | 38 | 34 | 0 | 0 | 169 | 169 | 197 | 40 | 10 | 87 | 15 | 16 | 145 |
| 2006 | 1984 | 1009 | 32 | 30 | 0 | 0 | 169 | 190 | 222 | 40 | 10 | 73 | 15 | 21 | 207 |
| DDe | |||||||||||||||
| 2002 | 6190 | 6422 | 195 | 223 | 73 | 89 | 1198 | 1001 | 1020 | 202 | 62 | 1409 | 98 | 75 | 777 |
| 2003 | 6457 | 6598 | 187 | 248 | 75 | 85 | 1119 | 1110 | 1042 | 223 | 87 | 1443 | 114 | 95 | 770 |
| 2004 | 7150 | 6898 | 181 | 220 | 64 | 109 | 1291 | 1052 | 1203 | 228 | 90 | 1495 | 123 | 91 | 751 |
| 2005 | 7593 | 7159 | 200 | 237 | 63 | 85 | 1371 | 1185 | 1197 | 217 | 76 | 1546 | 128 | 90 | 764 |
| 2006 | 8024 | 7340 | 201 | 273 | 62 | 109 | 1442 | 1227 | 1231 | 200 | 76 | 1509 | 137 | 80 | 793 |
All 13 countries.
Million inhabitants.
Tx = transplants.
WL = waiting list.
DD = deceased donors.
Fig. 1.
Pancreas transplant activity rate (incidence per million population) in USA and 13 European countries considered together (SEC) and individually during the period 2002–06.
In USA, although the number of patients on the active waiting list for PT at the end of each year decreased from 2835 in 2002 to 1984 in 2006 (−30%) (Table 1), the number of candidates awaiting PT that remained inactive increased from 753 in 2002 to 1970 in 2006 (162%) (data not shown). The number of patients on the active waiting list in SEC increased from 897 in 2002 to 1009 in 2006 (12.5%). In five SEC countries (Austria, Belgium, France, Italy and Sweden), it decreased; in another five (Germany, The Netherlands, Spain, Switzerland and United Kingdom), it increased, while in Norway this number did not change. In Denmark and Finland, there were no patients on the active waiting list during the period analysed (Table 1). We found no data about inactive candidates on the PT waiting list in SEC.
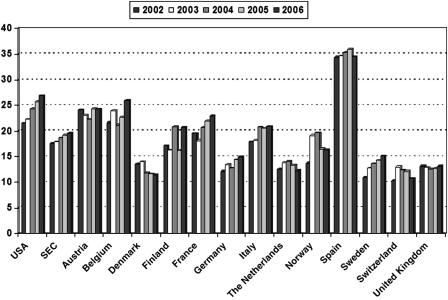
Deceased donation increased in USA from 6190 in 2002 to 8024 in 2006 (26%) and in SEC from 6422 in 2002 to 7340 in 2006 (14.3%) (Table 1). The DD rate was higher in USA (21.52 p.m.p. in 2002 and 26.89 p.m.p. in 2006) than in SEC (17.51 in 2002 and 19.56 in 2006), but the differences were not as high as in PT activity, only 1.2–1.38 times higher during the period analysed. Three SEC countries (Austria, Belgium and Spain) showed similar or higher DD activity rate than USA, while France, Finland and Italy showed a higher activity rate than the SEC median (Figure 2).
Fig. 2.
DD activity rate (incidence per million population) in USA and 13 European countries considered together (SEC) and individually during the period 2002–06.
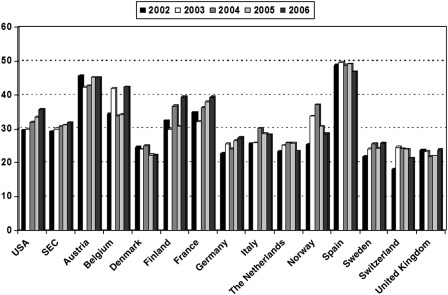
From 2002 to 2006, the total number of DDKT increased in both USA (from 8593 to 10 659; 24.8%) and SEC (from 10 736 to 11 955; 11.3%). Accordingly, DDKT activity rate was slightly higher in USA, but five SEC (Austria, Belgium, Finland, France and Spain) showed higher activity rate than USA (Figure 3).
Fig. 3.
Deceased kidney transplant activity rate (incidence per million population) in USA and 13 European countries considered together (SEC) and individually during the period 2002–06.
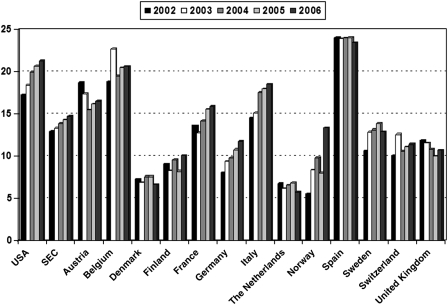
The total number of DDLT increased in USA from 4969 in 2002 to 6362 in 2006 (28%), whereas a lower increase was observed in SEC (from 4757 in 2002 to 5536 in 2006; 16.4%). DDLT activity rate was higher in USA (17.27–21.32 p.m.p.) than in SEC (12.97–14.75 p.m.p.) between 2002 and 2006, but the differences were not as high as in PT (only 1.3–1.44 times higher). Only two SEC countries (Belgium and Spain) showed a higher DDLT activity rate than USA (Figure 4).
Fig. 4.
Deceased liver transplant activity rate (incidence per million population) in USA and 13 European countries considered together (SEC) and individually during the period 2002–06.
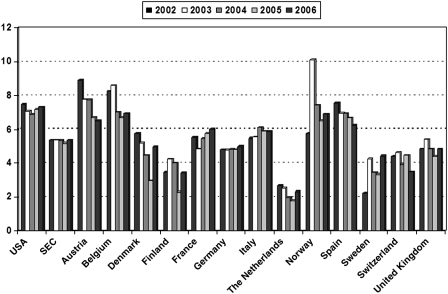
The total number of HT was similar between 2002 and 2006 in USA (2155–2192; 1.7%) and SEC (1970–2011; 2.1%), with a higher activity rate in USA. Nevertheless, four SEC (Austria, Belgium, Norway and Spain) showed a similar or higher HT activity rate than USA (Figure 5).
Fig. 5.
Heart transplant activity rate (incidence per million population) in USA and 13 European countries considered together (SEC) and individually during the period 2002–06.
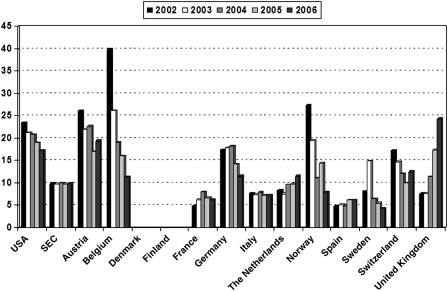
The percentage of pancreata recovered and transplanted from DD was higher in USA (23.6% in 2002 and 17.3% in 2006) than in SEC (9.2% in 2002 and 9.9% in 2006), but overall, this percentage decreased in USA with respect to SEC. However, five SEC (Austria, Belgium, Germany, Norway and Switzerland) showed an important decrease in this percentage, while in four (France, The Netherlands, Spain and specially United Kingdom), it increased (Figure 6).
Fig. 6.
Number of pancreata recovered and transplanted from every 100 DD in USA and 13 European countries considered together (SEC) and individually during the period 2002–06.
Discussion
Several observations on this analysis may be made. Firstly, a large number of PT performed in non-USA countries are not reported to the IPTR. Secondly, in USA, the rate of PT was much higher than in SEC. Thirdly, there was great variability between SEC countries in PT activity not related to the number of DD or other organ transplant activity. Finally, despite the increase in the number of patients on the PT waiting list in some countries, a high percentage of pancreata are not recovered from DD.
The latest report of the IPTR, published in 2005, estimated that <10% of non-USA PT activity was not captured by the Registry, with <250 cases reported in 2004 [3]. However in that year, our analysis showed that, in the 13 SEC analysed, the total number of PT performed were 657 cases. Moreover, according to other sources [18,19], in 2004, >200 PT cases were performed in Australia, New Zealand, Canada, Turkey, Argentina, Uruguay, Republic of Korea, Japan, Saudi Arabia and other European countries (Czech Republic, Poland, Bulgaria, Hungary, Portugal, Ireland and Romania). Additionally, in Brazil, with no data for 2004, a total of 173 cases were reported in 2006 to the Global Observatory on Donation and Transplantation [18]. According to these data, recent PT activity from non-USA countries may be higher than 1000 cases per year, with no >30% being reported to the IPTR. Mandatory reporting of all PT activity from national registries to the IPTR is needed to allow worldwide comparisons.
We found important differences between countries in PT activity rate not related to DD or other DSOT activity. This conclusion is sustained for different reasons. Although in USA, the DD and other DSOT activity rates were higher than in SEC, the differences were much higher in PT. Moreover, while DD and other DSOT activity rate increased in most countries, PT activity showed important variability regardless of the evolution in DD or other transplant activity. Furthermore, the differences observed between countries in the same year and in the same country in different years did not show a similar evolution in DD and other DSOT activity rate. Another important difference between USA and SEC is the higher percentage of SPKT in SEC due to a lower proportion of solitary PT performed in most SEC. It is plausible that in USA, with a higher living donor kidney transplantation rate than SEC [19], the high percentage of PAKT in which the kidney came from a living donor (>60%) [3] may help to explain this difference.
Another aspect highlighted by this analysis is the evolution of the PT waiting list. It decreased in USA and increased in SEC despite the inverse evolution in PT activity. The waiting list increase in SEC was mainly due to the increment of candidates for PT in The Netherlands, Spain and especially United Kingdom; however, these countries together with France and Italy are the ones that contribute to the overall increase in PT activity in SEC. Paradoxically, the number of candidates on the active waiting list at the end of 2006 was almost 2-fold higher in USA with a lower population than in SEC. However, this may be due to different criteria for registration on the waiting list (older candidates) and different allocation policies as has been observed in USA [22,23]. In addition, the gap between the demand (number of candidates on the active waiting list) and the number of PT performed is higher in USA and again, important differences were found between countries. It increased in Belgium, Germany, The Netherlands, Norway and Switzerland but dropped in USA, Austria, France, Italy, Sweden and United Kingdom. This gap has been ‘negative’ (the number of PT performed per year was higher than the number of waiting list candidates at the end of the year), only occasionally in Austria, Belgium, Germany, The Netherlands and more frequently in Norway, Spain and Switzerland. In general, a very large gap may indicate the need for greater PT activity.
Pancreas underutilization is another important challenge and has been considered an important issue in USA [22,24]. When comparing practises in SEC, we found variable proportions of DD from whom pancreata were recovered and transplanted. This proportion shows important changes between countries and years, varying from <5 to >25%. This may reflect the increased number of older donors, although the lack of experience in some recovery teams has been also considered [22,25]. PT activity actually decreased during the period analysed in most countries and only increased in France, The Netherlands, Spain and especially in the United Kingdom. It may also be speculated that the option of maintaining the patient with insulin therapy plays a role in pancreas underutilization and most transplant teams only accept ideal organs [25]. In this respect, studies from USA showed that the non-recovery rate and the discard rate among recovered pancreata increased in recent years [24,25]. Taking into account these data, important efforts must be made to improve the underutilization of pancreata from DD, especially in those countries with a long waiting list.
Other reasons could account for the differences observed in PT activity rate between countries. A higher prevalence of T1DM in USA than in Europe is one possibility. However, according to the International Diabetes Federation and the Diabetes Mondiale Project Group, the incidence of T1DM in children (0–14 age range) is higher in Europe than in North-America, with a very high incidence (>20/100 000 per year) observed in Finland, Norway, Sweden and United Kingdom [26,27]. More important than the incidence of T1DM in children is, in this case, the incidence of ESRD, at any age, secondary to T1DM. However, we found a very limited number of studies analysing this issue in recent scientific literature [28–31]. This incidence varies in Europe in 1999–2000, between 16.3 cases p.m.p. in Denmark, ~13 cases p.m.p. in Finland, Sweden and United Kingdom (Scotland), 8.3 cases p.m.p. in Austria, ~6 cases p.m.p. in Spain (Catalonia), Norway and The Netherlands and 3.8 cases p.m.p. in Belgium (French-speaking) [28–30]. Although this incidence has increased in most countries with respect to the period 1991–92, it decreased in Austria and especially in Belgium [28], and in more recent years, it stabilized in Denmark [29] and decreased in The Netherlands [30]. This may be a reason for the decrease in PT activity in some countries. On the other hand, according to reports of the United States Renal Data System, it can be calculated that the incidence of ESRD secondary to T1DM decreased in USA from ~16 cases p.m.p. in the period 1997–2001 to 13 cases p.m.p. in the period 2002–06 [32,33]. The higher incidence of ESRD secondary to T1DM in USA compared with SEC with a lower incidence of T1DM may be due to an increased risk of this complication among ethnic minorities (blacks and Hispanics) in USA [34,35], although the role of disparities in access to health care (universal in Europe and mostly private in USA), especially for chronic disease such as T1DM, requiring prolonged and regular treatment, should also be considered [35].
Other potential explanations for the observed discrepancies in PT may include different insurance reimbursement policies and attitudes regarding the indication for PT, as reflected by the different statements issued by scientific societies [36–39]. However, these factors may play a minor role because PT is covered by the different national health systems or private insurance in most SEC or by Medicare in USA (except for PTA in USA which has only been covered since April 2006) [22]. Moreover, similar specific recommendations for PT in diabetic patients have been published by the American Diabetes Association, the National Kidney Foundation and the American Society of Transplantation [36–38] as well as the European Renal Association and the European Society for Transplantation [39].
Finally, it is plausible that the clinical criteria for inclusion on a PT waiting list vary between countries and even between different teams in the same country, as previously reported for SPKT in The Netherlands [7]. As an example, SPKT is not indicated for ESRD diabetic patients in countries with a high incidence of this complication (Denmark and Finland), where kidney transplant alone (KTA) with more intensive treatment is the therapeutic option used with improved results in patient survival in recent years [16,40]. In addition, in USA, ~7% of all SPKT are performed in type 2 diabetic patients [3], while there are no comparable data from SEC. Although in a single-centre study from Spain, this percentage was similar (5.2%) [41], specific studies in the different SEC are needed in order to determine whether there are differences in this attitude. The development of PT has been historically limited by the lack of randomized, controlled trials and relatively poor survival but currently, surgical and immunosuppressive advances have improved the results [42]. Although KTA is clearly associated with a significant increase in life expectancy when compared with diabetic patients remaining on the waiting list [43], there is controversy as to whether adding a pancreas contributes independently to patient survival. While large population multi-centre and single-centre studies comparing SPKT versus KTA have found longer patient survival for SPKT recipients [7], registry-based analysis showed contradictory results [9,44–46], probably limited to the information available in the database from registries. In addition, the clear and significantly lower mortality risk, after the 3 months post-transplantation period, in SPKT as compared with patients who remained on the waiting list [5,6,9], is less evident for PAKT and PTA [5,6]. These discrepancies may be a reason for the differences in prevailing attitudes in the medical community worldwide. A future survey of practitioners in Europe and perhaps in USA will better delineate the current position regarding the utility of PT. Although a decade ago, SPKT was considered as optimal and the treatment of choice for juvenile diabetic patients with ESRD for an increasing number of centres in Europe [47], currently this approach remains uncommon and even inexistent in some European countries. Due to the high mortality, while on dialysis, of this population [9,43], a debate is needed about the reasons of disparities in PT activity in Europe.
In conclusion, PT activity rate and active waiting list candidates were higher in USA than in SEC countries. The differences were not related to deceased donation or other deceased transplant activity and are likely to be multifactorial. Future analyses are needed to determine whether these results are due to differences in clinical indication for PT, higher incidence of diabetic nephropathy secondary to T1DM or other unknown reasons.
Acknowledgments
This study was supported by Instituto de Salud Carlos III Retic RD06/0016 (RedInRen).
Conflict of interest statement None declared.
References
- 1.Katz H, Homan M, Velosa J, et al. Effects of pancreas transplantation in postprandial glucose metabolism. N Engl J Med. 1991;325:1278–1283. doi: 10.1056/NEJM199110313251804. [DOI] [PubMed] [Google Scholar]
- 2.Landgraf R. Impact of pancreas transplantation on diabetic secondary complications and quality of life. Diabetologia. 1996;39:1415–1424. doi: 10.1007/s001250050593. [DOI] [PubMed] [Google Scholar]
- 3.Gruessner AC, Sutherland ER. Pancreas transplant outcomes for United States (US) and non-US cases reported to the United Network for Organ Sharing (UNOS) and the International Pancreas Transplant Registry (IPTR) as of June 2004. Clin Transplant. 2005;19:433–455. doi: 10.1111/j.1399-0012.2005.00378.x. [DOI] [PubMed] [Google Scholar]
- 4.Leitchtman AB, Cohen D, Keith D, et al. Kidney and pancreas transplantation in the United States, 1997–2006: the HRSA breakthrough collaboratives and the 58 DSA challenge. Am J Transplant. 8:946–957. doi: 10.1111/j.1600-6143.2008.02173.x. [DOI] [PubMed] [Google Scholar]
- 5.Venstrom JM, McBride MA, Rother KI, et al. Survival after pancreas transplantation in patients with diabetes and preserved renal function. JAMA. 2003;290:2817–2823. doi: 10.1001/jama.290.21.2817. [DOI] [PubMed] [Google Scholar]
- 6.Gruessner RWG, Sutherland DER, Gruessner AC. Mortality assessment for pancreas transplants. Am J Transplant. 2004;4:2018–2026. doi: 10.1111/j.1600-6143.2004.00667.x. [DOI] [PubMed] [Google Scholar]
- 7.Smets Y.F.C., Westendrop R.G.J., Van de Pijl J.W., et al. Effects of simultaneous pancreas-kidney transplantation on mortality of patients with type 1 diabetes mellitus and end stage renal failure. Lancet. 1999;353:1915–1919. doi: 10.1016/S0140-6736(98)07513-8. [DOI] [PubMed] [Google Scholar]
- 8.Becker BN, Brazy PC, Becker YT, et al. Simultaneous pancreas-kidney transplantation reduces excess mortality in type 1 diabetic patients with end-stage renal disease. Kidney Int. 2000;57:2129–2135. doi: 10.1046/j.1523-1755.2000.00064.x. [DOI] [PubMed] [Google Scholar]
- 9.Ojo AO, Meier-Kriesche HU, Hanson JA, et al. The impact of simultaneous pancreas-kidney transplantation on long term patient survival. Transplantation. 2001;71:82–90. doi: 10.1097/00007890-200101150-00014. [DOI] [PubMed] [Google Scholar]
- 10.2006 Rapport annuel. Bilan des activités. http://www.agence-biomedecine.fr/uploads/document/rapp-synth2007.pdf. 3 March 2009, date last accessed.
- 11.Statistiche – Anno 2006. http://www.trapianti.ministerosalute.it/cnt/cntPagineConBox.jsp?id =18&area =cnt-generale&menu =menuPrincipale&label =datdoc&livello =1. 26 February 2009, date last accessed. [Google Scholar]
- 12.Estadísticas. http://www.ont.es/Home?id_nodo =124. 26 February 2009, date last accessed. [Google Scholar]
- 13.Annual Report 2006. www.swisstransplant.org/eng/More/Annual-reports/Annual-report-2006. 26 February 2009, date last accessed.
- 14.Transplant Activity in the UK. http://www.uktransplant.org.uk/ukt/statistics/transplant_activity_report/current_activity_reports/ukt/transplant_activity_uk_2006-2007.pdf. 23 February 2009, date last accessed.
- 15.Annual Reports 2002-2006. http://www.eurotransplant.nl. 21 January 2009, date last accessed.
- 16.Waiting List and Transplantation Figures according to European Standard 2002-2006. http://www.scandiatransplant.org. 2 January 2009, date last accessed. [Google Scholar]
- 17.2007 Annual Report of the U.S. Organ Procurement and Transplantation Network and the Scientific Registry of Transplant Recipients: Transplant Data 1997-2006. Health Resources and Services Administration, Healthcare Systems Bureau, Division of Transplantation. http://optn.transplant.hrsa.gov/latestData/viewDataReports.asp (26 January 2009, date last accessed)
- 18.World Transplant Information – data. http://www.transplant-observatory.org/default.aspx (28 June 2008, date last accessed)
- 19.Newsletter Transplant 2003-2007. http://www.ont.es/Home?id_nodo =124. (11 February 2009, date last accessed)
- 20.Demography. Main Demography Indicators. Total Population. http://epp.eurostat.ec.europa.eu/portal/page/portal/statistics/search_database (20 December 2008, date last accessed) [Google Scholar]
- 21.Country Rankings 2002-2006. http://www.census.gov/ipc/www/idb/summaries.html (20 December 2008, date last accessed)
- 22.Andreoni KA, Brayman KL, Guidinger MK, et al. Kidney and pancreas transplantation in the United States, 1996-2005. Am J Transplant. 2007;7:1359–1375. doi: 10.1111/j.1600-6143.2006.01781.x. [DOI] [PubMed] [Google Scholar]
- 23.Port FK, Merion RM, Roys EC, et al. Trends in organ donation and transplantation in the United States. Am J Transplant. 2008;8:911–921. doi: 10.1111/j.1600-6143.2008.02170.x. [DOI] [PubMed] [Google Scholar]
- 24.Sung RS, Galloway J, Tuttle-Newhall JE, et al. Organ donation and utilization in the United States 1997-2006. Am J Transplant. 2008;8:922–934. doi: 10.1111/j.1600-6143.2008.02171.x. [DOI] [PubMed] [Google Scholar]
- 25.Stegall MD, Dean PG, Sung R, et al. The rationale for the new deceased donor pancreas allocation schema. Transplantation. 2007;83:1156–1161. doi: 10.1097/01.tp.0000261104.27113.05. [DOI] [PubMed] [Google Scholar]
- 26.International Diabetes Federation. Diabetes Atlas. Downloads. Graphics. Charts. www.eatlas.idf.org (18 December 2008, date last accessed)
- 27.Karvonen M, ViiK-Kajander M, Libman I, et al. Diabetes Mondiale (DiaMond) Project Group. Incidence of childhood type 1 diabetes worldwide. Diabetes Care. 2000;23:1516–1526. doi: 10.2337/diacare.23.10.1516. [DOI] [PubMed] [Google Scholar]
- 28.Van Dijk PCW, Jager KJ, Stengel B, et al. Renal replacement therapy for diabetic end-stage renal disease: data from 10 registries in Europe (1991-2000) Kidney Int. 2005;67:1489–1499. doi: 10.1111/j.1523-1755.2005.00227.x. [DOI] [PubMed] [Google Scholar]
- 29.Sorensen VR, Hansen PM, Heaf J, et al. Stabilized incidence of diabetic patients referred for renal replacement therapy in Denmark. Kidney Int. 2006;70:187–191. doi: 10.1038/sj.ki.5001516. [DOI] [PubMed] [Google Scholar]
- 30.Gansevoort RT, Van Der HB, Stegeman CA. Trends in the incidence of treated end-stage renal failure in The Netherlands: hope for the future? Kidney Int. 2004;92 (suppl):S7–S10. doi: 10.1111/j.1523-1755.2004.09202.x. [DOI] [PubMed] [Google Scholar]
- 31.Villar E, Chang SH, McDonald SP. Incidences, treatments, outcomes, and sex effect on survival in patients with end-stage renal disease by diabetes status in Australia and New Zealand (1991–2005) Diabetes Care. 2007;30:3070–3076. doi: 10.2337/dc07-0895. [DOI] [PubMed] [Google Scholar]
- 32.USRDS: US Renal Data System 2003 Annual Data Report.
- 33.USRDS: US Renal Data System 2008 Annual Data Report. [DOI] [PubMed]
- 34.Karter AJ, Ferrara A, Liu JY, et al. Ethnic disparities in diabetic complications in an insured population. JAMA. 2002;287:2519–2527. doi: 10.1001/jama.287.19.2519. [DOI] [PubMed] [Google Scholar]
- 35.Lanting LC, Joung IMA, Mackenbach JP, et al. Ethnic differences in mortality, end stage complications, and quality of care among diabetic patients. Diabetes Care. 2005;28:2280–2288. doi: 10.2337/diacare.28.9.2280. [DOI] [PubMed] [Google Scholar]
- 36.Robertson RP, Davis C, Larsen J, et al. American Diabetes Association Pancreas and islet transplantation in type 1 diabetes. Diabetes Care. 2006;29:935. doi: 10.2337/diacare.29.04.06.dc06-9908. [DOI] [PubMed] [Google Scholar]
- 37.Gaston RS, Basadonna G, Cosio FG, et al. Transplantation in the diabetic patient with advanced chronic renal disease: a task force report. Am J Kidney Dis. 2004;44:529–542. [PubMed] [Google Scholar]
- 38.Hariharan S, Pirsch JD, Lu CY, et al. Pancreas after kidney transplantation. Nephrol Dial Transplant. 2002;13:1109–1118. doi: 10.1681/ASN.V1341109. [DOI] [PubMed] [Google Scholar]
- 39.European Best Practice Guidelines for Renal Transplantation (Part 1) Produced by the EBPG Expert Group on renal transplantation. Section I: Evaluation, selection and preparation of the potential transplant recipient. Nephrol Dial Transplant. 2000;15:s3–s38. [Google Scholar]
- 40.Sorensen VR, Mathiesen ER, Heaf J, et al. Improved survival rate in patients with diabetes and end-stage renal disease in Denmark. Diabetologia. 2007;50:922–929. doi: 10.1007/s00125-007-0612-5. [DOI] [PubMed] [Google Scholar]
- 41.Smatjes E, Fernandez C, Rueda S, et al. The utility of C-peptide in the phenotyping of patients candidates for pancreas transplantation. Clin Transplant. 2007;21:358–362. doi: 10.1111/j.1399-0012.2007.00649.x. [DOI] [PubMed] [Google Scholar]
- 42.Dean PG, Kudva YC, Stegall MD. Long term benefits of pancreas transplantation. Curr Opin Organ Transpl. 2008;13:85–90. doi: 10.1097/MOT.0b013e3282f2fd7f. [DOI] [PubMed] [Google Scholar]
- 43.Wolfe RA, Ashby VB, Milford EL, et al. Comparison of mortality in all patients on dialysis, patients on dialysis awaiting transplantation, and recipients of a first cadaveric transplant. N Engl J Med. 1999;341:1725–1730. doi: 10.1056/NEJM199912023412303. [DOI] [PubMed] [Google Scholar]
- 44.Bunnapradist S, Cho YW, Cecka M, et al. Kidney allograft and patient survival in type 1 diabetes mellitus of cadaveric kidney alone versus simultaneous pancreas/kidney transplants: a multivariate analysis of the UNOS database. J Am Soc Nephrol. 2003;14:208–213. doi: 10.1097/01.asn.0000037678.54984.41. [DOI] [PubMed] [Google Scholar]
- 45.Waki K, Terasaki PI. Kidney graft and patient survival with and without a simultaneous pancreas utilizing contralateral kidney from the same donor. Diabetes Care. 2006;29:1670–1672. doi: 10.2337/dc05-2380. [DOI] [PubMed] [Google Scholar]
- 46.Morata C, Séller M, Doler B, et al. Metabolic control improves long-term renal allograft and patients survival in type 1 diabetes. J Am Soc Nephrol. 2008;19:1557–1563. doi: 10.1681/ASN.2007070804. [DOI] [PMC free article] [PubMed] [Google Scholar]
- 47.Ringe B, Braun F. Pancreas transplantation: where do we stand in Europe in 1997. Nephrol Dial Transplant. 1997;12:1100–1103. doi: 10.1093/ndt/12.6.1100. [DOI] [PubMed] [Google Scholar]


