Abstract
Imaging β rays in vivo will help to advance microdosimetry and radiopharmaceutical development. In an earlier paper [1], we reported a newly developed system capable of directly imaging high-energy electron emissions in small animals in vivo. In this paper, we have thoroughly characterized the performance of the system. We have measured the sensitivity and detectability and the spatial resolution at various magnifications, as well as the linearity of the system. The system has also demonstrated the capability of directly detecting conversion electrons and positrons as well as β rays. The system has been applied to dynamically image spatiotemporal 18F-Fluorodeoxyglucose (FDG) uptake distributions in xenograft small tumors in dorsal window chambers on mice in vivo. Heterogeneity in FDG uptake in millimeter-sized tumors has been observed.
Index Terms: Charged particle, dynamic imaging, in vivo, resolution, sensitivity
I. INTRODUCTION
MANY IMAGING technologies have been developed to detect the β-ray emissions from radioactive objects. Gas detectors are combined with position-sensitive readout and dedicated electronics to provide the spatial information of detected β rays [2]–[5]. Silicon strip detectors are used orthogonally to construct 2D images [6]. Charge-coupled devices (CCD), complementary metal-oxide semiconductors (CMOS), and hybrid detector technologies are exposed directly to β-ray emissions to form 2D images [7]–[9]. Scintillators are used in several β imaging systems in conjunction with light detectors such as CCD and CMOS arrays. In some applications, excited light out of the scintillators is further amplified, e.g., by multiple microchannel plates, to improve sensitivity [10]–[13]. Other applications use thicker scintillators to improve excited-light production [14]–[16].
We have developed a very simple imaging system using an ultra-thin phosphor and a lens-coupled CCD camera to directly sense charged particles such as βs and positrons (such as from 18F). The ultra-thin phosphor ensures a much improved spatial resolution because of the reduced particle scattering within the phosphor material. A charged particle within any material travels a tortuous path ranging from less than a micron to several millimeters, losing some energy and changing direction at each collision. More particle scattering occurs in thicker detectors, and the further the charged particle travels the more it deviates from its origin and the lower the resolution will be. The thickness of the detector and the composition of the detector material will have significant effects on the spatial resolution of any β-ray imaging system. To improve the resolution of a β-ray detector, a thin detector material is desired. A thinner phosphor means smaller absorption probability or quantum efficiency for photons, but just less light from charged particles.
Recent advances in CCDs have improved their sensitivity in many ways. Cooling reduces dark current, and slow readout speeds result in reduced electronic noise. Backthinned detectors have increased quantum efficiencies to more than 90%. The detecting area has been increased as well. These new technologies lead to improved sensitivity in light detection with CCDs, allowing use of thinner phosphors and avoiding need for an image intensifier. By using a modern CCD with an ultra-thin phosphor, the new system has enough sensitivity and suitable configuration to image superficial structures in vivo both statically and dynamically at high resolution.
In an earlier paper [1], we introduced the basic configuration of our charged-particle imaging system. Some initial results were reported on the measured spatial resolution and the sensitivity at unit magnification. The system was used in vivo to image an exposed organ in a mouse. In this paper, we discuss the details of the system configuration in Section II. Systematic measurements of the imaging performance of the system at 4 different magnifications are then presented in Section III. We discuss some applications using the system to image tumors dynamically in Section IV. Finally, the conclusions and further discussion are presented in Section V.
II. SYSTEM CONFIGURATION
The charged-particle system uses an ultra-thin phosphor, an imaging lens assembly, and a low-noise CCD camera. The CCD camera is VersArray 1300B back-illuminated scientific grade CCD (Princeton Instruments, Trenton, NJ, US). The CCD pixels are 20 µm × 20µm squares. The dark current in each pixel is 4 e−/pixel/hour, and the readout noise is 4e−/pixel RMS. The conversion gain of the CCD is 0.8 e−/ADU. The lens assembly is mounted on the CCD and focused on the phosphor which is placed in contact with a radioactive object to be imaged. Each charged particle emitted out of the object surface passes through the phosphor and deposits some of its kinetic energy in the phosphor. The phosphor is excited by the deposited energy and emits visible light. The CCD camera then captures an image which represents the spatial distribution of the radioactivity in the charged-particle-emitting object.
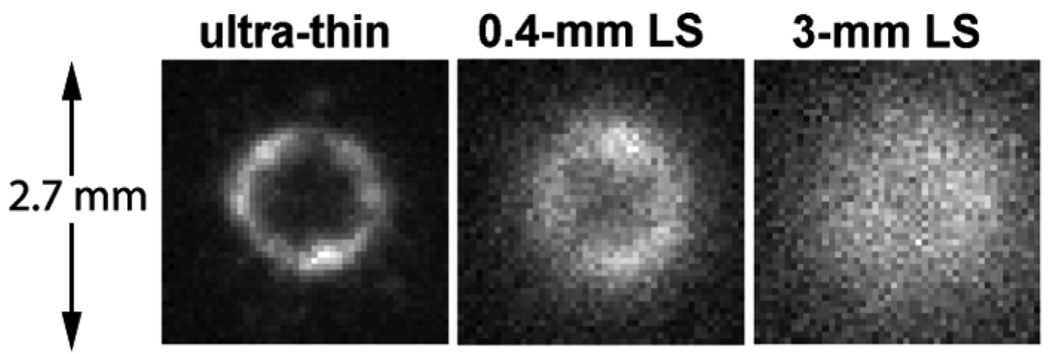
The ultra-thin phosphor is made of a mono-layer of 3-µm P47 phosphor powder coated on a 3-µm thick clear Mylar foil (Applied Scintillation Technologies, Essex, UK). The choice of the phosphor is critical to the system performance, especially to the spatial resolution. To illustrate the effects of phosphor thickness on the spatial resolution, images of a radioactive marker were obtained with the phosphor or with liquid scintillators at 2 different thicknesses (Fig. 1).
Fig. 1.
Electron images of a 3.7 kBq (100 nCi) 90Y/90Srβ marker produced by an ultra-thin phosphor, a shallow liquid scintillator (LS), and a deep LS at 1X magnification. The exposure time was 2 seconds for each image.
The radioactive marker was made of a 3.7 kBq (100 nCi) 90Y/90Sr source (Isotope Products Laboratory, Valencia, CA, US). The source was selected due to its long half life and the clinical significance of 90Y. In the marker, the radioactive salt was evaporated on a 3-mm diameter area (the diameter measured on the image was actually 1.6 mm) of a 23.8-mm diameter 6.4-µm thick Mylar foil. A second identical Mylar foil was used to cover the source, and the 2 foils were clamped together by a removable aluminum ring holder. The 2 types of isotopes were in equilibrium, and the source contained 1.85 kBq (50 nCi) 90Y and 1.85 kBq (50 nCi) 90Sr.
As shown in Fig. 1, the image taken with the 3-µm thick ultra-thin phosphor revealed the annular structure of the activity deposited inside the source area and the nonuniform distribution of the activity along the annulus. For comparison, a liquid scintillator EcoLite (MP Biomedicals, Solon, OH, US) was put on the marker surface using a small plastic well. The bottom of the well was 2.5 µm thick. Using liquid scintillators of progressive depths resulted in increasingly blurred images of the same source. The images using a 400-µm thick liquid scintillator showed fuzzy annular structure of the isotope deposition, but the nonuniform distribution along the annulus was difficult to resolve. When the liquid scintillator was 3 mm thick, the image became a bright blob with gradually fading edges, and the annular structure became a “point”.
For the experiments described in this paper, two camera lenses with large apertures were mounted face to face, forming a single imaging-lens assembly. Each lens was focused to infinity; an object was placed on the focal plane of one lens and the CCD on the focal plane of the other lens. The image magnification is the ratio of the focal length of the lens facing the CCD to that of the lens facing the object. One of the most useful assemblies is a pair of identical infinite-conjugate lenses, such as two f/1.2 50-mm Nikkor lenses, to image at unit magnification. The light-collecting cone of the lens pair is 4 times that of a single lens used at unit magnification. Combining lenses of different focal lengths can adjust the magnification and hence the effective pixel size. The size of the effective field of view (FOV) changes accordingly because the detecting area of the CCD is constant. When the effective pixel size dominates the blur in an image, a higher magnification can improve the spatial resolution.
III. IMAGING PERFORMANCE
We systematically evaluated the imaging performance of the system at 4 different magnifications, 1.0X, 1.7X, 2.7X, and 6.0X. The lens pairs were an f/1.2 50-mm Nikkor lens with another f/1.2 50-mm Nikkor lens, an f/1.8 85-mm Nikkor lens, an f/2.0 135-mm Nikon lens, or an f/4.0 300-mm Sigma zoom lens, respectively. The 50-mm lens was close to the phosphor, and the other lens was connected to the CCD.
A. Sensitivity and Detectability
1) Experimental Measurements
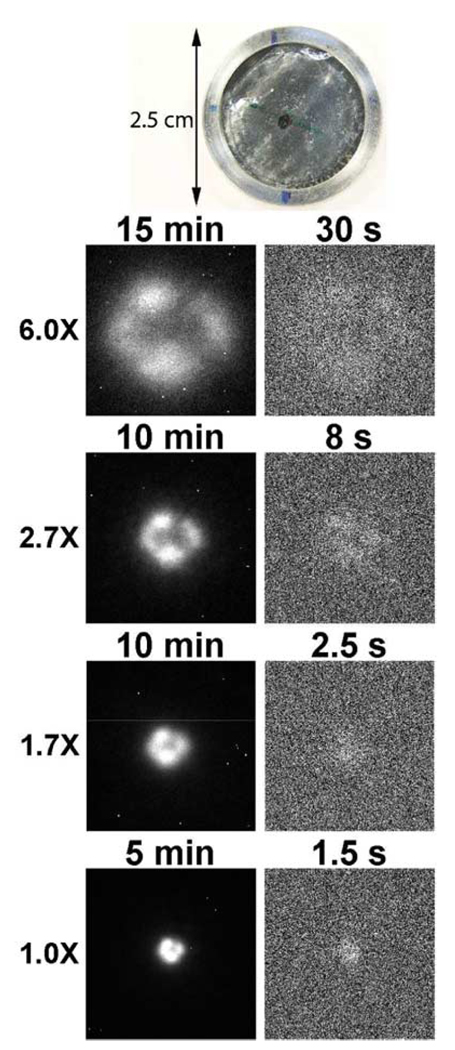
We acquired a new custom-made 90Y/90Sr marker (Isotope Products Laboratory, Valencia, CA, US) for this study, as shown in Fig. 2. The new marker was constructed similarly to the previous one used in Section II but with less total activity of 185 Bq (5 nCi). The manufacturer put much effort to control the radioactivity of the new marker in an area as small as possible (0.86 mm in diameter as measured on the images) so as to distribute the activity more uniformly in the new source than in the previous one.
Fig. 2.
On the top is a photograph of a custom-made 185 Bq (5 nCi) 90Y/90Srβ marker. The black mark on the surface shows the location of the source activity. The remaining are the electron images of the marker produced by an ultra-thin phosphor at 6X, 2.7X, 1.7X, and 1X magnifications from top to bottom. The images on the left column are at long exposure times. The images on the right are at shorter exposure times which reveal the readout and dark-current noise.
We imaged the new marker with the ultra-thin phosphor placed directly on the marker surface at various exposure times in each magnification. At each magnification, a long-exposure image was first taken after the lens assembly was adjusted to focus on the phosphor. Then the exposure time was reduced to the level that the source was barely visible in the image. At short exposure times, and the electronic noise and dark current became visible. A photograph of the new marker and the images at various magnifications are shown in Fig. 2.
2) Simulation Study
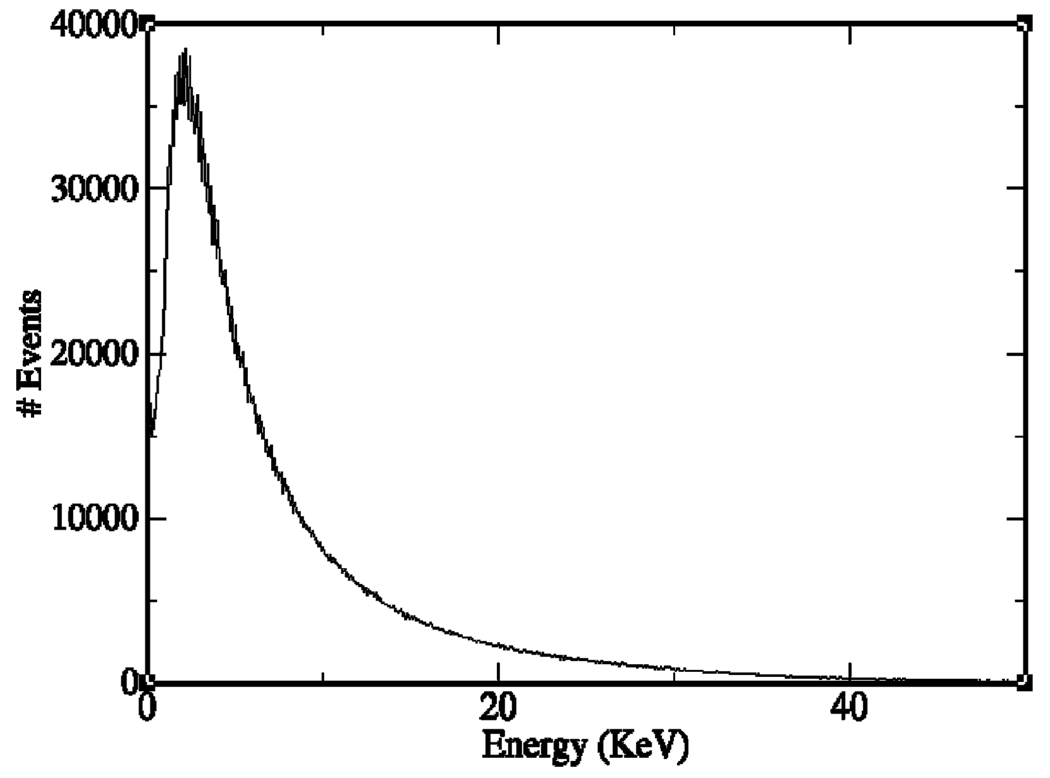
The GEANT4 software package [17] was used to perform simulations for an ideal point source (0 µm in diameter) of a 50%/50% 90Y/90Sr mixture suspended in air very close to our ultra-thin phosphor. GEANT4’s low-energy package was employed. The artificial point source emitted βs isotropically. All of the interactions were tracked until a particle stops inside the phosphor or leaves the phosphor. The source was surrounded by air except for the phosphor above it. A histogram of the energy deposition of the β particles in the phosphor is shown in Fig. 3.
Fig. 3.
The histogram of the detected β particles from a 185 Bq (5 nCi) 90Y/90Sr source. The horizontal axis is the deposited energy of a β particle in the ultra-thin phosphor.
A noteworthy result from this study is that each β particle that interacts in the scintillator deposits an average of about 10 keV of energy there. From commercial literature, we find that 10 keV of energy deposited in a P47 phosphor produces 150–200 optical photons, depending on the manufacturer. Of these, 7.4% are collected by our F/1.2 lens, and the optical quantum efficiency of our CCD camera is about 80% for the P47 emission spectrum. Thus each β produces on average 9–12 photoelectrons in the CCD.
We can use these numbers to define a quantum efficiency (QE) of the scintillator-lens-camera system. If ~ 10 photoelectrons are produced by an energy deposition of 10 keV, we will get about 1 photoelectron when 1 keV is deposited, and this would be the threshold of detection for a single β if there were no readout noise or dark current in the detector. From the GEANT simulations we find that the fraction of 90Y/90Sr βs that deposit at least 1 keV in the scintillator is about 50% for 3 µm of P47, and we can use this number as the QE, to be denoted η. There is some concern that GEANT4 handles the low-energy interactions correctly: so the actual QE could be higher. As we shall see in Section III-A-I, however, the system sensitivity is limited further by dark current and readout noise and by the variations in deposited energy depicted in Fig. 3.
3) Theoretical Calculation
We can use the results of these simulations to compute the sensitivity of our imaging system for detection of a specified electron-emitting object such as the new custom-made marker discussed in this section. We will define the detectability in terms of the ideal linear observer, also known as the Hotelling observer. The Hotelling observer reduces to the overall ideal observer if the image statistics are Gaussian, which might be a reasonable approximation in this problem because the read noise and dark current, at least, should be accurately Gaussian. In any case, the Hotelling observer is widely used to evaluate systems on detection tasks, and it is often an accurate predictor of human-observer performance. For a detailed discussion of ideal, Hotelling and human observers, see [18].
For purposes of this paper, we will confine attention to detection of a known β source without any radioactive background in the object, but the results can be readily generalized to random signals and backgrounds; again, full details can be found in [18].
The major factors limiting the detectability for this task are the dark current and readout noise of the CCD camera, the Poisson statistics of the β emission, and the excess noise arising from the random amount of energy deposited in the scintillator foil by each β particle. The latter variability arises from both the original β spectrum and from the randomness of the interaction of each β with the scintillator; both effects are accounted for in the simulation results shown in Fig. 3.
The Hotelling observer for discriminating between two hypotheses (signal-present and signal-absent in this case) requires knowledge of the mean image and its covariance matrix under the two hypotheses. Under the signal-absent hypothesis (denoted H0), the mean image is zero because we assume no radioactive background. The only noise under this hypothesis arises from the read noise and dark current in the camera, and these effects are statistically independent from pixel to pixel. Thus the covariance matrix when H0 is true is diagonal, and its elements are given by
where indices m and m′ denote detector pixels and and are, respectively, the pixel variances from readout noise and dark current; for simplicity, we have taken these variances to be the same for all pixels. The variance due to the dark current is proportional to the integration time, while the read-noise variance is related in a complicated way to the time required to read out a frame of data.
Under the signal-present hypothesis, H1, the mean signal is the radioactive object blurred by the effects of scattering in the medium, limited resolution of the optical system, and the finite size of the detector pixels. This functional form of this mean image can be obtained simply by imaging the object at a long exposure time so that the noise effects are negligible. The mean image for shorter exposures can then be obtained by scaling for the exposure time.
The covariance matrix under H1 is in general not diagonal because a fluctuation in the energy deposited in the scintillator will affect the output of several pixels. If, however, we assume that the optical resolution of the system is comparable to or better than the pixel size, which is a reasonable approximation for our lens and CCD camera at 1X magnification, then the light flash from one β interaction affects only one pixel, and the covariance matrix remains diagonal even when the signal is present. In that case we have
where Vm is the variance arising from the signal. This variance can be computed by use of the Burgess variance theorem [19], [20], with the result [see [18, Sec. 11.4.1]]
where N̄m is the mean number β of particles that are imaged to pixel m and k is the random number of photoelectrons produced by each β. The second moment of k, 〈k2〉 can be estimated by noting that
which holds when the 〈k〉 ≫ 1 as we showed in Section III-A-II to be the case for our system. Thus
In this expression, 〈k〉 is the mean number of photoelectrons per detected β, which serves to convert the detector outputs into units of photoelectrons. The factor 〈ε2〉/〈ε〉2 is called the Swank factor for the energy deposition. It would be unity if the histogram of Fig. 3 was very narrow, but with the actual histogram it is approximately 2.18. Thus this component of the variance is higher by this factor than it would be for pure particle- counting statistics.
Denoting the Swank factor by F, we can write the overall covariance matrix under H1 as
The Hotelling detectability, denoted dHot, is given by
where g¯1 is the vector of mean signals (in photoelectron units) under H1 and superscript t denotes transpose. The mth element of g¯1, in photoelectron units, is given by 〈k〉 N̄m, so,
where M is the total number of pixels in the CCD detector.
A useful special case of this result is when the object is approximately uniform over an area Aobj, which images to an area on the detector that covers Mobj pixels. Then we have
where N̄is the value of N̄m for all pixels onto which the uniform object is imaged. If the object is planar and in contact with the scintillator, half of the βs impinge on the scintillator, and a fraction η deposit a measurable amount of energy there. Thus, in this case N̄ = 1/2Aτη/Mobj, where A is the total object activity in Becquerels and τ is the exposure time. The detectability of our system for the new 90Y/90Sr marker is then computed as 4.7 at 1X and τ = 1.5s Considering that a human observer’s efficiency is seldom more than 50% relative to the Hotelling observer, this detectability is consistent with the lower right panel in Fig. 2.
B. Spatial Resolution
1) Simulation Study
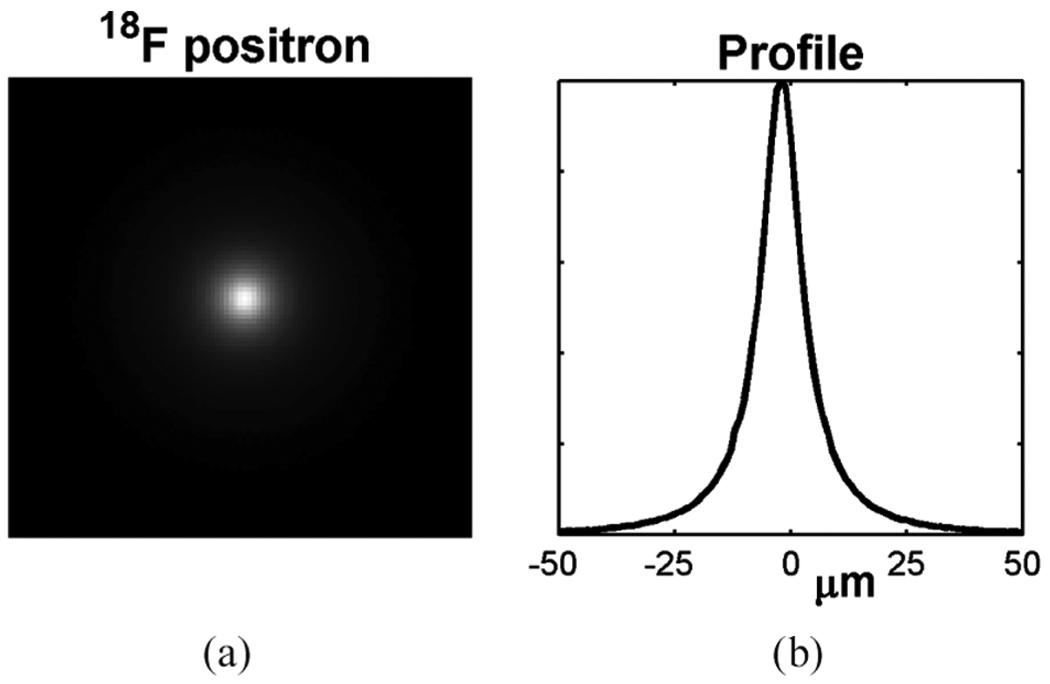
The spatial resolution of charged-particle imaging depends essentially on the distance and material composition between the starting point of a particle emitted inside an object and the end point of the particle in a detector, either the resting point of the particle if it stops inside the detector or the exit surface of the detector if it leaves the detector. We simulated an ideal 18F point source at exactly the same geometry as in Section III-A-II. A simulated image of the source without any electronic noise is shown in Fig. 4.
Fig. 4.
A simulated image of a point 18F source produced by an ultra-thin phosphor (left) and the line profile of the image (right).
According to the Monte Carlo simulation of the 18F source, all the positrons passed through the entire phosphor thickness without stopping. Comparing to an entire path of a charged particle in thick scintillators, such a short path length reduces the particle scattering in the phosphor and improves the spatial resolution. The full width at half maximum (FWHM) of the line profile of the point-source image is 10.5 µm, as shown in Fig. 4.
The effective pixel size of the system is 3.3 µm at 6X, much smaller than the FWHM measured in the simulation above. Such a small pixel size will not cause excessive blur in images. In other words, magnifications larger than 6X will not improve the spatial resolution when the system uses the ultra-thin phosphor.
2) Experimental Measurements
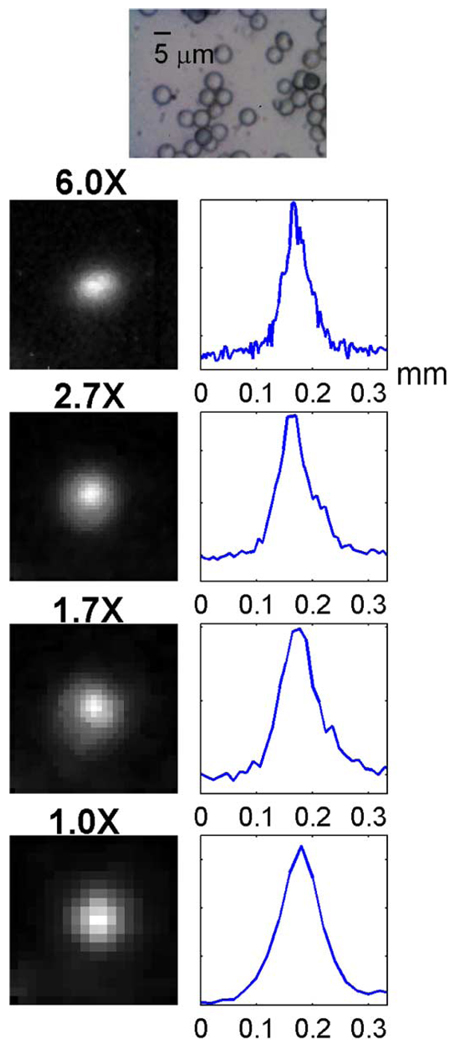
We measured the spatial resolution of the system using a radioactive ion-exchange resin bead at 4 magnifications. The diameter of a bead was 5µm measured in a 100X microscopic image, as shown in Fig. 5. The diameter of a bead is much smaller than the FWHM measured in the simulation above, so the bead can be considered a point source. A few beads were submerged in Na18F solution for 30 minutes and then adhered to a glass slide. The residual activity on the slide was washed off with distilled water. The ultra-thin phosphor was then placed directly on the slide surface, covering the beads.
Fig. 5.
On the top is a 100X micrograph of some 5-µm ion-exchange resin beads. The column on the left shows positron images of a single 18F-labeled bead at 1X, 1.7X, 2.7X, and 6X magnifications, respectively. The bead is at the center of each image. The corresponding line profiles are shown on the right of each image.
Positron images of the beads were taken in the 4 magnifications individually, and the images of a single bead are shown in Fig. 5. The FWHM of the line profile was 69 µm in the 1X positron image, 61 µm in the 1.7X image, 51 µm in the 2.7X image, and 29 µm in the 6X image. The FWHM of the line profile is a measurement of the overall spatial resolution limit of the system when the system is not limited by the object thickness.
When the lenses of different focal lengths were coupled with the 50-mm f/1.2 lens at the 4 different image magnifications in the experiment, none of the 4 lenses used in the measurements cut off any light passing through the 50-mm lens, achieving a large light-collecting cone equal to that of the f/1.2 lens. In practice, a zoom lens can be coupled to a lens of fixed focal length to achieve continuous changes in image magnification.
3) Optics Contribution
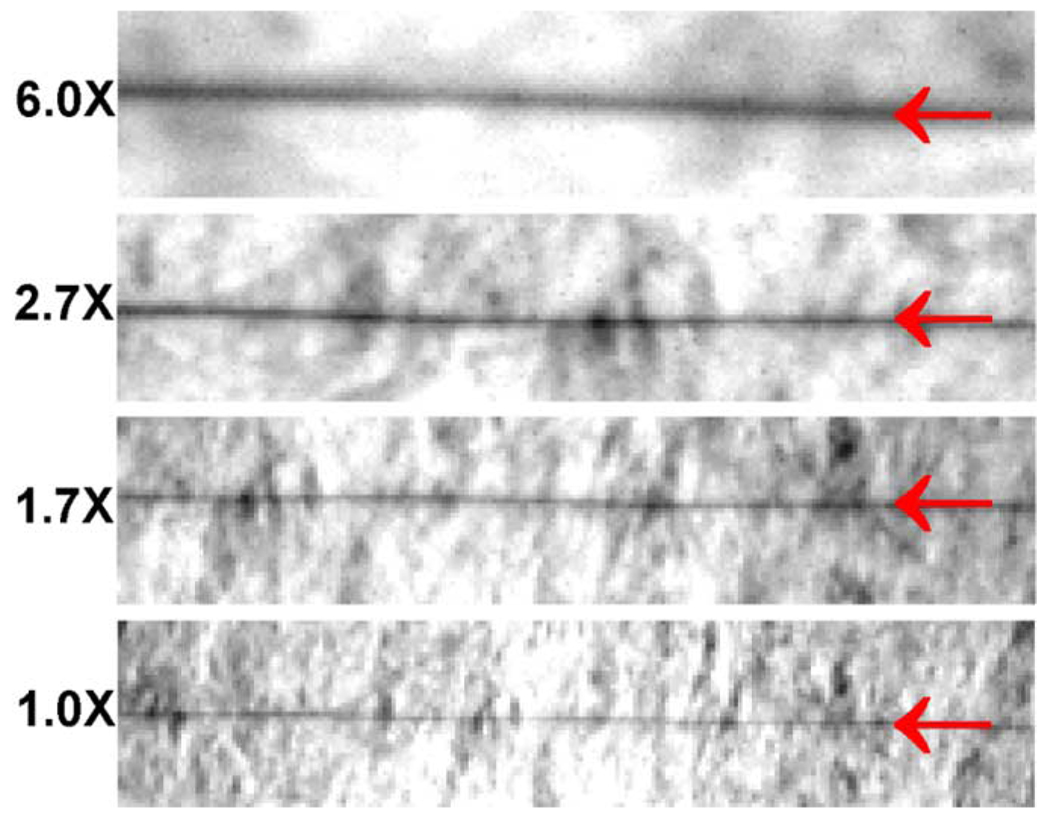
We also measured the blur due to the imaging optics independent of the phosphor using a tungsten wire of 2.5 µm in diameter. We called this blur the optical resolution. The same imaging lens assembly and CCD in our system were used to image the wire on a piece of white paper under external white-light illumination at the 4 magnifications (Fig. 6). The FWHM of the line profile was 20 µm in the 1X image, 17 µm in the 1.7X image, 14 µm in the 2.7X image, and 13 µm in the 6X image.
Fig. 6.
Photographs of a 2.5-µm diameter tungsten wire produced by the same optical imaging unit in the electron imaging system under white-light illumination at 1X, 1.7X, 2.7X, and 6X magnifications, respectively. The red arrows show the locations of the wire in each photograph. The background structure is the texture of the white paper.
At unit magnification, the wire image was hardly broader than 1 pixel. Even if the image blur due to the lenses is narrower than 20 µm, the optical resolution will still be measured as 1 pixel. The CCD pixel size dominated the optical resolution at unit magnification. On the other hand, the overall resolution of 69 µm at 1X is much broader than 1 pixel, which makes the optical resolution unimportant. The width of the wire image started to occupy more pixels at increased magnifications, indicating that the blur due to the lenses becomes significant in the optical resolution. At 6X magnification, the optical resolution is 13 µm, an important contribution to the overall resolution of 29 µm. The spatial resolution of a well-designed f/1.2 camera lens is around 15 µm [21], far from the diffraction limit, to balance the aberrations across a large FOV common in photography. One can improve the overall resolution with a better optical imaging assembly, closer to diffraction-limited, at this magnification.
C. Linear Response Range
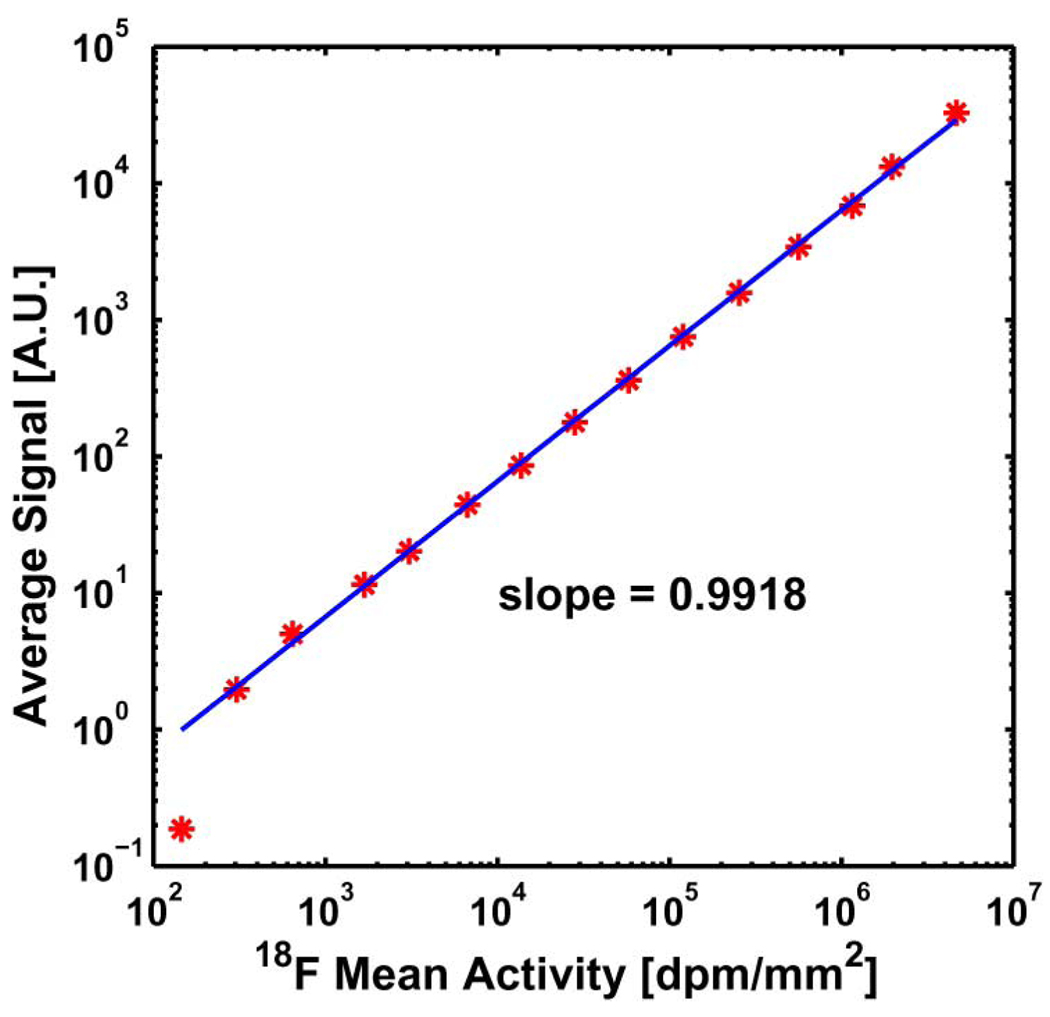
We measured the linear response range of the system using a piece of filter paper initially dipped in Na18F solution. The ultra-thin phosphor was placed directly on the filter paper. Serial images of 18F positrons from the filter paper were taken over several half-lives of 18F at unit magnification. The average signal intensity in a central area of the paper was plotted against the average radioactivity in that area, as shown in Fig. 7. The system response range for 18F positrons was linear over more than 4 orders of magnitude from 102 to 106 dpm/mm2(Fig. 7). The linear range was comparable to that of a modern digital autoradiography system.
Fig. 7.
The system response curve of 18F positrons emitted from the activity in a filter paper.
IV. IMAGING TISSUE AND TUMORS in VIVO AND DYNAMICALLY
The charged-particle imaging system has the advantage of imaging in vivo shallow or exposed areas in animals or humans. In the previous paper, we reported in vivo imaging of the normal, exposed (the overlying skin was removed) mandibular glands in a mouse injected with 99mTc-pertechnetate [1]. Heterogeneous uptake with many details was evident in the images, providing a measurement of the system spatial resolution in in vivo imaging. The glands were visible even in a 30-second image, indicating the high sensitivity of the system. The experiment also demonstrated that the system can detect conversion electrons from γ-emitters such as 99mTc.
Another in vivo application of the system is to image the distribution of a radioactive probe in tumors implanted in dorsal window chambers. Tumor cell lines were grown in a surgically implanted dorsal window chamber on a SCID mouse. The dorsal window chamber sustains a planar tumor supplied by the animal’s blood vessels in a transparent chamber [22], [23]. The chamber was surgically implanted in a fold of skin on the back of a mouse; one layer of skin remains to provide blood vessels, while the other is replaced with a removable glass “window pane”. An ultra-thin phosphor can be placed temporarily on the skin tissue under the pane for imaging charged particles, such as positrons, emitted from the tumor tissue. The mouse is not sacrificed after imaging but allowed to survive for additional in vivo experiments.
Initially, the distribution of 18F-FDG in PC3/GFP, a human prostate cancer transfected with green fluorescent protein (GFP), was imaged. A digital photograph of the 10-mm diameter window chamber and the skin tissue is shown in Fig. 8. The tumor was the pink area in the upper left region within the chamber. At the time of imaging, the tumor measured about 6 mm in greatest diameter. The mouse was injected intravenously with 0.2 ml 20 MBq (0.54 mCi) 18F-FDG 1 hour before imaging commenced. Fig. 8 shows the images of the FDG uptake in the tissue in the chamber with exposure times of 10 seconds, 1, 5, and 10 minutes. The spatial location and shape of the tumor in each positron image were almost identical to those in the fluorescence image shown in Fig. 8 taken one day earlier, and they were all very similar to those of the tumor shown in the digital photograph. Both the fluorescence image and the digital photograph have confirmed that the positron images accurately reflected the FDG distribution in the tumor. The FDG uptake in the tumor was still visible even in an exposure time as short as 10 seconds.
Fig. 8.
On the top left is a photograph of a human prostate tumor implanted in the skin tissue in a dorsal window chamber on an SCID mouse. The tumor cell line was transfected with green fluorescent protein (GFP). On the bottom left is the fluorescence image of the same cancerous tissue produced by a conventional fluorescence microscope. On the right are the positron images of the 18F-FDG uptake distribution in the same tissue produced at 4 different exposure times. The location of the tumor is indicated by a red arrow in each photograph or image.
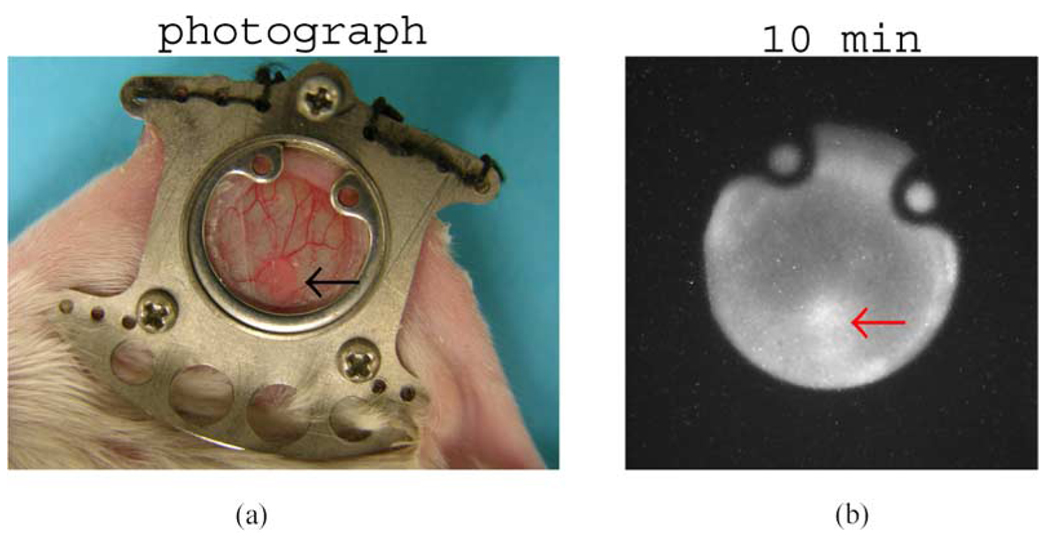
Next, a 3-mm diameter human breast cancer (MDA-MB-231) was imaged. The mouse was injected intravenously with 48 MBq (1.3 mCi) 0.1 ml 18F-FDG 20 minutes before imaging. The tumor profile was again clearly shown in the image of a 10-minute exposure (Fig. 9). Compared with the digital photograph of the tumor in Fig. 9, the image of the FDG uptake faithfully reflects the spatial distribution of the tumor within the chamber. A small tumor at this early stage of growth would be difficult to detect and characterize with other available imaging modalities except microscopy.
Fig. 9.
On the left is the photograph of a human breast tumor implanted in the skin tissue in a dorsal window chamber on an SCID mouse. On the right is the positron image of the 18F-FDG uptake distribution in the same tissue. The location of the tumor is indicated by a black arrow in the photograph and a red arrow in the image.
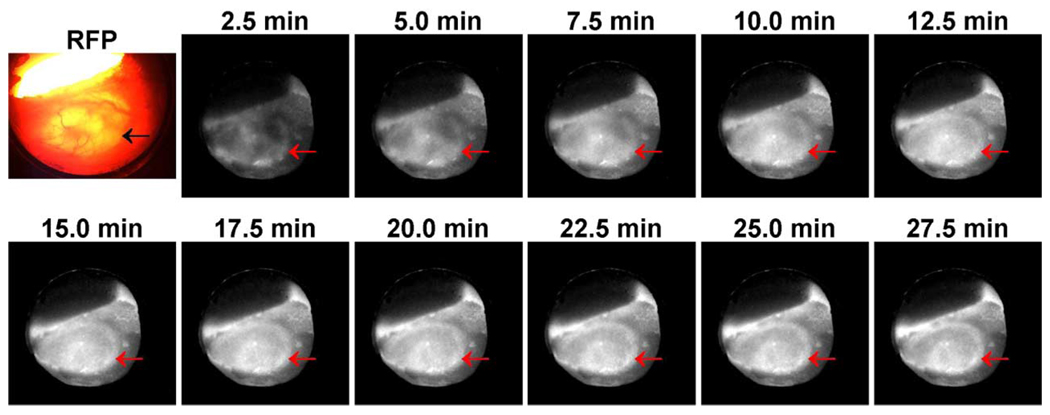
Finally, a dynamic acquisition was performed when imaging a human colon cancer transfected with red fluorescent protein (HCT-116/RFP).We acquired the positron images of 18F-FDG dynamically at 2 minutes per frame for 60 minutes, as shown in Fig. 10. A fluorescence image taken with a regular microscope confirmed the location and profile of the tumor, as shown in Fig. 10. The imaging session started at the time of intravenous FDG injection. Initially, FDG perfusion was seen throughout the tumor. FDG then washed out of some areas but continued to accumulate in the central area and the edge of the tumor. Within the 4 mm × 7 mm tumor, the FDG uptake is obviously heterogeneous. Subsequent pathological analysis not shown here has confirmed that the areas of high FDG uptake correlated to the areas of dense tumor cells and the rapidly growing tumor cells at the tumor margin. Detailed discussion on the entire study will be published later.
Fig. 10.
At the beginning is the fluorescence image of a human colon cancer implanted in the skin tissue in a dorsal window chamber on an SCID mouse produced by a conventional fluorescence microscope. The tumor cell line was transfected with red fluorescent protein (RFP). The remaining are a sequence of positron images of the 18F-FDG uptake distribution in the same cancerous tissue acquired dynamically over a 30-minute time period. The acquisition started at the time of injection, and each image frame was produced at 2-minute exposure and 35-second readout time. The location of the tumor is indicated by arrows in each image.
The high sensitivity of the system has made it feasible to image dynamically the spatiotemporal variations of radiopharmaceutical distributions in tumors in dorsally implanted skin-flap chambers with the animals under gas anesthesia. The experiment has produced usable positron images of the FDG uptake in the tumor every 2.5 minutes over an hour. The dynamic image sequence also suggested different FDG kinetics in different parts of the tumor.
In practical cases, the resolution will decrease when charged particles emit from deep within thick objects because of multiple scattering in the object. The practical overall resolution will therefore depend on the object to be imaged. In the example of tumor imaging in a window chamber, intertumoral variations of FDG distribution provided a measurement of the resolution for tissue several millimeters thick.
V. CONCLUSIONS AND DISCUSSION
We have developed a direct charged-particle imaging system using an ultra-thin phosphor film and a lens-coupled CCD camera. The system has achieved a spatial resolution of 29µm at 6X magnification (about 4.3 mm × 4.3 mm FOV). Unlike positron emission tomography (PET), the system has the potential to achieve a spatial resolution beyond the range of positron annihilation when imaging positron emissions. A positron interacts with the phosphor material many times and forms an ionizing track before annihilation. The system detects the light generated by the interactions along the ionizing track of each positron. On the other hand, PET scanners can only detect annihilation photons that are produced at the end of the ionization track.
The calculated detectability is consistent with the experiments at least for 1X magnification in the current configuration. Improvements in the sensitivity can be made by changes in the configuration. For example, the mean number of photoelectrons per β can be doubled by using a reflector behind the scintillator and approximately doubled again by using a P43 phosphor (350 photons per 10 keV). Should still more light be desired, it could be obtained by using a lens of higher numerical aperture or a thicker scintillator.
The effective pixel size in images is adjustable between hundreds of microns to a few microns, and the size of the FOV between more than a hundred millimeters to a few millimeters on a side. The system can image in vivo dynamically changing spatiotemporal distributions of charged-particle-emitting isotopes in shallow or exposed areas of animals or humans. We have demonstrated a temporal resolution of the system at 10 seconds in imaging 18F-FDG uptake in exposed tumors of a few millimeters in diameter.
In addition to β particles and positrons, we have demonstrated earlier that the system can also detect the conversion electrons from the γ-emitting 99mTc [1]. The ability to image charged particles in vivo could reduce the dependence of the medical and scientific community on γ-emitting isotopes for in vivo applications, broadening the potential radiopharmaceuticals available for molecular imaging. The ability to image positrons directly suggests that our relatively inexpensive imaging system could take the place of more costly animal PET scanners for some tumor biology experiments.
The system will provide researchers with a new method of screening therapeutic and diagnostic radiopharmaceuticals, and it can be a valuable tool for evaluating the biodistribution of radiopharmaceuticals in microdosimetry. One potential application of this system is to study pharmacokinetics by imaging the dynamic uptake of a drug in vivo in a tumor or tissue grown within a dorsal window chamber. Imaging can be accomplished with gas anesthesia of 1–2 hours duration. The ultra-thin phosphor is detached from the remainder of the system and separated from tissue by the Mylar foil. Thus, it does not alter the physiological processes. An animal can survive several weeks after being implanted with a dorsal window chamber. These factors make serial imaging over several weeks quite feasible.
ACKNOWLEDGMENT
The authors would like to thank Dr. G. Stevenson and C. Barber for animal preparation. They would also like to thank Ms. C. Thies for her help in proofreading this manuscript.
This work was supported by the National Institutes of Health under Grant P41 EB002035 and by the Department of Radiology under a Departmental Internal Grant.
Footnotes
Color versions of one or more of the figures in this paper are available online at http://ieeexplore.ieee.org.
Contributor Information
Liying Chen, Department of Radiology, University of Arizona, Tucson, AZ 85724 USA..
Lisa S. Gobar, Department of Radiology, University of Arizona, Tucson, AZ 85724 USA.
Negar G. Knowles, Department of Radiology, University of Michigan, Ann Arbor, MI 48109 USA.
Donald W. Wilson, Department of Radiology, University of Arizona, Tucson, AZ 85724 USA.
Harrison H. Barrett, Department of Radiology, the College of Optical Sciences, and the Program of Applied Mathematics, University of Arizona, Tucson, AZ 85721 USA..
REFERENCES
- 1.Chen L, Gobar LS, Knowles NG, Liu Z, Gmitro AF, Barrett HH. Direct imaging of radionuclide-produced electrons and positrons with an ultra-thin phosphor. J. Nucl. Med. 2008 Jul;vol. 49(no 7):1141–1145. doi: 10.2967/jnumed.107.040568. [DOI] [PMC free article] [PubMed] [Google Scholar]
- 2.Zanevsky YV, Chemenko SP, Ivanov AB, Kaminir LB, Peshekhonov VD, Senchenkov EP, Tyapkin IA, Kalinin VN. Use of a proportional chamber for quantitative and qualitative analysis of thin-layer radio-chromatograms. Nucl. Instrum. Methods Phys. Res. 1978;vol. 153:445–445. [Google Scholar]
- 3.Van Eijk CWE, Hollander RW, Van der Sluis SM. An MWPC for beta radiography. Nucl. Instrum. Methods Phys. Res. A. 1988;vol. 273(no 2–3):764–766. [Google Scholar]
- 4.Charpak G, Derré J, Giomataris Y, Rebourgeard P. Micromegas, a multipurpose gaseous detector. Nucl. Instrum. Methods Phys. Res. A. 2002 Feb.vol. 478(no 1–2 pt 1):26–36. [Google Scholar]
- 5.Nagayoshi T, Kuboa H, Miuchia K, Oritoa R, Takadaa A, Takedaa A, Tanimoria T, Uenoa M, Bouianovb O, Bouianovc M. Development of μ-pic and its imaging properties. Nucl. Instrum. Methods Phys. Res. A. 2004 Jun.vol. 525(no 1–2 pt 1):20–27. [Google Scholar]
- 6.Sanghera B, Ott RJ. Preliminary studies using silicon strip detectors in digital autoradiography. IEEE Trans. Nucl. Sci. 1993 Aug.vol. 40(no 8):992–995. [Google Scholar]
- 7.Ott RJ, MacDonald J, Wells K. The performance of a CCD digital autoradiography imaging system. Phys. Med. Biol. 2000;vol. 45:2011–2027. doi: 10.1088/0031-9155/45/7/322. [DOI] [PubMed] [Google Scholar]
- 8.Prydderch ML, Waltham NJ, Turchetta R, French MJ, Holt R, Marshall A, Burt D, Bell R, Pool P, Eyles C, Mapson-Menard H. A 512 × 512 CMOS monolithic active pixel sensor with integrated ADCs for space science. Nucl. Instrum. Methods Phys. Res. A. 2003;vol. 512:358–367. [Google Scholar]
- 9.Mettivier G, Montesi MC, Russo P. Tritium digital autoradiography with a medipix2 hybrid silicon pixel detector. Nucl. Instrum. Methods Phys. Res. A. 2004;vol. 516:554–563. [Google Scholar]
- 10.Laniece P, Charon Y, Dumas S, Mastrippolito R, Pinot L, Tricoire H, Valentin L. HRRI: A high resolution radioimager for fast, direct quantification in in situ hybridization experiments. BioTechniques. 1994;vol. 17(no 2):338–345. [PubMed] [Google Scholar]
- 11.Ljunggren K, Strand S-E. Reduction of noise in the beta-camera for low activity applications. IEEE Trans. Nucl. Sci. 1994;vol. 41(no 4):1666–1669. [Google Scholar]
- 12.Shestakova I, Nagarkar VV, Gaysinskiy V, Entine G, Stack BC, Miller B. Feasibility studies of an emccd-based beta imaging probe for radioguided thyroid surgery. Proc. Hard X-Ray and Gamma-Ray Detector Physics and Penetrating Radiation Systems VIII; Aug. 2006; San Diego, California. pp. 63191E-1–63191E-9. [Google Scholar]
- 13.Kanno S, Rai1 H, Ohya T, Hayashi Y, Tanoi K, Nakanishi TM. Real-time imaging of radioisotope labeled compounds in a living plant. J. Radioanal. Nucl. Chem. 2007 Jun.vol. 272(no 3):565–570. [Google Scholar]
- 14.Karellas A, Liu H, Reinhardt C, Harris LJ, Brill AB. Imaging of radionuclide emissions with a low-noise charge-coupled-device. IEEE Trans. Nucl. Sci. 1993 Aug.vol. 40(no 8):979–982. [Google Scholar]
- 15.Puertolas D, Piedigrossi D, Leutz H, Gys T, D’Ambrosio C. An ISPA camera for beta radiography. IEEE Trans. Nucl. Sci. 1996 Oct.vol. 43:2477–2487. [Google Scholar]
- 16.Cho JS, Vu NT, Chung YH, Yu ZT, Silverman RW, Taschereau R, Tseng HR, Chatziioannou AF. Detection of beta particles in a microfluidic chip using a scintillator and CCD. Proc. IEEE Nuclear Science Symposium Conference Record; Oct. 2006; Honolulu, HI. pp. 1977–1981. [Google Scholar]
- 17.Agostinelli S, et al. Geant4—A simulation toolkit. Nucl. Instrum. Methods Phys. Res. A. 2003 Jul.vol. 506(no 3):250–303. [Google Scholar]
- 18.Barrett HH, Myers KJ. Foundations of Image Science. Hoboken, NJ: Wiley-Interscience; 2004. [Google Scholar]
- 19.Burgess RE. Homophase and heterophase fluctuations in semiconducting crystals. Discuss. Faraday Soc. 1959;vol. 21(no 1):51–158. [Google Scholar]
- 20.Swank RK. Absorption and noise in x-ray phosphors. J. Appl. Phys. 1973;vol. 44:4199–4203. [Google Scholar]
- 21.Laikin M. Lens Design. New York: Marcel Dekker; 1995. New York. [Google Scholar]
- 22.Papenfuss HD, Gross JF, Intaglietta M, Treese FA. A transparent access chamber for the rat dorsal skin fold. Microvascular Res. 1979;vol. 18(no 3):311–318. doi: 10.1016/0026-2862(79)90039-6. [DOI] [PubMed] [Google Scholar]
- 23.Huang Q, Shan S, Braum RD, Lanzen J, Anyrhambatla G, Kong G, Borelli M, Corry P, Dewhirst MW, Li C-Y. Noninvasive visualization of tumors in rodent dorsal skin window chambers. Nature Biotechnol. 1999 Oct.vol. 17(no 10):1033–1035. doi: 10.1038/13736. [DOI] [PubMed] [Google Scholar]


