Abstract
Interlocus gene conversion can homogenize DNA sequences of duplicated regions with high homology. Such nonvertical events sometimes cause a misleading evolutionary interpretation of data when the effect of gene conversion is ignored. To avoid this problem, it is crucial to test the data for the presence of gene conversion. Here, we performed extensive simulations to compare four major methods to detect gene conversion. One might expect that the power increases with increase of the gene conversion rate. However, we found this is true for only two methods. For the other two, limited power is expected when gene conversion is too frequent. We suggest using multiple methods to minimize the chance of missing the footprint of gene conversion.
INTERLOCUS (ectopic or nonallelic) gene conversion occurs between paralogous regions such that their DNA sequences are shuffled and homogenized (Petes and Hill 1988; Harris et al. 1993; Goldman and Lichten 1996). As a consequence, the DNA sequences of paralogous genes become similar (i.e., concerted evolution, Ohta 1980; Dover 1982; Arnheim 1983). This homogenizing effect of gene conversion sometimes causes problems in the inference of the evolutionary history of duplicated genes or multigene family. Common misleading inferences include an underestimation of the age of duplicated genes (Gao and Innan 2004; Teshima and Innan 2004). This is largely because the concept of the molecular clock is automatically incorporated in most software of phylogenetic analyses, and those software are frequently applied to multigene families without careful consideration of the potential effect of gene conversion.
To understand the evolutionary roles of gene duplication, it is crucial to date each duplication event. To do this, we first need to know precisely the action of gene conversion among the gene family of interest. There have been a number of methods for detecting gene conversion, but their power has not been fully explored. Here, we systematically compare their performance by simulations to provide a guideline on which method works best under what condition. Our simulations show that some methods have a serious problem that causes a misleading interpretation: they do not detect any evidence for gene conversion when the gene conversion rate is too high. Thus, as is always true, lack of evidence is no evidence for absence, and we must be very careful about this effect when analyzing data with those tests, as is demonstrated below.
There seem to be four major ideas behind the methods for detecting gene conversion, which are summarized below. A number of methods have been developed to detect interlocus gene conversion, and they belong to one of these four broad categories.
-
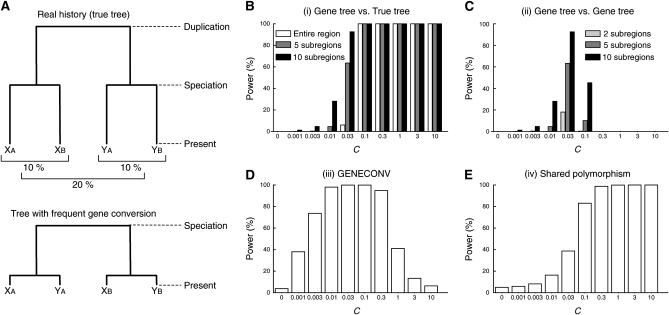
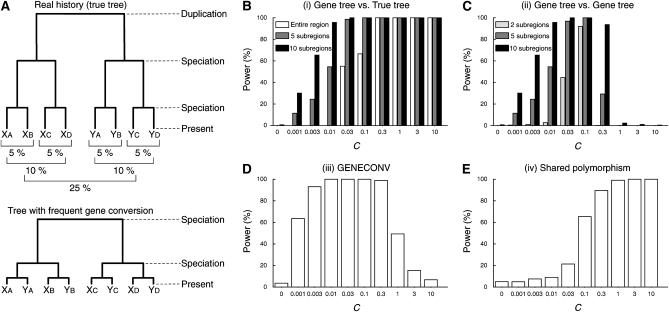
Incompatibility between an estimated gene tree and the true duplication history: Figure 1A illustrates a simple situation of a pair of duplicated genes, X and Y, that arose before the speciation event of species A and B. The upper tree of Figure 1A shows a tree representing the true history. When a gene tree is estimated from their DNA sequences, it should be consistent with the true tree when genes X and Y have accumulated mutations independently. Gene conversion potentially violates this relationship. When genes X and Y are subject to frequent gene conversion, the two paralogous genes in each species should be more closely related, resulting in a gene tree illustrated in the bottom tree in Figure 1A. Thus, incongruence between the real tree and an inferred gene tree can provide strong evidence for gene conversion (unless there is no lineage sorting or misinference of the gene tree).
It should be noted that a single gene conversion event usually transfers a short fragment. Consequently, it occasionally happens that incongruence is detected only in a part of the duplicated region. Thus, searching local regions of incongruence has been a well-recognized method for detecting nonvertical evolutionary events such as recombination, gene conversion, and horizontal gene transfer (Farris 1971; Brown et al. 1972), and some computational methods based on this idea have been developed (Balding et al. 1992).
Incompatibility of gene trees in different subregions: The idea of (i) can work even without knowing the real history. As mentioned above, incompatibility in the tree shape between different subregions can be evidence for local gene conversion because those subregions should have different histories of gene conversion (Sneath et al. 1975; Stephens 1985). A number of statistical algorithms incorporate this idea (e.g., Jakobsen et al. 1997; McGuire et al. 1997; Weiller 1998).
GENECONV: A local gene conversion also leaves its trace in the alignment of sequences. GENECONV is a software developed by Sawyer (1989) to detect such signatures (http://www.math.wustl.edu/∼sawyer/geneconv/). GENECONV looks at an alignment of multiple sequences in a pairwise manner and searches unusually long regions of high identity between the focal pair conditional on the pattern of variable sites in the other sequences, which are candidates of recent gene conversion (a similar idea is also seen in Sneath et al. 1975). The statistical significance is determined by random shuffling of variable sites in the alignment.
Shared polymorphism: Suppose polymorphism data are available in both of the duplicated genes. Then, with gene conversion, there could be polymorphisms shared by the two genes, which can be evidence for gene conversion (Innan 2003a). It should be noted that parallel mutations can create shared polymorphism even without gene conversion, but the chance should be very low when the point mutation rate is usually very low. Polymorphism data usually have tremendous amounts of information on very recent events and can be a powerful means to detect gene conversion (e.g., Stephens 1985; Betrán et al. 1997; Innan 2002).
Figure 1.—
Summary of the simulations in the two-species two-locus model. (A) Illustration of the model. (B–E) The power of the four approaches. The average gene conversion tract length (1/q) is assumed to be 100 bp. See Figure S1 for the results with 1/q = 1000 bp.
In this study, we investigate and compare the performance of the methods based on these four ideas with simple settings. It should be noted that because our primary focus is on interlocus gene conversion, we ignore methods that can be used for detecting only allelic gene conversion, such as Fearnhead and Donnelly (2001), Hudson (2001), and Gay et al. (2007).
MODELS AND RESULTS
Two-species two-locus model:
To assess the power of these four approaches, we first simulated the evolution of DNA sequence of a pair of duplicated regions (X and Y, each is L = 5000 bp long) along the history illustrated in Figure 1A (two-species two-locus model). This model assumes that the ancestral population consists of random-mating N = 50 diploids. Biallelic states (0 and 1) are allowed at each site, and the point mutation rate per site is assumed to be μ = 5 × 10⁻⁵ per generation; therefore, the population mutation parameter is θ = 4Nμ = 0.01 per site. To investigate the effect of interlocus gene conversion alone, homologous recombination (crossing over) is ignored. The age of the X/Y duplication is set, such that the expected divergence between the duplicates is roughly 20% if there is no gene conversion. The ancestral population splits into two species, A and B, so that the divergence between the orthologous pairs from the two species is expected to be roughly 10%.
Gene conversion is incorporated as a “copy-and-paste” event by following Teshima and Innan (2004). In brief, a copying event at any nucleotide position initiates at rate g per duplicated region, and the elongation of the copied tract can be terminated at rate q and transferred to the corresponding position of the paralog. In this setting, the tract length follows a geometric distribution with mean 1/q, and the gene conversion rate per site (c) corresponds to c = g/(qL) and the population rate is denoted by C = 4Nc. The average tract length is assumed to be 1/q = 100 and 1000 bp. This is consistent with empirical estimates of tract length; the average could range from the order of 10 to 103 (Petes and Hill 1988; Collier et al. 1993; Harris et al. 1993; Chen et al. 2007), but occasionally very large tracts are detected.
The power of each method is measured as the proportion of simulation runs with evidence for gene conversion in 10,000 independent replications. In the four approaches described above, we simply define that there is evidence for gene conversion with the following conditions. In (i), a gene tree is estimated by the neighbor-joining method (Saitou and Nei 1987) using the distance matrix of the entire simulated region, and we consider that there is evidence for gene conversion when the estimated tree is inconsistent with the true tree. This method can also be applied to local regions of the simulated region. We divided the entire region into j subregions with equal length (L/j bp), and a gene tree is estimated for each region. Then, we consider that there is evidence for gene conversion if at least one of the j local gene trees is inconsistent with the true tree. In (ii), inconsistency in the tree shape is examined for all possible pairs of j subregions (i.e.,  pairs), and we consider that there is evidence for gene conversion if at least one pair exhibits inconsistency. The presence of evidence for gene conversion for (iii) is defined such that at least one significant conversion trace (the global P-value < 5%) is detected by the GENECONV software with the default setting (no gene conversion between different species is assumed to be consistent with our modeling). For (iv), because multiple hits of point mutation create a small number of shared polymorphic sites even without gene conversion, we define the presence of evidence when the proportion of shared polymorphic sites in all variable sites is significantly larger than expected without gene conversion. For this, prior to the power simulation, it is necessary to determine the 95% confidence limit by a simulation without gene conversion. The sample size of 10 is assumed.
The power of detecting interlocus gene conversion is presented against the gene conversion rate (C) in Figure 1, in which the results for the mean tract length of 100 bp are shown. One should desire that the power increases as the gene conversion rate increases. We found that this holds for the two approaches, (i) the gene tree vs. true tree comparison and (iv) shared polymorphism, but not for the other two, (ii) the gene tree vs. gene tree comparison, and (iii) GENECONV, where the power decreases when C becomes too large. In other words, there is an optimum gene conversion rate to detect evidence for gene conversion. Thus, there seem to be two major patterns in the relationship between C and the power.
For (i) the gene tree vs. true tree comparison (Figure 1B), the power simply increases with increasing C. With the parameter set used, the power is almost 100% for C ≥ 0.1. As is statistically obvious, more power is expected when we look for local violation of the real history (j = 5, 10) than when using the tree based on the entire region (j = 1), but we need to be careful about false positives for a very large j because of a lack of information (see below).
For (ii) the gene tree vs. gene tree comparison (Figure 1C), the power is maximized around C = 0.03, and almost no power is expected when C ≥ 0.3. This lack of power for a large C may be easily understood. Figure 1A illustrates a typical gene tree of the four sequences when the gene conversion rate is very high (bottom tree), which supports the relationship ((XA, YA),(XB, YB)) because the two paralogs in the same species are more closely related. If gene conversion is very frequent over the entire duplicated region, all local gene trees would support this relationship. In this situation, all local trees are inconsistent with the real tree, but consistent with one another.
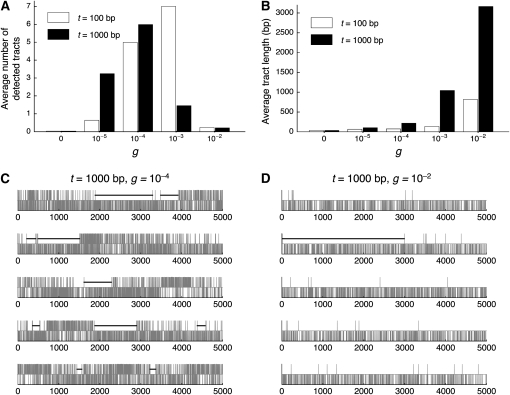
Likewise, a lack of power is observed for (iii) GENECONV (Figure 1D) when C is large. To explore the reason for this, additional simulations were performed. As GENECONV identifies candidate local regions that underwent recent gene conversion events, we designed the simulations to investigate how well GENECONV infers converted regions. In practice, the gene conversion tract length was fixed to a particular length rather than using random variables from a geometric distribution. We here considered two fixed tract lengths, t = 100 or 1000 bp. Figure 2A shows the average number of detected gene conversion tracts per replication as a function of the initiation rate of gene conversion event, g, which is directly related the number of gene conversion events occurred in the past. The relationship between g and C is given by c = 100 × g when t = 100 bp and by c = 1000 × g when t = 1000 bp. In agreement with Figure 1, there is an optimum g to maximize the power. This observation is related to the average tract length of detected gene conversion, which is shown in Figure 2B. One might predict that the tract length of detected gene conversion should somehow reflect the real length, but this is not the case here. The average tract length is in a strong positive correlation with g. This is because the statistical process incorporated; GENECONV detects long stretches of identical sequences in the alignment. Figure 2, C and D, illustrates the outputs of GENECONV for 10 independent replications of the simulations when t = 1000: five replications for g = 10−4 (Figure 2C) and five replications for g = 10−2 (Figure 2D). In each, we focus on two sequences XA and XB; vertical lines in the top part represent the positions of the differences between XA and XB and those in the bottom part are other variable sites in the alignment of the four sequences. Regions with significant signatures of gene conversion (P < 0.05) are presented by thick horizontal lines. Given g = 10−4 where GENECONV has the highest power in Figure 2A, there are a number of relatively long identical regions (Figure 2C), which are clear evidence for recent gene conversion. In contrast, when g = 10−2, there are very few nucleotide differences between XA and XB due to the homogenizing effect of gene conversion, and they distribute almost randomly. Therefore, only extremely long regions (e.g., the ∼3 kb region in the second part) can be significant by a randomization test. This is why GENECONV detects a small number of very long tracts when the gene conversion is high, as is shown in Figures 2, A and B. Thus, the length of detected tracts reflects the gene conversion initiation rate rather than the real tract length, and GENECONV has very limited power when gene conversion is very frequent.
Figure 2.—
Performance of GENECONV. Simulation was performed by following the history illustrated in Figure 1A. The simulation is different from the others in that the gene conversion tract length is fixed to either t = 100 or 1000 bp. (A) The effect of gene conversion initiation rate (g) on the number of detected tracts. (B) The effect of g on the lengths of detected tracts. (C–D) Illustrations of the outputs of GENECONV in five representative replications when g = 10−4 (C) and when g = 10−2 (D). For each replication of the simulations, the locations of the nucleotide differences between XA and XB are shown by vertical lines in the top part. Vertical lines in the bottom part are other variable sites in the alignment of the four sequences. Regions with significant signatures of gene conversion (P < 0.05) are presented by thick horizontal lines.
It should be noted that the observed lack of power for a large C is not due to our arbitrary choice of the setting of GENECONV. We used the default setting of the “gscale” option (gscale = 0). With this most strict setting, GENECONV identifies only monomorphic regions, within which no variable sites are allowed, and this condition can be relaxed by changing the gscale option so that some minor variable sites are allowed. To investigate the effect of the gscale option on the power, additional simulations were performed and the results are shown in Figure 3A. The power was evaluated with the parameter sets that are identical to those used in the simulations for Figure 1, except for the gscale setting. In comparison with the results with the “strict” default setting (gscale = 0, open bars), we found no significant changes in the power with two levels of gscale settings “relaxed” (gscale = 1) and “intermediate” (gscale = 2) in Figure 3A. In contrast, the setting directly affects the length of the identified regions (Figure 3B), which is easily predicted from the role of the gscale option in the algorithm.
Figure 3.—
Power of GENECONV under different settings. (A) The effect of the “gscale” setting on the number of detected tracts. (B) The effect on the length of detected tracts.
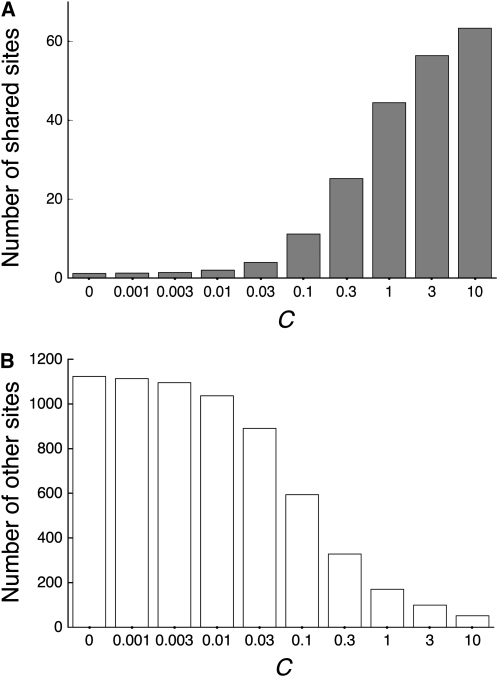
The power of (iv) shared polymorphism is in a clear positive correlation with the gene conversion rate (Figure 1E). This is because the proportion of shared polymorphic sites simply increases with increasing C (Figure 4). However, the total number of variable sites decreases as C increases; therefore, it is expected that the statistical power might decrease with an extremely (and unrealistically) high gene conversion rate although we do not observe such a reduction in the simulated range of C. Note that our simulated range is up to C = 10 (C/θ = 1000), which should cover a reasonable range of the gene conversion rate according to the estimates for Drosophila, humans, and yeast (C/θ might be up to several hundreds; Innan 2003a,b; Gao and Innan 2004; Thornton and Long 2005).
Figure 4.—
The numbers of shared (A) and other variable sites (B) in polymorphism data from a pair of duplicated genes in a single species. The sample size is assumed to be n = 10. The average numbers per replication in the simulation under the two-species and two-locus model are shown.
One-species four-locus model:
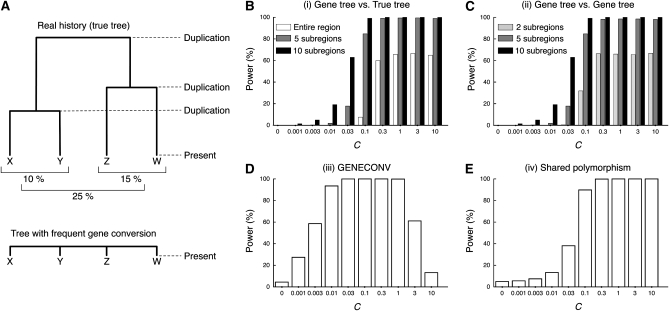
Next, we consider a case with four duplicated genes in a single species (one-species four-locus model, Figure 5A). We simulated the evolution of DNA sequences of four genes, X, Y, Z, and W, along the duplication history illustrated in Figure 5A. The procedure of the simulation basically follows that for the two-species two-locus model (Figure 1). The times of the three duplication events were set such that the expected divergences between X and Y, between Z and W, and between X/Y and Z/W are 10, 15, and 25%, respectively, if there is no gene conversion. There seem to be two major differences in comparison with Figure 1. First, as C increases, the power of (i) increases, but it does not necessarily increase to 100% (Figure 1B). This is because the expected tree shape of the four genes is almost identical to the complete star shape when gene conversion is very frequent so that the three possible patterns of unrooted trees, ((X,Y),(Z,W)), ((X,Z),(Y,W)), and ((X,W),(Y,Z)), appear almost randomly with equal probabilities (i.e., ⅓). Therefore, the probability that a gene tree is inconsistent with the real tree ((X,Y),(Z,W)) is ⅔, and the upper limit of the power is given by 1 − ⅓j. In other words, we can consider that there is strong evidence of gene conversion when the proportion of inconsistent trees is close to the upper limit. The upper limits for j = 1, 5, and 10 are given by 66.7, 99.6, and 99.998%, respectively.
Figure 5.—
Summary of the simulations in the one-species four-locus model. (A) Illustration of the model. (B–E) The power of the four approaches. The average gene conversion tract length (1/q) is assumed to be 100 bp. See Figure S2 for the results with 1/q = 1000 bp.
This logic also works to explain the second major difference: the power of (ii) has a similar pattern to that of (i) and the power simply increases with increasing C and saturates for a large C (Figure 5C). The saturation of the power of (ii) is because the tree shape is almost random for a large C as mentioned above. The upper limit of the power of (ii) is given by 1 − ⅓ (j−1), which is 66.7, 98.8, and 99.995% for j = 2, 5, and 10, respectively (Figure 5C). Thus, the patterns of tree-based methods are quite different depending on whether multiple species are included or not, in agreement with Drouin et al. (1999).
It should be noted that (i) requires the assumption that the shape of the real tree is known. In practice, this assumption may not be very reasonable in this evolutionary model, because it is usually difficult to resolve the historical relationship among multiple paralogs from a single genome without any genomic information of close relatives. Nevertheless, we used this assumption to be consistent with other models. This setting provides the optimum situation to evaluate the power, and the power and accuracy would be decreased if the tree is misinferred by gene conversion.
Four-species two-locus model:
We further extended our simulation to a four-species two-locus model as illustrated in Figure 6A. The overall patterns (Figure 6) are similar to those of the two-species two-locus model (Figure 1), because the model includes multiple species.
Figure 6.—
Summary of the simulations in the four-species two-locus model. (A) Illustration of the model. (B–E) The power of the four approaches. The average gene conversion tract length (1/q) is assumed to be 100 bp. See Figure S3 for the results with 1/q = 1000 bp.
DISCUSSION
Power comparison of the four methods:
We investigated the power of the four major approaches to detect interlocus gene conversion under various conditions. One might expect that the power would increase with increasing the gene conversion rate, but this generally holds for only two approaches, (i) and (iv). The power and C are in a simple positive correlation for (ii) only when the data are from a single species. For (iii) GENECONV, there seems to be an optimum gene conversion rate to maximize the power. In other words, GENECONV has very limited power when C is large.
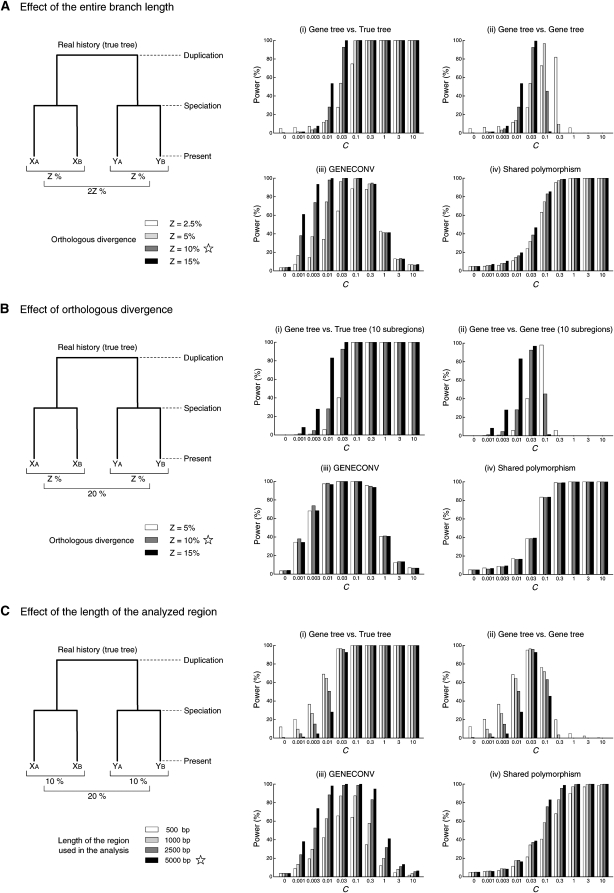
Note that these general trends should hold for wide ranges of parameters, although the results of simulations under limited conditions have been thus far shown. We here provide additional simulation results to confirm our observed patterns. First, the effect of the average length of gene conversion tract (1/q) was considered. In Figures 1, 5, and 6, 1/q = 100 bp was assumed, but essentially the same results were obtained with 1/q = 1000 bp (see supporting information, Figure S1, Figure S2, and Figure S3). Second, we confirmed that recombination between the two copies has very little effect on the results, by additional simulations with recombination (data not shown). Third, different histories of speciation and duplication were assumed by changing the branch lengths in the two-species two-locus model, and we found only quantitative changes in the power. In Figure 7A, the ratio of the time to speciation and that to duplication is fixed and the entire branch length is changed. All other settings are identical to those of Figure 1 except for branch lengths. Overall, it seems that the power is high when the branch length is long for (i), (iii), and (iv), but the relationship may be complicated for (ii). In Figure 7B, the paralogous divergence is fixed to be 20%, and the orthologous divergence is changed. The patterns for (i) and (ii) are similar to those in Figure 7A. Relatively small effects of the orthologous divergence are observed for (iii) and (iv), because these two methods are based on intraspecific comparison of sequences alone. In Figure 7C, the length of analyzed regions is changed. One would expect more power with more information (longer region), and this holds for (iii) and (iv). For (i) and (ii), the power is higher when the length is shorter, but the inflation of the power should be considered due merely to a high rate of false positives, which is obvious from the results of C = 0.
Figure 7.—
The effects of entire branch length, orthologous divergence, and the length of the analyzed region on the power of the four approaches. Simulations were performed under the two-species two-locus model. The star represents the parameter used in Figure 1.
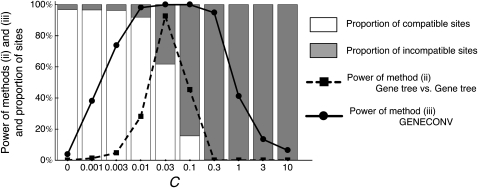
Thus, it can be summarized that while there are a number of factors to determine the power to detect interlocus gene conversion, it is clear that there are two major patterns in the relationship between the gene conversion rate and power. The pattern observed in (i) and (iv) is simple and intuitive; the power has a simple positive correlation with the gene conversion rate. The pattern is more complicated in (iii) and in (ii) when data from a single species are used; the power is low when the gene conversion rate is too high. This loss of power is caused by the fact that these two methods depend on heterogeneity of tree shapes among the duplicated region. Figure 8 shows the proportion of sites that are compatible (open) and incompatible (solid) with the real history in the two-species two-locus model; the proportion of compatible sites increases with increasing C. It is clearly demonstrated that the range of C where methods (ii) and (iii) have the highest power overlaps the range where compatible and incompatibles sites are present in intermediate frequencies.
Figure 8.—
Relationship between the power of methods (ii) and (iii) and the heterogeneity in the proportions of compatible and incompatible sites.
It is difficult to quantitatively compare the power of the four methods because of two major reasons. First, the amounts of data used in the four methods are different. For (i), (ii), and (iii), we used one individual from each species, while polymorphism data (multiple individuals from a single species) were used for (iv). Furthermore, there is a difference in the amount of information that is required prior to the analysis. In (i), we assumed that we know the real phylogenetic relationship of the duplicated copies, but not in the others. Thus, it is difficult to compare the power of the four methods with equivalent amounts of data and information.
Second, the four methods have different levels of false positive rates. We set methods (iii) and (iv) such that the false positive rates are 5%; therefore, the power of the two methods can be fairly compared with the same rate of false positives. However, the false positive rates for (i) and (ii) largely depend on the real history of duplication and speciation. With sufficient amounts of paralogous and orthologous divergence, these methods are very powerful and reliable, as is shown in Figures 1, 5, and 6, where the false positive rates are very low. However, these two tree-based methods have quite high false positive rates when sufficient information is not available (e.g., Figure 7C).
The false positive rate provides crucial information when these methods are applied to genomic data, which usually have a number of paralogous regions. In such a case, it is necessary to take into account the effect of multiple testing. If a number of independent statistical tests are performed with a P-value cutoff (or the false positive rate) of 5%, we expect 5% of the tests to exhibit significant results under the null model. This problem of multiple testing is usually corrected by the false positive rate (e.g., Bonferroni correction), and it is an advantage for (iii) and (iv) that we can set any arbitrary value to the false positive rate. In contrast, the false positive rates for the tree-based methods, (i) and (ii), depend on the species divergence time and the age of duplication. Therefore, it is necessary to determine their false positive rates perhaps by simulations assuming a realistic history of speciation and duplication. The application of these two tests to genomic data may not be powerful when the false positive rates are high.
Interpretation of the results of GENECONV:
Because GENECONV is very frequently used for detecting interlocus gene conversion between paralogous regions, we summarize some caveats in interpreting the output of GENECONV. The major problem seems to be the lack of power when the gene conversion rate is very high. This is because the frequent homogenization by gene conversion causes a serious reduction in (1) the number of variable sites and (2) heterogeneity of the configurations at variable sites across the region (Figure 8). Another interesting behavior of GENECONV is that the length of gene conversion tracts detected by GENECONV is strongly correlated with g, the gene conversion initiation rate, rather than the true tract length.
On the basis of these observations, we have to be careful about at least two things when we interpret the output of GENECONV. First, when GENECONV detects few regions, it could mean either that gene conversion is not very active or that gene conversion is very frequent. The possibility of the latter might be large if the length of detected tracts are large (Figure 2). This is because repeated gene conversion can create a long stretch of region with very few mismatches. When GENECONV detects a number of converted regions, the rate of gene conversion should be intermediate. In such a case, it is likely that the old gene conversion tract should be further broken down by subsequent gene conversion so that the detected tracts can be a part of the initially converted tract. In other words, the true converted tract should be longer than the detected tracts. Thus, with any rate of the gene conversion rate, the lengths of converted regions detected by GENECONV may not directly reflect the real length of gene conversion events. Therefore, for estimating gene conversion tract length, direct methods to measure spontaneous mutations (e.g., pedigree-based methods and sperm typing; Collier et al. 1993; Harris et al. 1993; Jeffreys and May 2004) should be more informative than reliance on GENECONV (e.g., Drouin 2002; Mondragon-Palomino and Gaut 2005; Benovoy and Drouin 2009; Mcgrath et al. 2009).
It should be pointed out that this article focuses on the performance of GENECONV for inerlocus (nonallelic) gene conversion between paralogous regions, and our results cannot be applied to allelic gene conversion. GENECONV was originally developed for detecting recombination or allelic gene conversion in polymorphism data, by extending the theory of clustering of polymorphic sites with the same configuration (Stephens 1985). Recombination and allelic gene conversion do not decrease the level of polymorphism; they only change allelic combinations. Therefore, GENECONV should not suffer from a lack of polymorphic sites caused by high rates of recombination or allelic gene conversion. However, the caveat on the tract length might apply to the case of recombination and allelic gene conversion; the candidate regions of allelic gene conversion identified by GENECONV does not reflect the real converted region when the rate is so high that the region has been repeatedly experienced gene conversion. See Posada and Crandall (2001) and Posada (2002) for power comparisons of various methods for detecting recombination.
Conclusions and implications:
Our systematic evaluation of the four major approaches to detecting interlocus gene conversion revealed that there are two major patterns in the relationship between the gene conversion rate and the power. The power increases with increase of the gene conversion rate for (i) and (iv), but the other two methods, (ii) and (iii), have little power when the gene conversion rate is very high. This can cause disagreement between the results of different methods. In other words, occasionally one method can detect gene conversion while others do not, especially when the gene conversion rate is very high. One example is the Han and B llchen genes in Drosophila simulans (Arguello et al. 2006); GENECONV did not find any evidence for gene conversion, but a number of shared polymorphic sites were detected.
It is suggested that the most problematic case may be when the gene conversion rate is so large that the sequences of paralogs are very similar. This is a typical situation for young duplicates, although evidence for long-term frequent gene conversion is available for ancient duplicates (>100 million years; Gao and Innan 2004; Sugino and Innan 2005). Interlocus gene conversion requires some level of paralogous homology at the DNA level when it transfers DNA fragments between paralogs. Consequently, the rate should decrease if the paralogous divergence becomes large. Therefore, a typical process of the paralogous divergence between duplicated genes involves a certain length of a phase of concerted evolution in which the divergence is maintained very low by frequent gene conversion, followed by a phase of rapid divergence that is nearly free from gene conversion (Teshima and Innan 2004). The length of the phase of concerted evolution largely depends on the gene conversion rate. The rate may be high for closely located duplicates (e.g., tandem duplicates; Ezawa et al. 2006; Osada and Innan 2008), but in yeast very frequent gene conversion occurs between paralogs on different chromosomes (Gao and Innan 2004). If one uses data of duplicates in the phase of concerted evolution, it is likely that the heterogeneity-based methods (ii) and (iii) miss the footprint of gene conversion because the entire duplicated region is highly homogenized.
To avoid the problem of missing the footprint of interlocus gene conversion, it is desirable to use multiple approaches to test the presence of active gene conversion. It is very important to check if there is gene conversion between paralogs before the basic concept of molecular evolution of orthologs (i.e., molecular clock) is applied to the paralogs. Careful prior analysis to minimize the chance of missing the footprint of gene conversion will improve our understanding of complicated evolution of paralogs.
Acknowledgments
This work was in part supported by grants from the Japan Society for the Promotion of Science, the Japan Science and Technology Agency, the U.S. National Science Foundation, the U.S. National Institutes of Health, and the Graduate University for Advanced Studies to H.I.
Supporting information is available online at http://www.genetics.org/cgi/content/full/genetics.109.111161/DC1.
References
- Arguello, J. R., Y. Chen, S. Yang, W. Wang and M. Long, 2006. Origination of an X-linked testes chimeric gene by illegitimate recombination in Drosophila. PLoS Genet. 2 e77.. [DOI] [PMC free article] [PubMed] [Google Scholar]
- Arnheim, N., 1983. Concerted evolution of multigene families, pp. 38–61 in Evolution of Genes and Proteins, edited by M. Nei and R. K. Koehn. Sinauer, Sunderland, MA.
- Balding, D. J., R. A. Nichols and D. M. Hunt, 1992. Detecting gene conversion: primate visual pigment genes. Proc. R. Soc. Lond. Ser. B Biol. Sci. 249 275–280. [DOI] [PubMed] [Google Scholar]
- Benovoy, D., and G. Drouin, 2009. Ectopic gene conversions in the human genome. Genomics 93 27–32. [DOI] [PubMed] [Google Scholar]
- Betrán, E., J. Rozas, A. Navarro and A. Barbadilla, 1997. The estimation of the number and the length distribution of gene conversion tracts from population DNA sequence data. Genetics 146 89–99. [DOI] [PMC free article] [PubMed] [Google Scholar]
- Brown, D. D., P. C. Wensink and E. Jordan, 1972. A comparison of the ribosomal DNA's of Xenopus laevis and Xenopus mulleri: the evolution of tandem genes. J. Mol. Biol. 63 57–73. [DOI] [PubMed] [Google Scholar]
- Chen, J. M., D. N. Cooper, N. Chuzhanova, C. Férec and G. P. Patrinos, 2007. Gene conversion: mechanisms, evolution and human disease. Nat. Rev. Genet. 8 762–775. [DOI] [PubMed] [Google Scholar]
- Collier, S., M. Tassabehji and T. Strachan, 1993. A de novo pathological point mutation at the 21-hydroxylase locus: implications for gene conversion in the human genome. Nat. Genet. 3 260–265. [DOI] [PubMed] [Google Scholar]
- Dover, G., 1982. Molecular drive: a cohesive mode of species evolution. Nature 299 111–117. [DOI] [PubMed] [Google Scholar]
- Drouin, G., 2002. Characterization of the gene conversions between the multigene family members of the yeast genome. J. Mol. Evol. 55 14–23. [DOI] [PubMed] [Google Scholar]
- Drouin, G., F. Prat, M. Ell and G. D. Paul-Clarke, 1999. Detecting and characterizing gene conversions between multigene family members. Mol. Biol. Evol. 16 1369–1390. [DOI] [PubMed] [Google Scholar]
- Ezawa, K., S. O Ota and N. Saitou, 2006. Genome-wide search of gene conversions in duplicated genes of mouse and rat. Mol. Biol. Evol. 23 927–940. [DOI] [PubMed] [Google Scholar]
- Farris, J. S., 1971. The hypothesis of nonspecificity and taxonomic congruence. Ann. Rev. Ecol. Syst. 2 277–302. [Google Scholar]
- Fearnhead, P., and P. Donnelly, 2001. Estimating recombination rates from population genetic data. Genetics 159 1299–1318. [DOI] [PMC free article] [PubMed] [Google Scholar]
- Gao, L.-z., and H. Innan, 2004. Very low gene duplication rate in the yeast genome. Science 306 1367–1370. [DOI] [PubMed] [Google Scholar]
- Gay, J., S. Myers and G. McVean, 2007. Estimating meiotic gene conversion rates from population genetic data. Genetics 177 881–894. [DOI] [PMC free article] [PubMed] [Google Scholar]
- Goldman, A. S. H., and M. Lichten, 1996. The efficiency of meiotic recombination between dispersed sequences in Saccharomyces cerevisiae depends upon their chromosomal location. Genetics 144 43–55. [DOI] [PMC free article] [PubMed] [Google Scholar]
- Harris, S., K. S. Rudnicki and J. E. Haber, 1993. Gene conversions and crossing over during homologous and homeologous ectopic recombination in Saccharomyces cerevisiae. Genetics 135 5–16. [DOI] [PMC free article] [PubMed] [Google Scholar]
- Hudson, R. R., 2001. Two-locus sample distributions and their application. Genetics 159 1805–1817. [DOI] [PMC free article] [PubMed] [Google Scholar]
- Innan, H., 2002. A method for estimating the mutation, gene conversion and recombination parameters in small multigene families. Genetics 161 865–872. [DOI] [PMC free article] [PubMed] [Google Scholar]
- Innan, H., 2003. a The coalescent and infinite-site model of a small multigene family. Genetics 163 803–810. [DOI] [PMC free article] [PubMed] [Google Scholar]
- Innan, H., 2003. b A two-locus gene conversion model with selection and its application to the human RHCE and RHD genes. Proc. Natl. Acad. Sci. USA 100 8793–8798. [DOI] [PMC free article] [PubMed] [Google Scholar]
- Jakobsen, I. B., S. R. Wilson and S. Easteal, 1997. The partition matrix: exploring variable phylogenetic signals along nucleotide sequence alignments. Mol. Biol. Evol. 14 474–484. [DOI] [PubMed] [Google Scholar]
- Jeffreys, A. J., and C. A. May, 2004. Intense and highly localized gene conversion activity in human meiotic crossover hot spots. Nat. Genet. 36 151–156. [DOI] [PubMed] [Google Scholar]
- McGrath, C. L., C. Casola and M. W. Hahn, 2009. Minimal effect of ectopic gene conversion among recent duplicates in four mammalian genomes. Genetics 182 615–622. [DOI] [PMC free article] [PubMed] [Google Scholar]
- McGuire, G., F. Wright and M. J. Prentice, 1997. A graphical method for detecting recombination in phylogenetic data sets. Mol. Biol. Evol. 14 1125–1131. [DOI] [PubMed] [Google Scholar]
- Mondragon-Palomino, M., and B. S. Gaut, 2005. Gene conversion and the evolution of three leucine-rich repeat gene families in Arabidopsis thaliana. Mol. Biol. Evol. 22 2444–2456. [DOI] [PubMed] [Google Scholar]
- Ohta, T., 1980. Evolution and Variation of Multigene Families. Springer-Verlag, Berlin/New York.
- Osada, N., and H. Innan, 2008. Duplication and gene conversion in the Drosophila melanogaster genome. PLoS Genet. 4 e1000305.. [DOI] [PMC free article] [PubMed] [Google Scholar]
- Petes, T. D., and C. W. Hill, 1988. Recombination between repeated genes in microorganisms. Annu. Rev. Genet. 22 147–168. [DOI] [PubMed] [Google Scholar]
- Posada, D., 2002. Evaluation of methods for detecting recombination from dna sequences: empirical data. Mol. Biol. Evol. 19 708–717. [DOI] [PubMed] [Google Scholar]
- Posada, D., and K. A. Crandall, 2001. Evaluation of methods for detecting recombination from DNA sequences: computer simulations. Proc. Natl. Acad. Sci. USA 98 13757–13762. [DOI] [PMC free article] [PubMed] [Google Scholar]
- Saitou, N., and M. Nei, 1987. The neighbor-joining method: a new method for reconstructing phylogenetic trees. Mol. Biol. Evol. 4 406–425. [DOI] [PubMed] [Google Scholar]
- Sawyer, S., 1989. Statistical tests for gene conversion. Mol. Biol. Evol. 6 526–538. [DOI] [PubMed] [Google Scholar]
- Sneath, P. H. A., M. J. Sackin and R. P. Ambler, 1975. Detecting evolutionary incompatibilities from protein sequences. Syst. Zool. 24 311–332. [Google Scholar]
- Stephens, J. C., 1985. Statistical methods of DNA sequence analysis: detection of intragenic recombination or gene conversion. Mol. Biol. Evol. 2 539–556. [DOI] [PubMed] [Google Scholar]
- Sugino, R. P., and H. Innan, 2005. Estimating the time to the whole-genome duplication and the duration of concerted evolution via gene conversion in yeast. Genetics 171 63–69. [DOI] [PMC free article] [PubMed] [Google Scholar]
- Teshima, K. M., and H. Innan, 2004. The effect of gene conversion on the divergence between duplicated genes. Genetics 166 1553–1560. [DOI] [PMC free article] [PubMed] [Google Scholar]
- Thornton, K., and M. Long, 2005. Excess of amino acid substitutions relative to polymorphism between X-linked duplications in Drosophila melanogaster. Mol. Biol. Evol. 22 273–284. [DOI] [PubMed] [Google Scholar]
- Weiller, G. F., 1998. Phylogenetic profiles: a graphical method for detecting genetic recombinations in homologous sequences. Mol. Biol. Evol. 15 326–335. [DOI] [PubMed] [Google Scholar]


