

Abstract
Brain atrophy and altered CSF levels of amyloid β (Aβ42) and the microtubule-associated protein tau are potent biomarkers of Alzheimer's disease (AD)-related pathology. However, the relationship between CSF biomarkers and brain morphometry is poorly understood. Thus, we addressed the following questions. (1) Can CSF biomarker levels explain the morphometric differences between normal controls (NC) and patients with mild cognitive impairment (MCI) or AD? (2) How are CSF biomarkers related to atrophy across the brain? (3) How closely are CSF biomarkers and morphometry related to clinical change [clinical dementia rating sum of boxes (CDR-sb)]? Three hundred seventy participants (105 NC, 175 MCI, 90 AD) from the Alzheimer's Disease Neuroimaging Initiative were studied, of whom 309 were followed for 1 year and 176 for 2 years. Analyses were performed across the entire cortical surface, as well as for 30 cortical and subcortical regions of interest. Results showed that CSF biomarker levels could not account for group differences in brain morphometry at baseline but that CSF biomarker levels showed moderate relationships to longitudinal atrophy rates in numerous brain areas, not restricted to medial temporal structures. Baseline morphometry was at least as predictive of atrophy as were CSF biomarkers. Even MCI patients with levels of Aβ42 comparable with controls and of p-tau lower than controls showed more atrophy than the controls. Morphometry predicted change in CDR-sb better than did CSF biomarkers. These results indicate that morphometric changes in MCI and AD are not secondary to CSF biomarker changes and that the two types of biomarkers yield complementary information.
Introduction
Brain atrophy (de Leon et al., 2006; Du et al., 2007; Jack et al., 2008; Fennema-Notestine et al., 2009; McEvoy et al., 2009), lowered CSF levels of amyloid β (Aβ42), and heightened levels of the microtubule-associated proteins tau [total tau (t-tau)] and tau hyperphosphorylated at threonine 181 [phosphorylated tau (p-tau)] (Goedert and Spillantini, 2006; Shaw et al., 2007; Hampel et al., 2008) are found in mild cognitive impairment (MCI) and Alzheimer's disease (AD). These are prime candidate biomarkers for diagnosis and monitoring disease progression. In a recent consensus paper, magnetic resonance (MR) morphometry and CSF biomarker pathology were suggested as supportive biomarkers for research diagnostic criteria for AD (Dubois et al., 2007). The aim of the present study was to test whether, and to what degree, morphometric differences in MCI and AD are secondary to differences in CSF biomarker levels and to examine how well brain atrophy and clinical change, indexed by clinical dementia rating sum of boxes (CDR-sb), can be predicted from baseline levels of CSF biomarkers and morphometry.
Depositions of extracellular plaques (Aβ42) and intracellular neurofibrillary tangles (tau) are believed to play causative roles in neurodegeneration in AD (Goedert and Spillantini, 2006; Spires-Jones et al., 2009). It has been suggested that nerve cell degeneration is a downstream event from these processes (Goedert and Spillantini, 2006), leading to the temporal and hippocampal changes measured by magnetic resonance imaging (MRI) (Arriagada et al., 1992; Price and Morris, 1999; Näslund et al., 2000; Thal et al., 2002; de Leon et al., 2006). Still, the chain of causation is essentially unknown. The presence of plaques in healthy persons as well as disappointing results of Aβ-centered therapeutic trials has called into question a causative role of amyloid in AD pathology (Pimplikar, 2009). It is possible that changes in CSF biomarkers are secondary rather than causative to neuronal damage and that increased vulnerability to oxidative and apoptotic insults leads to Aβ42 aggregation (Lee et al., 2006).
A relationship between CSF biomarker levels and hippocampal volume or atrophy has been shown in vivo (Hampel et al., 2005; de Leon et al., 2006; Fjell et al., 2008). One study from the Alzheimer's Disease Neuroimaging Initiative (ADNI) (Schuff et al., 2009) found hippocampal atrophy to be related to Aβ42 but not to tau, whereas another found Aβ42 to be related to ventricular expansion (Chou et al., 2009). Temporal atrophy rates were related to tau and to the tau/Aβ42 ratio in 14 AD patients but not in 26 MCI patients from ADNI (Leow et al., 2009). Still, crucial questions about the relationship between brain atrophy in vivo and CSF biomarkers remain unanswered. (1) Can differences in CSF biomarker levels explain the morphometric differences between normal controls (NC) and patients with MCI or AD? (2) Are baseline brain morphometry and CSF biomarkers related to brain atrophy, in and beyond the hippocampus and ventricular system? (3) Are baseline brain morphometry and CSF biomarkers related to clinical change (CDR-sb)? The present study addressed these questions using 370 participants from ADNI, of whom 309 were followed for 1 and 176 for 2 years.
Materials and Methods
The raw data used in the preparation of this article were obtained from the ADNI database (www.loni.ucla.edu/ADNI). ADNI was launched in 2003 by the National Institute on Aging, the National Institute of Biomedical Imaging and Bioengineering, the Food and Drug Administration, private pharmaceutical companies, and nonprofit organizations. The primary goal of ADNI has been to test whether serial MRI, positron emission tomography, other biological markers, and clinical and neuropsychological assessment can be combined to measure the progression of MCI and early AD. The principal investigator of this initiative is Michael W. Weiner (Veterans Affairs Medical Center and University of California, San Francisco, San Francisco, CA). There are many coinvestigators, and subjects have been recruited from >50 sites across the United States and Canada. The initial goal of ADNI was to recruit 800 adults, including healthy elderly, MCI, and AD patients to participate and be followed for 2–3 years. For more information, see www.adni-info.org.
Sample.
ADNI eligibility criteria are described at http://www.adni-info.org. Briefly, participants are 55–90 years of age, had an informant able to provide an independent evaluation of functioning, and spoke either English or Spanish. All subjects were willing and able to undergo test procedures including neuroimaging and agreed to longitudinal follow up. Specific psychoactive medications are excluded. General inclusion/exclusion criteria are as follows: (1) normal subjects: Mini-Mental State Examination (MMSE) (Folstein et al., 1975) scores between 24 and 30 (inclusive), clinical dementia rating (Morris, 1993) of 0, nondepressed, non-MCI, and nondemented; (2) MCI subjects: MMSE scores between 24 and 30 (inclusive; exceptions made on a case-by-case basis), memory complaint, objective memory loss measured by education adjusted scores on Wechsler Memory Scale Logical Memory II, CDR of 0.5, absence of significant levels of impairment in other cognitive domains, essentially preserved activities of daily living, and an absence of dementia; (3) mild AD: MMSE scores between 20 and 26 (inclusive; exceptions made on a case-by-case basis), CDR of 0.5 or 1.0, and meets National Institute of Neurological and Communicative Disorders and Stroke/Alzheimer's Disease and Related Disorders Association criteria for probable AD. Only ADNI subjects for whom adequate processed and quality checked MR and CSF baseline data were available by February 2009 were included. Of the 105 controls, one converted to MCI after 1 year and an additional three converted to MCI over 2 years. For the MCI group, 33 of 175 converted to AD over 1 year and an additional 19 converted to AD over 2 years. Because prediction of atrophy and CDR-sb change from baseline values of CSF biomarkers and MR morphometry is the theme of the paper, all participants were included in the analyses based on their baseline diagnostic status. Sample characteristics are presented in Table 1.
Table 1.
Sample characteristics
| Baseline |
1 year |
2 years |
|||||||
|---|---|---|---|---|---|---|---|---|---|
| NC | MCI | AD | NC | MCI | AD | NC | MCI | AD | |
| n | 105 | 175 | 90 | 95 | 144 | 70 | 61 | 77 | 38 |
| Sex (f/m) | 50/55 | 61/114 | 38/52 | 42/53 | 53/91 | 31/39 | 28/33 | 22/55 | 19/19 |
| Education (years) | 15.8 ± 2.9 | 15.9 ± 3.0 | 15.2 ± 3.3 | 15.8 ± 2.9 | 16.1 ± 2.8 | 15.3 ± 3.1 | 16.2 ± 2.8 | 16.2 ± 2.6 | 15.8 ± 2.6 |
| CDR | 0.00 | 0.50 | 0.72 ± 0.25 | 0.05 ± 0.15 | 0.53 ± 0.16 | 0.91 ± 0.44 | 0.04 ± 0.14 | 0.56 ± 0.25 | 1.34 ± 0.61 |
| MMSE | 29.1 ± 25–30 | 26.9 ± 23–30 | 23.5 ± 20–27 | 29.0 ± 1.25 | 26.2 ± 2.82 | 21.4 ± 4.65 | 29.1 ± 1.15 | 25.31 ± 3.91 | 18.34 ± 5.48 |
f/m, Female and male, respectively. Education, CDR, and MMSE are shown as mean ± SD.
MR acquisition and analysis.
All scans used for the present paper were from 1.5 T scanners. Data were collected across a variety of scanners with protocols individualized for each scanner, as defined at http://www.loni.ucla.edu/ADNI/Research/Cores/index.shtml. Raw DICOM MRI scans (including two T1-weighted volumes per case) were downloaded from the public ADNI site (http://www.loni.ucla.edu/ADNI/Data/index.shtml) and processed as described previously (Fennema-Notestine et al., 2009). Briefly, these data were reviewed for quality, automatically corrected for spatial distortion attributable to gradient nonlinearity (Jovicich et al., 2006) and B1 field inhomogeneity (Sled et al., 1998), registered, and averaged to improve signal-to-noise. Scans were segmented as described by Fischl et al. (2002), yielding volumetric data for 15 different subcortical structures, including the hippocampal formation [consisting of the dentate gyrus, CA fields, subiculum/parasubiculum and the fimbria (Makris et al., 1999)]. The procedure (Fischl et al., 2002, 2004) uses a probabilistic atlas and applies a Bayesian classification rule to assign a neuroanatomical label to each voxel. The cortical surface was reconstructed to measure thickness at each surface point using a semiautomated approach described previously (Dale and Sereno, 1993; Dale et al., 1999; Fischl et al., 1999a,b; Fischl and Dale, 2000; Salat et al., 2004). Thickness measurements were obtained by reconstructing representations of the gray matter/white matter (WM) boundary (Dale and Sereno, 1993; Dale et al., 1999) and the pial surface and then calculating the distance between those surfaces at each point across the cortical mantle. The measurement technique used here has been validated via histological (Rosas et al., 2002) as well as manual (Kuperberg et al., 2003) measurements. The cortical surface was parcellated as described by Fischl et al. (2004), labeling 33 cortical sulci and gyri (Desikan et al., 2006), and thickness values were calculated in these regions of interest (ROIs).
A novel procedure for longitudinal analysis of volumetric data was used. For each participant, dual three-dimensional follow-up structural scans were rigid-body aligned, averaged, and affine aligned to the participant's baseline. A deformation field was calculated from a nonlinear registration according to Holland et al. (2008). The images are heavily blurred (smoothed), making them almost identical, and a merit or potential function was calculated. This merit function expresses the intensity difference between the images at each voxel and depends on the displacement field for the voxel centers of the image being transformed; it is also regularized to keep the displacement field spatially smooth. The merit function by design will have a minimum when the displacement field induces a good match between the images. It is minimized efficiently using standard numerical methods. Having found a displacement field for the heavily blurred pair of images, the blurring is reduced and the procedure repeated, thus iteratively building up a better displacement field. Two important additions to this are as follows: (1) applying the final displacement field to the image being transformed, then nonlinearly registering the resultant image to the same target, and finally tracing back through the displacement fields thus calculated to find the net displacement field; and (2) restricting to regions of interest and zooming when structures are separated by only a voxel or two. These additional features enable very precise registration involving large or subtle deformations, even at small spatial scales with low boundary contrast. Although large deformations are allowed by multiple nonlinear registration (or relaxation) steps, nonphysical deformations are precluded because at each level of blurring the image undergoing deformation is restricted to conform to the target. Note that calculating the deformation field does not depend on initially segmenting tissue. This deformation field was used to align scans at the subvoxel level. The follow-up aligned image underwent skull stripping and subcortical segmentations, with labels applied from the baseline scan. For the cortical reconstructions, surface coordinates for the white and pial boundaries were derived from the baseline images and mapped onto the follow-up images using the deformation field. Parcellations from the baseline image were then applied to the follow-up image. This resulted in a one-to-one correspondence between each vertex in the base image and the follow-up image. The procedure produces an estimate of the percentage cortical volume loss at each vertex and within each ROI. To the extent that regional areas are relatively stable across time points, the volume change is likely driven almost exclusively by changes in thickness. Estimated intracranial volume (ICV) was used to correct the volumetric data. This was calculated by use of an atlas normalization procedure described by Buckner et al. (2004), in which the atlas scaling factor is used as a proxy for ICV, shown to correlate at a level of 0.93 with manually derived ICV.
CSF acquisition and analysis.
CSF samples were obtained by lumbar puncture using a standardized protocol, as described in the ADNI procedures manual at the participating clinical sites. The CSF samples were transferred into polypropylene transfer tubes, frozen on dry ice within 1 h of collection, and shipped overnight to the ADNI Biomarker Core Laboratory at the University of Pennsylvania Medical Center. The CSF aliquots were stored in bar code-labeled polypropylene vials at −80°C. All CSF samples were analyzed over a 14 d period. Test/retest analyses of a subset of the samples showed excellent analytical performance, with r2 values for test/retest results of 0.85–0.98 (Shaw et al., 2009).
t-tau, p-tau, and Aβ1-42 levels in CSF were determined by the Luminex xMAP technology using the INNO-BIA AlzBio3 kit (Innogenetics), as described previously in detail (Olsson et al., 2005). In brief, the method is based on flow cytometric separation of antibody-coated microspheres that are labeled with a specific mixture of two fluorescent dyes. After binding of a biotinylated reporter antibody, quantification is made by binding of a third fluorochrome coupled to streptavidin. The method allows simultaneous quantification of several proteins the same sample and has been shown to have high analytical precision (Olsson et al., 2005). Mean values are presented in supplemental Table 1 (available at www.jneurosci.org as supplemental material).
Statistical analyses.
Cortical thickness and volume change data were analyzed on a vertex-by-vertex basis, covering the entire cortical mantle, by use of general linear models (GLMs). In addition, 30 ROIs were chosen for further analyses (Fig. 1). To reduce the number of comparisons, MR ROIs were averaged across hemispheres. ICV, sex, and age were regressed out from all subcortical ROI measures before they were entered into statistical analyses, and sex and age were used as covariates in all surface-based analyses. Because sex does not influence levels of CSF biomarkers and age and CSF biomarker levels are not correlated in the present sample (p > 0.60), sex and age were not regressed out from the CSF biomarker values unless specified. Analyses were performed for t-tau, and p-tau, Aβ42, as well as the ratios between each of the tau measures and Aβ42. Primary focus is on tau and Aβ42, but the ratio scores were included to allow comparisons with previous studies.
Figure 1.

Cortical regions of interest. Fifteen automatically defined gyral-based cortical regions were selected for additional analyses. These are shown on the semi-inflated surface of the template brain to which all individual brains were registered.
The group contrasts of interest were NC versus MCI and NC versus AD. We did not focus on the MCI versus AD contrast, because only a subgroup of the MCI patients will eventually develop AD, making it difficult to interpret the differences between the MCI group and the AD group. Furthermore, because AD has an insidious onset, cutoff will necessarily be somewhat arbitrary, with some MCI patients having mild AD. This also contributes to making the interpretations difficult. Nevertheless, we will present results from MCI versus AD comparisons as supplemental data (available at www.jneurosci.org as supplemental material). For the surface-based analyses, a false discovery rate (FDR) < 0.05 was used as the statistical criterion of significance, corrected for multiple comparisons, whereas an α value of 0.01 was used for the ROI analyses. FDR was used to decide α level for the left hemisphere (arbitrary chosen), and then the same level was used to threshold right hemisphere data. In addition to surface-based GLMs, t tests were used for the ROIs and CSF biomarker values to perform between-group comparisons. Effect sizes for all measures were quantified by use of Cohen's D (group difference divided by the pooled SD).
The first question regarded whether CSF biomarker levels can explain the morphometric differences between NC and MCI and between NC and AD. First, CSF biomarkers were related to baseline morphometry by surface-based GLMs point by point across the cortical surface and by linear regressions. Next, GLMs were used to assess difference in cortical across the cortical surface both with and without the three CSF measures used as simultaneous covariates. The results were compared with an analysis performed without the CSF biomarkers as covariates, so that a group effect might indicate that the CSF measures influenced the relationship between diagnosis and baseline thickness. Third, separate regression analyses were run using each MR ROI as a dependent variable, with diagnosis, sex, and age as predictors. The regressions were run both with and without the three CSF measures entered simultaneously as covariates. A substantial decrease in β values for diagnosis when CSF variables are included among the predictors would indicate that the effect of diagnosis on morphometry was influenced by differences in CSF biomarker levels. These analyses were performed only for those ROIs in which significant correlations with CSF biomarkers were found in the MCI or the AD group.
The second question regarded how baseline brain morphometry and CSF biomarkers are related to longitudinal brain atrophy. Atrophy rates in the diagnostic groups were examined and tested with linear mixed-effect models with change (both 1 and 2 years included in the same analysis) × three diagnostic groups (NC, MCI, and AD) for each of the 30 ROIs. Baseline cortical thickness was used as a regressor on cortical change at 1 year point by point in the MCI sample, and linear mixed-effects models were run to test the relationship between baseline morphometry and change in each of the 30 ROIs. The relationship between CSF biomarker levels and atrophy was tested by surface-based GLMs and by running linear mixed-effect models for CSF biomarker values with percentage change in volume for each of the ROIs. For 12 selected ROIs in which CSF biomarkers were related to atrophy, rate of change was compared between NC, MCI with highest (high-risk) and MCI with lowest (low-risk) levels of p-tau, and highest (low-risk) and lowest (high-risk) levels of Aβ42, based on median splits. The split values were almost identical to the medians for the MCI group reported in the major ADNI paper on CSF biomarkers (Shaw et al., 2009). Dividing the MCI patients in two groups yielded the opportunity to compare pairwise the NC group and each of the MCI groups. The relationships were tested by use of linear mixed-effects models, and the results were shown as surface overlays and plotted as atrophy graphs with error bars. A mixed linear model analysis was run to test whether apolipoprotein E (APOE) genotype had an effect on rate of change in the MCI group, either alone or in interaction with levels of CSF biomarkers. APOE was coded as presence of zero, one, or two ε4 alleles.
To answer the third question, of whether CSF biomarkers and morphometry at baseline are related to change in CDR-sb, the relationship between the CSF biomarkers, the 30 ROIs, and CDR-sb at baseline, 1 and 2 years were tested with linear mixed-effect models. In addition, Pearson's correlations between CSF biomarkers, brain morphometry and change in CDR-sb scores were used to test the relationships at each time point separately.
For questions 2 and 3, the analyses of interest were performed in the MCI group, because predictors of brain atrophy and clinical change (as indexed by CDR-sb) are especially important in MCI as it is suggested to represent a transitional phase between NC and AD (Petersen, 2004; Petersen and Bennett, 2005). Additionally, the MCI group was approximately twice the size of the other groups, ensuring adequate statistical power. The analyses were repeated for AD, and the results are presented as supplemental online data (available at www.jneurosci.org as supplemental material) and briefly commented on below.
Results
Background analyses: comparisons of diagnostic groups at baseline
Cortical thickness was compared between NC and the two patient groups point by point across the cortical surface (Fig. 2). The pattern of effects corresponded to known distributions of MCI- and AD-related cortical thickness differences. There were large effects in medial and lateral temporal areas but also in frontal, parietal, and lateral occipital areas. t tests and Cohen's D for the 30 ROIs are presented in Table 2 and Figure 3. NC had thicker cortex than MCI and AD except in the precentral gyrus, larger volume for all subcortical structures except for the caudate, cerebellum cortex and WM, pallidum, and putamen, and smaller ventricles except for the third and fourth ventricles. Cohen's D values were generally above 1, with hippocampus showing the largest effect of 2.57 for the NC versus AD contrast. For the CSF measures, all group contrasts were significant and the relationships were in the expected direction (for tau and tau/Aβ42 ratios, NC < MCI and AD; for Aβ42, NC > MCI and AD). The CSF measures also showed large effects sizes, with the largest found for t-tau/Aβ42 for the NC versus AD contrast (1.92). Cohen's D for the contrast between MCI and AD is presented in supplemental Table 2 (available at www.jneurosci.org as supplemental material). The largest effects sizes were seen for entorhinal, inferior temporal, and middle temporal cortices, as well as the inferior lateral ventricles, with Cohen's D exceeding 1. Cohen's D for the biomarkers were 0.42 (t-tau), 0.47 (p-tau), and 0.60 (Aβ42).
Figure 2.

Cortical thickness differences between NC and MCI/AD patients. Cortical thickness was compared point by point across the entire cortical mantle between NC and MCI patients and between NC and AD patients. Sex and age were used as covariates. The results are shown as p value maps, thresholded at FDR < 0.05. As can be seen, MCI patients have thinner cortex than NC in large cortical areas, including medial, lateral, and inferior temporal cortices, medial parietal cortex, and widespread areas in frontal cortex. The differences between NC and AD patients are even larger, covering the major part of the cortical surface, except the area around the central sulcus.
Table 2.
Independent t test of group differences in volume and CSF biomarker levels
| NC − MCI (df = 278) |
NC − AD (df = 193) |
|||||
|---|---|---|---|---|---|---|
| t | Cohen's D | p < | t | Cohen's D | p < | |
| CSF biomarkers | ||||||
| t-tau | −6.10 | −0.98 | 10−8 | −7.67 | −1.59 | 10−11 |
| p-tau | −5.41 | −0.92 | 10−6 | −6.69 | −1.37 | 10−9 |
| Aβ42 | 6.05 | 1.05 | 10−8 | 8.84 | 1.78 | 10−15 |
| t-tau/Aβ42 | −6.84 | −1.09 | 10−10 | −9.25 | −1.92 | 10−15 |
| p-tau/Aβ42 | −6.20 | −1.04 | 10−8 | −7.53 | −1.55 | 10−11 |
| Subcortical ROIs | ||||||
| Accumbens | 2.65 | 0.47 | 0.01 | 3.59 | 0.73 | 0.001 |
| Amygdala | 6.76 | 1.20 | 10−11 | 10.15 | 2.06 | 10−18 |
| Caudate | 1.07 | 0.19 | NS | 1.72 | 0.35 | NS |
| Cerebellum cortex | 0.39 | 0.07 | NS | 1.98 | 0.40 | NS |
| Cerebellum white matter | −0.27 | −0.05 | NS | −0.62 | −0.11 | NS |
| Cerebral white matter | 2.37 | 0.41 | 0.05 | 4.54 | 0.92 | 10−4 |
| Hippocampus | 10.48 | 1.76 | 10−20 | 12.50 | 2.57 | 10−24 |
| Pallidum | −1.21 | −0.22 | NS | 0.85 | 0.17 | NS |
| Putamen | 1.11 | 0.25 | NS | 2.52 | 0.51 | 0.05 |
| Thalamus | 2.28 | 0.42 | 0.05 | 4.23 | 0.86 | 10−4 |
| Ventricular ROIs | ||||||
| Lateral ventricles | −3.20 | −0.57 | 0.005 | −5.21 | −1.05 | 10−6 |
| Inferior lateral ventricles | −5.69 | −0.94 | 10−7 | −9.03 | −1.88 | 10−14 |
| 3rd ventricle | −0.95 | −0.16 | NS | −3.13 | −0.64 | 0.01 |
| 4th ventricle | 1.26 | 0.22 | NS | 0.79 | 0.16 | NS |
| Cortical ROIs | ||||||
| Cuneus | 2.38 | 0.42 | 0.05 | 2.15 | 0.43 | 0.05 |
| Entorhinal | 7.71 | 1.30 | 10−12 | 12.17 | 2.50 | 10−23 |
| Fusiform | 6.03 | 1.07 | 10−8 | 8.14 | 1.68 | 10−12 |
| Lingual | 2.22 | 0.39 | 0.05 | 3.44 | 0.69 | 0.001 |
| Inferior parietal | 4.74 | 0.80 | 10−5 | 8.58 | 1.76 | 10−14 |
| Inferior temporal | 6.02 | 1.08 | 10−8 | 10.38 | 2.14 | 10−18 |
| Retrosplenial | 4.69 | 0.81 | 10−5 | 8.09 | 1.66 | 10−12 |
| Lateral orbitofrontal | 3.74 | 0.66 | 0.001 | 5.85 | 1.18 | 10−7 |
| Medial orbitofrontal | 4.35 | 0.77 | 10−4 | 5.70 | 1.17 | 10−7 |
| Middle temporal | 5.95 | 1.07 | 10−8 | 9.97 | 2.05 | 10−17 |
| Parahippocampal | 4.57 | 0.81 | 10−5 | 7.02 | 1.42 | 10−10 |
| Precentral | 1.79 | 0.31 | NS | 3.75 | 0.76 | 0.001 |
| Precuneus | 4.63 | 0.83 | 10−5 | 6.10 | 1.25 | 10−8 |
| Superior frontal | 3.94 | 0.69 | 0.001 | 6.43 | 1.30 | 10−8 |
| Supramarginal | 3.76 | 0.67 | 0.001 | 6.59 | 1.33 | 10−9 |
Sex, age, and ICV were regressed out from the volume data before they were entered into the analyses, whereas sex and age were regressed out from the cortical data.
Figure 3.

Cohen's D for baseline CSF measures and brain morphometry. The five CSF variables and the 30 morphometric regions of interests were compared between NC versus MCI and NC versus AD. Hippocampus and entorhinal cortex were the two variables that best distinguished the groups. The CSF measures also yielded large effects sizes. A large proportion of the variables had a Cohen's D exceeding 0.8, which is regarded as a large effect size. The error bars represent 95% confidence intervals. Please note that, although these give an indication of degree of uncertainty associated with the estimation of the mean of each variable, they cannot be used to make statistical inferences about the significance of effect size differences among the variables.
Can differences in CSF biomarker levels explain baseline morphometric differences between NC and MCI/AD?
In separate analyses, t-tau, p-tau, and Aβ42 were used as regressors in GLMs on cortical thickness across the surface in the MCI sample. No relationships were found with a threshold of FDR < 0.05. The relationships between CSF biomarkers and morphometry in the 30 ROIs were tested by linear regressions, and Table 3 shows the resulting F values for the baseline measures in the “BL” column. With an α level of 0.01, t-tau showed significant negative relationships with several regions: higher levels of t-tau were related to smaller caudate volume and thinner entorhinal, inferior temporal, precuneus, and middle temporal cortices. p-tau showed a significant negative relationship to caudate and middle temporal cortices only, whereas Aβ42 was not significantly related to any ROIs. The ratio measures generally did not show stronger relationships. For comparison purposes, the analyses were repeated for the AD group. Negative relationships were found between t-tau and the precuneus, cuneus, and inferior parietal cortices and between p-tau and the inferior parietal cortex. No significant relationships with Aβ42 or the ratio measures were found.
Table 3.
Relationships between CSF biomarkers and morphometric ROIs in the MCI group
| t-tau | Aβ42 | p-tau | t-tau/Aβ42 | p-tau/Aβ42 | ||||||
|---|---|---|---|---|---|---|---|---|---|---|
|
F |
F |
F |
F |
F |
||||||
| BL | Long | BL | Long | BL | Long | BL | Long | BL | Long | |
| Subcortical ROIs | ||||||||||
| Cerebral white matter | 1.51 | 1.0 | 1.72 | 0.94 | 1.38 | 0.74 | 1.04 | 0.09 | 0.70 | 0.01 |
| Cerebellar white matter | 1.22 | 4.69 | 0.64 | 0.02 | 1.23 | 6.35* | 0.98 | 3.34 | 0.93 | 4.90 |
| Cerebellar gray matter | 0.12 | 1.11 | 0.29 | 0.78 | 0.54 | 1.86 | 0.01 | 4.76 | 0.56 | 4.86 |
| Thalamus | 0.31 | 0.00 | 4.35 | 0.24 | 0.02 | 0.01 | 2.05 | 0.14 | 0.87 | 0.48 |
| Caudate | 15.58* | 0.77 | 1.80 | 0.05 | 15.68* | 0.28 | 10.84* | 0.06 | 10.59* | 0.00 |
| Putamen | 0.10 | 0.28 | 0.16 | 2.13 | 0.90 | 0.01 | 0.00 | 0.53 | 0.23 | 0.07 |
| Pallidum | 0.09 | 0.25 | 0.52 | 0.89 | 0.11 | 3.72 | 0.14 | 0.62 | 0.16 | 3.21 |
| Hippocampus | 2.45 | 7.31* | 2.85 | 7.08* | 2.21 | 7.00* | 2.54 | 5.14 | 2.01 | 5.51 |
| Amygdala | 2.05 | 14.50* | 2.68 | 14.20* | 1.81 | 23.91* | 2.06 | 11.58* | 1.49 | 20.03* |
| Accumbens | 1.11 | 2.19 | 1.41 | 1.32 | 1.25 | 2.20 | 0.57 | 1.23 | 0.65 | 1.11 |
| Brainstem | 0.06 | 2.93 | 0.23 | 0.89 | 0.05 | 2.54 | 0.01 | 5.27 | 0.04 | 4.04 |
| Ventricular ROIs | ||||||||||
| Lateral ventricle | 5.65 | 3.88 | 0.01 | 9.59* | 4.07 | 6.84* | 2.92 | 4.63 | 2.71 | 7.62* |
| Inferior lateral ventricle | 0.23 | 3.40 | 2.59 | 11.94* | 0.05 | 5.91 | 0.05 | 4.01 | 0.01 | 6.02 |
| 3rd ventricle | 1.80 | 2.46 | 4.55 | 1.39 | 0.54 | 3.90 | 1.43 | 1.27 | 0.01 | 2.00 |
| 4th ventricle | 0.89 | 0.74 | 0.05 | 1.99 | 0.68 | 0.91 | 0.30 | 1.96 | 0.20 | 1.99 |
| Cortical ROIs | ||||||||||
| Cuneus | 5.33 | 5.58 | 1.21 | 0.24 | 1.29 | 2.37 | 2.25 | 6.15 | 0.46 | 2.92 |
| Entorhinal | 6.99* | 9.25* | 3.80 | 11.85* | 6.49 | 18.03* | 6.82* | 4.64 | 5.98 | 11.66* |
| Fusiform | 3.85 | 3.98 | 1.32 | 18.27 | 2.18 | 8.51 | 3.34 | 2.57 | 1.71 | 6.34 |
| Inferior parietal | 5.37 | 2.42 | 0.58 | 8.94 | 2.96 | 7.70 | 3.82 | 0.54 | 1.96 | 4.01 |
| Inferior temporal | 8.23* | 7.12* | 0.75 | 11.76* | 3.12 | 13.75* | 5.55 | 3.28 | 1.88 | 7.65* |
| Retrosplenial | 2.91 | 3.66 | 0.41 | 3.25 | 2.98 | 3.40 | 2.22 | 0.71 | 1.90 | 1.00 |
| Lateral orbfrontal | 1.58 | 1.53 | 0.38 | 0.14 | 0.80 | 1.54 | 1.79 | 0.13 | 0.65 | 0.05 |
| Lingual | 0.26 | 0.35 | 0.01 | 5.43 | 0.77 | 0.00 | 0.02 | 0.05 | 0.60 | 0.02 |
| Medial orbfrontal | 0.11 | 3.98 | 0.05 | 0.83 | 0.00 | 3.50 | 0.16 | 3.35 | 0.00 | 2.56 |
| Middle temporal | 10.60* | 7.24* | 1.65 | 10.01* | 6.74* | 12.65* | 8.85* | 3.13 | 5.59 | 6.75* |
| Parahippocampal | 6.06 | 9.20* | 3.00 | 13.62* | 2.10 | 11.87* | 8.07* | 6.76* | 3.23 | 9.37* |
| Precentral | 0.44 | 2.11 | 2.71 | 0.24 | 0.02 | 0.50 | 0.03 | 3.82 | 0.10 | 1.80 |
| Precuneus | 8.64* | 0.09 | 0.39 | 4.59 | 6.51 | 1.28 | 5.49 | 0.08 | 4.05 | 0.40 |
| Superior frontal | 3.14 | 0.84 | 0.94 | 0.13 | 3.23 | 1.10 | 2.01 | 0.04 | 1.57 | 0.09 |
| Supramarginal | 4.10 | 0.71 | 0.00 | 2.59 | 1.80 | 1.74 | 3.15 | 0.02 | 1.21 | 0.17 |
BL, Baseline; Long, longitudinal.
*p < 0.01. Sex, age, and ICV were regressed out from all subcortical and ventricular variables, and sex and age were regressed out from all cortical variables, before they were entered into the analyses. Relationships at baseline are with volume (subcortical and ventricular ROIs) or thickness (cortical ROIs) and were tested by linear regression analyses. Relationships with longitudinal data are with percentage change for each ROI and were tested by mixed-effects general linear models.
The statistical surface maps from Figure 2 were recalculated with all three CSF biomarkers as covariates. The p maps from these analyses and from the original group comparison were binarized at p < 0.01 (FDR < 0.05), color coded, and projected onto the same brain surface (Fig. 4). Most of the effects for the NC–AD comparison survived controlling for CSF biomarkers (88%). For the NC–MCI comparison, 56% of the significant vertices were still significant after controlling for CSF biomarker levels. For both comparisons, effects in areas heavily implicated in MCI and AD (e.g., medial and lateral temporal areas, medial parietal areas) could not be explained by introducing CSF biomarkers as covariates.
Figure 4.

Effects of regressing out CSF variables on baseline thickness differences. The cortical thickness comparisons between the diagnostic groups (see Fig. 2) were repeated with t-tau, p-tau, and Aβ42 as covariates. The resulting p value maps from the group contrasts with and without the CSF biomarkers as covariates were binarized at p < 0.01 (FDR < 0.05) and color coded. A pink vertex indicates a significant difference in cortical thickness that did not survive when the CSF measures were entered as covariates, and a yellow vertex indicates a thickness difference that remained significant after entering the CSF measures as covariates. Large cortical areas showed significant differences in thickness even after the CSF measures were entered as covariates, indicating CSF-independent cortical thickness differences. The number of vertices surviving correction for CSF measures was substantially larger for the NC versus AD contrast compared with the NC versus MCI contrast attributable to the larger effect sizes in general in the latter analyses.
The surface-based analyses were followed up by ROI analyses for those ROIs in which significant relationships between biomarkers and morphometry were found. The results are presented in supplemental Table 3 (available at www.jneurosci.org as supplemental material). Multiple regressions were run to predict morphometry from age, sex, and diagnosis, with and without the CSF biomarkers as covariates. The partial β values for diagnosis were reduced by a modest amount when CSF biomarkers were used as covariates. In only one case did the introduction of the CSF biomarkers as additional covariates reduce a significant diagnosis–morphometry relationship to a nonsignificant level. For the NC versus AD contrast, the β for cuneus dropped from −0.28 (p = 0.044) to −0.10 (p = 0.56). For the NC versus MCI contrast, explained variance in entorhinal thickness was 17, 14, and 20% for diagnostic group, CSF biomarkers, and the combination of both, respectively. For inferior temporal, the explained variance was 15, 13, and 19%, for middle temporal was 14, 14, and 18%, for precuneus was 9, 12, and 14%, and for caudate was 1, 3, and 6%. For the NC versus AD contrast, explained variance by diagnosis, CSF biomarkers, and the combination of both was 30, 12, and 35% for inferior parietal cortex, 17, 12, and 24% for precuneus, and 4, 8, and 11% for cuneus.
How are baseline brain morphometry and CSF biomarkers related to brain atrophy?
First, atrophy rates in the diagnostic groups were examined. Second, the effects of baseline morphometry on atrophy were tested. Finally, the relationships between CSF biomarkers and atrophy were explored.
Mean rate of change per ROI for MCI and AD is presented in Table 4. For each of the 30 ROIs, a linear mixed-effect model with 1 and 2 year change × 3 diagnostic groups (NC, MCI, and AD) was run (supplemental Table 4, available at www.jneurosci.org as supplemental material). Significant (p < 0.05) effects of group on rate of change were found for all ROIs except the fourth ventricle. For all ROIs, the change was most prominent in the AD group.
Table 4.
Rate of change
| MCI |
AD |
|||||||
|---|---|---|---|---|---|---|---|---|
| 1 year |
2 years |
1 year |
2 years |
|||||
| Mean | SE | Mean | SE | mean | SE | mean | SE | |
| Subcortical ROIs | ||||||||
| Cerebral white matter | −0.97 | 0.07 | −1.55 | 0.14 | −1.42 | 0.11 | −2.86 | 0.24 |
| Cerebellum white matter | −0.88 | 0.07 | −1.06 | 0.12 | −1.06 | 0.13 | −1.85 | 0.23 |
| Cerebellum gray matter | −0.64 | 0.08 | −0.82 | 0.13 | −0.99 | 0.12 | −1.93 | 0.26 |
| Thalamus | −1.11 | 0.09 | −1.61 | 0.14 | −1.43 | 0.12 | −2.72 | 0.25 |
| Caudate | −0.86 | 0.13 | −0.96 | 0.23 | −1.47 | 0.21 | −2.59 | 0.40 |
| Putamen | −0.93 | 0.08 | −1.43 | 0.16 | −1.52 | 0.14 | −2.99 | 0.30 |
| Pallidum | −0.69 | 0.07 | −0.97 | 0.12 | −0.95 | 0.12 | −1.88 | 0.23 |
| Hippocampus | −2.24 | 0.18 | −4.11 | 0.38 | −3.83 | 0.28 | −7.42 | 0.65 |
| Amygdala | −2.57 | 0.21 | −4.66 | 0.46 | −3.89 | 0.28 | −8.14 | 0.64 |
| Accumbens | −1.19 | 0.12 | −1.82 | 0.22 | −1.90 | 0.23 | −3.57 | 0.31 |
| Brainstem | −0.52 | 0.08 | −0.35 | 0.13 | −0.61 | 0.10 | −1.12 | 0.20 |
| Ventricular ROIs | ||||||||
| Lateral ventricle | 7.86 | 0.69 | 12.66 | 1.12 | 10.60 | 0.77 | 21.62 | 1.80 |
| Inferior lateral ventricle | 12.19 | 0.84 | 19.50 | 1.65 | 15.73 | 0.96 | 32.30 | 2.24 |
| 3rd ventricle | 5.44 | 0.55 | 7.57 | 0.91 | 6.29 | 0.66 | 12.23 | 1.14 |
| 4th ventricle | 0.99 | 0.43 | 0.02 | 0.68 | 1.18 | 0.55 | 2.06 | 0.85 |
| Cortical ROIs | ||||||||
| Cuneus | −0.17 | 0.07 | −0.22 | 0.14 | −0.46 | 0.09 | −0.94 | 0.19 |
| Entorhinal | −1.70 | 0.14 | −3.18 | 0.28 | −2.29 | 0.17 | −5.07 | 0.36 |
| Fusiform | −1.21 | 0.10 | −2.18 | 0.22 | −2.19 | 0.15 | −4.74 | 0.38 |
| Inferior parietal | −1.19 | 0.11 | −2.08 | 0.25 | −2.21 | 0.18 | −4.29 | 0.39 |
| Inferior temporal | −1.62 | 0.13 | −3.00 | 0.28 | −2.98 | 0.22 | −6.25 | 0.49 |
| Retrosplenial | −0.76 | 0.09 | −1.38 | 0.15 | −1.44 | 0.15 | −2.90 | 0.30 |
| Lateral orbitofrontal | −0.87 | 0.10 | −1.20 | 0.15 | −1.25 | 0.18 | −2.33 | 0.30 |
| Lingual | −0.25 | 0.07 | −0.48 | 0.12 | −0.68 | 0.09 | −1.41 | 0.19 |
| Medial orbitofrontal | −0.62 | 0.09 | −1.21 | 0.14 | −1.10 | 0.15 | −1.97 | 0.25 |
| Middle temporal | −1.61 | 0.14 | −2.94 | 0.28 | −2.87 | 0.23 | −5.85 | 0.49 |
| Parahippocampal | −1.12 | 0.12 | −2.19 | 0.20 | −1.95 | 0.15 | −4.35 | 0.35 |
| Precentral | −0.23 | 0.08 | −0.50 | 0.16 | −0.59 | 0.13 | −1.38 | 0.23 |
| Precuneus | −0.87 | 0.10 | −1.50 | 0.20 | −1.63 | 0.16 | −3.34 | 0.33 |
| Superiorfrontal | −0.69 | 0.10 | −1.22 | 0.17 | −1.13 | 0.18 | −2.31 | 0.29 |
| Supramarginal | −0.77 | 0.11 | −1.39 | 0.20 | −1.80 | 0.20 | −3.79 | 0.40 |
The percentage rate of change from baseline to 1 and 2 years are presented along with SEs, split by diagnostic group. Mixed general linear models of change at year 1 and 2 × 3 diagnostic groups (NC, MCI, and AD) yielded significant (p < 0.05) effects of group on rate of change for all ROIs except fourth ventricle. For all ROIs, the change was most prominent in the AD group, as can be seen from the table.
Baseline cortical thickness was used as a regressor on cortical change at 1 year point by point in the MCI sample (Fig. 5). At FDR < 0.05, thinner baseline cortex was associated with greater volume loss in lateral temporal areas, the temporal pole, and the anterior part of the entorhinal cortex in the right hemisphere. This pattern was less pronounced in the left hemisphere. Inspection of the uncorrected p maps showed that the same topographical pattern was present in both hemispheres but that the p levels were somewhat higher in the left. Baseline morphometry was also related to change in the 30 ROIs in the MCI sample (Table 5) by mixed linear models. Relationships (p < 0.01) between baseline and change were found for cerebral WM, hippocampus, amygdala, and entorhinal, fusiform, inferior temporal, and middle temporal cortices. Large volumes and thick cortex were related to less atrophy.
Figure 5.

Prediction of 1 year cortical change from baseline cortical thickness in MCI. One year change in cortical volume in MCI was predicted from baseline cortical thickness point by point across the cortical surface, with age and sex used as covariates. The top shows uncorrected p values, and the bottom shows the p maps thresholded at FDR < 0.05. Thinner cortex at baseline was associated with a larger percentage decrease in cortical volume over 1 year. The corrected p maps indicate that this effect is larger in the right hemisphere. The uncorrected maps show that the left hemisphere has the same pattern of effects, but the p values were lower. Red–yellow colors indicate that thicker baseline cortex was related to less volume loss, and blue–green indicates the inverse relationship.
Table 5.
Correlations between baseline morphometry and 1 and 2 year morphometric volume change in the MCI group
| F | p | |
|---|---|---|
| Subcortical ROIs | ||
| Cerebral white matter | 10.54* | 0.001* |
| Cerebellar white matter | 0.24 | NS |
| Cerebellar gray matter | 3.52 | NS |
| Thalamus | 0.67 | NS |
| Caudate | 6.18 | NS |
| Putamen | 2.46 | NS |
| Pallidum | 0.16 | NS |
| Hippocampus | 22.71* | 10−5* |
| Amygdala | 16.63* | 10−4* |
| Accumbens | 0.82 | NS |
| Brainstem | −0.79 | NS |
| Ventricular ROIs | ||
| Lateral ventricle | 0.76 | NS |
| Inferior lateral ventricle | 5.13 | NS |
| 3rd ventricle | 0.51 | NS |
| 4th ventricle | 5.37 | NS |
| Cortical ROIs | ||
| Cuneus | 6.49 | 0.01 |
| Entorhinal | 18.33* | 10−4* |
| Fusiform | 10.25* | 0.005* |
| Inferior parietal | 6.09 | NS |
| Inferior temporal | 12.50* | 0.001* |
| Retrosplenial | 0.86 | NS |
| Lateral orbfrontal | 0.43 | NS |
| Lingual | 0.04 | NS |
| Medial orbfrontal | 0.03 | NS |
| Middle temporal | 9.28* | 0.005* |
| Parahippocampal | 1.63 | NS |
| Precentral | 0.06 | NS |
| Precuneus | 0.08 | NS |
| Superior frontal | 2.28 | NS |
| Supramarginal | 2.09 | NS |
*p < 0.01. Sex, age, and ICV were regressed out from all subcortical and ventricular variables, and sex and age were regressed out from all cortical variables, before they were entered into the analyses.
In separate analyses, t-tau, p-tau, and Aβ42 were used as regressors on 1 year cortical volume change point by point across the brain surface in the MCI sample (Fig. 6). t-tau showed no relationships with volume change at FDR < 0.05. Higher levels of p-tau were associated with greater volume loss in lateral, medial, and inferior parts of the temporal lobe and supramarginal gyrus bilaterally. In addition, relationships were found in parts of retrosplenial cortex and precuneus, as well as inferior parietal cortex, in the right hemisphere. As t-tau and p-tau are correlated (r = 0.79 in the MCI group), we expected to see similar relationships with atrophy for the two tau measures. Inspections of the unthresholded maps revealed that the relationships between t-tau and atrophy resembled those between p-tau and atrophy but were somewhat weaker. Lower levels of Aβ42 were related to greater volume loss, especially in the left hemisphere, at FDR < 0.05. A large area of effect was seen in the posterior lateral cortex, including lateral occipital, inferior parietal, and fusiform cortex, in addition to most of inferior and middle temporal cortices. Also, effects were found in the left entorhinal and parahippocampal cortices. Inspection of the uncorrected p maps showed that the topographic pattern of effects was symmetrical across hemispheres but with lower p values in the left hemisphere. To look at specific effects of tau versus Aβ42, the GLMs were performed with p-tau and Aβ42 as simultaneous predictors (supplemental Fig. 1, available at www.jneurosci.org as supplemental material). Aβ42 levels were related to atrophy over 1 year in fusiform and lateral occipital cortices, especially in the left hemisphere, whereas no specific effects were seen for p-tau. The analysis was also performed for the ratio of p-tau to Aβ42, and effects were found in left inferior temporal gyrus and the anteriormost part of entorhinal cortex.
Figure 6.

Prediction of 1 year cortical change from baseline CSF biomarker levels. One year change in cortical volume in MCI was predicted from baseline CSF biomarker values point by point across the cortical surface, with age and sex used as covariates. The top shows uncorrected p values, and the bottom shows the p maps thresholded at FDR < 0.05. Higher values of t-tau and lower values of Aβ42 at baseline were associated with a larger percentage decrease in cortical volume over 1 year (red–yellow colors). The corrected p maps indicate that this effect is somewhat larger in the left hemisphere for Aβ42. The uncorrected maps show that the right hemisphere has the same pattern of effects, but the p values were lower.
Linear mixed-effects models were used to test the relationship between CSF biomarkers and change in the 30 ROIs (Table 3). Relationships between higher levels of tau (t-tau and p-tau) and greater cortical volume reductions were found in several regions, including parahippocampal, middle temporal, entorhinal, and inferior temporal cortices, whereas high levels of t-tau also was also related to more atrophy in precuneus and p-tau to change in inferior parietal and fusiform cortices. Of the subcortical structures, more volume changes in amygdala and hippocampus were significantly related to higher levels of t- and p-tau, whereas high p-tau levels also were related to greater change in cerebellum WM and the lateral ventricles. Aβ42 showed generally moderate negative relationships with morphometric change, in which lower levels of Aβ42 were related to more atrophy in several areas, including all temporal cortical areas, inferior parietal cortex, hippocampus and amygdala, and expansion of the lateral and inferior lateral ventricles. For comparison purposes, the analyses were repeated in the AD group. Relationships were found between more atrophy in the inferior temporal cortex (F(1,68) = 7.18, p < 0.01) and higher values of p-tau and the p-tau/Aβ42 ratio (F(1,68) = 7.08, p < 0.01).
Differences in atrophy rate as a function of CSF biomarker levels for 12 selected volumes are shown in Figure 7. The rate of change was compared between NC versus MCI with highest (high-risk) and lowest (low-risk) levels of p-tau and highest (low-risk) and lowest (high-risk) levels of Aβ42, based on a median split. The Aβ42 levels for NC and the low-risk MCI group were not significantly different (t(191) = −0.6, p = 0.95), whereas the NC group had higher mean levels of p-tau than the low-risk MCI group (t(191) = 2.16, p < 0.05). Nevertheless, as can be seen from Figure 7, both the high- and the low-risk MCI groups had significantly greater atrophy rates for several volumes than the NC group, although atrophy rates were greater for the high-risk than the low-risk group. These differences in atrophy were found in areas typically implicated in AD, e.g., the hippocampus and middle temporal cortex. Generally, the effects were highly similar whether groups were defined based on p-tau or Aβ42, and the correlation between p-tau and Aβ42 group membership was 0.50.
Figure 7.
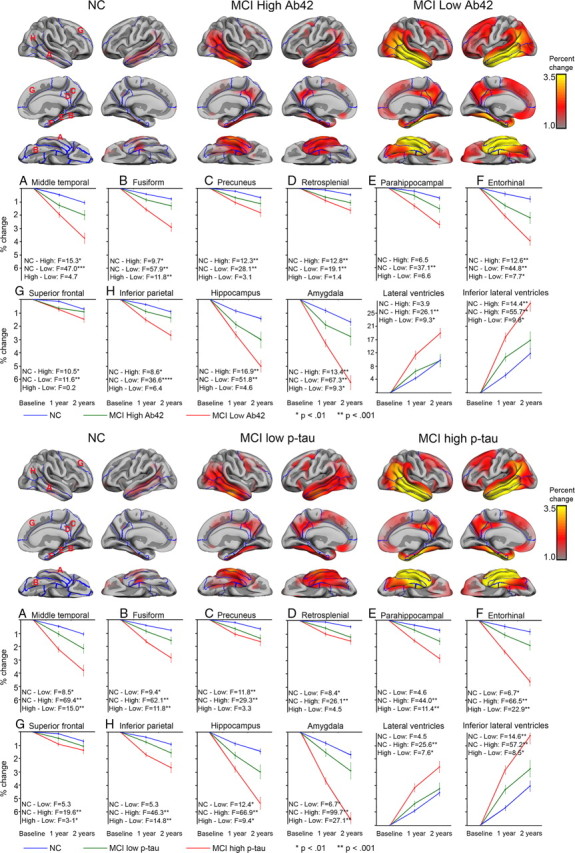
Rate of atrophy as a function of CSF p-tau or Aβ42. The MCI sample was split based on the median value of Aβ42 and p-tau. Rate of change was compared across high Aβ42, low Aβ42, and NC, as well as high p-tau, low p-tau, and NC. The MCI low Aβ42 group did not differ significantly in CSF levels of Aβ42 from the NC group, whereas the NC group had significantly higher CSF values of p-tau (see Results). Percentage cortical 2 year change was calculated for each point on the cortical surface and displayed on the semi-inflated template brain. In addition, mean change at 1 and 2 year were calculated for selected ROIs and plotted with SEs for each group. Mixed linear model analyses were run for two and two group contrasts, and the resulting F and p values are presented. As can be seen, for several ROIs, the MCI group with normal CSF values showed significantly larger 1 and 2 year change than the NC group and significantly smaller change compared with the MCI group with higher p tau or lower Aβ42 levels.
To determine whether APOE genotype affected the relationship between CSF biomarkers and regional atrophy, a linear mixed-effects model was run per ROI (supplemental Table 5, available at www.jneurosci.org as supplemental material). This analysis was restricted to Aβ42 and p-tau, because these were the strongest CSF biomarker predictors of atrophy. APOE ε4 was associated with higher rates of atrophy in hippocampus and amygdala and more expansion of the inferior lateral ventricles; however, APOE genotype did not interact with either CSF biomarker for any of the ROIs.
How closely are baseline brain morphometry and CSF biomarkers related to clinical change (CDR-sb)?
Baseline measures for the CSF biomarkers and the 30 ROIs were related to CDR-sb at baseline 1 and 2 year by linear mixed-effect models (Table 6). No significant (p < 0.01) relationships were found between clinical measures (CDR-sb) and the CSF biomarkers. For the MR variables, accumbens, lateral and inferior lateral ventricles, and entorhinal and parahippocampal cortices were significantly related to CDR-sb. When Pearson's correlations were run to explore the relationship between MR and CSF biomarkers and 1 and 2 year change in CDR-sb separately, it was found that coefficients were generally larger for the 1 year CDR-sb change score and larger still for the 2 year change scores compared with baseline CDR-SB score (supplemental Table 6, available at www.jneurosci.org as supplemental material). Hippocampus, inferior lateral ventricles, cuneus, entorhinal, fusiform, inferior parietal, inferior temporal, retrosplenial, middle temporal, precentral, precuneus, and supramarginal cortices correlated significantly with 2 year CDR-sb change. The highest correlations were found with middle temporal (−0.49), inferior parietal (−0.47), and inferior temporal (−0.46) cortices, as well as the hippocampus (−0.42). t tests of the differences in correlations showed that the correlation between 2 year CDR-sb change and middle temporal cortex was significantly larger than between 2 year change and Aβ42, the CSF biomarker showing the highest correlation with CDR-sb (Aβ42) (t = −2.22, p < 0.05).
Table 6.
Relationships between baseline measures of CSF biomarkers/MR morphometry and clinical change in the MCI group by mixed general linear model
| CDR sum of boxes | |
|---|---|
| F | |
| CSF biomarkers | |
| t-tau | 2.16 |
| p-tau | 1.58 |
| Aβ42 | 1.67 |
| t-tau/Aβ42 | 1.78 |
| p-tau/Aβ42 | 0.95 |
| Subcortical ROIs | |
| Cerebral white matter | 4.80 |
| Cerebellar white matter | 0.18 |
| Cerebellar gray matter | 2.51 |
| Thalamus | 0.15 |
| Caudate | 0.52 |
| Putamen | 0.00 |
| Pallidum | 1.50 |
| Hippocampus | 6.04 |
| Amygdala | 3.35 |
| Accumbens | 11.65* |
| Brainstem | 1.19 |
| Ventricular ROIs | |
| Lateral ventricle | 8.16* |
| Inferior lateral ventricle | 6.55* |
| 3rd ventricle | 5.04 |
| 4th ventricle | 1.47 |
| Cortical ROIs | |
| Cuneus | 0.95 |
| Entorhinal | 7.27 |
| Fusiform | 5.35 |
| Inferior parietal | 2.39 |
| Inferior temporal | 3.21 |
| Retrosplenial | 0.98 |
| Lateral orbfrontal | 2.39 |
| Lingual | 3.97 |
| Medial orbfrontal | 1.55 |
| Middle temporal | 4.74 |
| Parahippocampal | 9.32 |
| Precentral | 0.80 |
| Precuneus | 1.62 |
| Superior frontal | 2.02 |
| Supramarginal | 1.68 |
*p < 0.01.
Discussion
Novel results concerning the relationship between CSF biomarkers and morphometry in MCI and AD were found. First, group differences in brain morphometry were seen even after controlling for CSF biomarker levels. Second, longitudinal atrophy over 1 and 2 years was related to CSF biomarker levels in MCI. This relationship was not restricted to the hippocampus and the ventricles. Although not statistically tested, baseline morphometry showed similar predictive power of atrophy as did CSF biomarkers, and MCI patients with above median levels of Aβ42 and below median levels of p-tau showed more atrophy than controls. Finally, brain morphometry better predicted clinical change (CDR-sb) than did CSF biomarkers.
Confirming previous studies, both MR morphometry (Jack et al., 1999; Thompson et al., 2004; Mosconi et al., 2007; McEvoy et al., 2009; Fennema-Notestine et al., 2009) and CSF biomarkers (Goedert and Spillantini, 2006; Dubois et al., 2007; Hampel et al., 2008; Spires-Jones et al., 2009) distinguished NC from MCI and AD. The largest effects were observed for hippocampus and entorhinal cortex. The relationships between CSF and morphometry measures were generally weak. This was unexpected because a causal relationship between CSF biomarkers and brain atrophy has been suggested (Arriagada et al., 1992; Price and Morris, 1999; Näslund et al., 2000; Thal et al., 2002; de Leon et al., 2006; Goedert and Spillantini, 2006; Spires-Jones et al., 2009). t-tau was significantly related to entorhinal, inferior, and middle temporal cortical thickness, consistent with knowledge that tau-related pathology begins in these regions (Braak and Braak, 1985; Mesulam, 1999). However, the relationships were not strong, and no significant relationships were found between t-tau and the hippocampus or amygdala, regions also vulnerable to early tau-related pathology. Relationships between tau, Aβ42, and hippocampal volume have been shown previously (de Leon et al., 2006; Fjell et al., 2008), and hippocampal volume has been related to burden of hippocampal neurofibrillary tangles (Silbert et al., 2003), although discrepant results have been reported (Schönknecht et al., 2003). Whereas t-tau was modestly related to temporal cortical thickness, Aβ42 was not related to MR baseline morphometry. Individual variability in baseline volumes may be too large to allow consistent detection of effects of CSF biomarkers on hippocampal volume.
It has been suggested that volumetric temporal and hippocampal damage in MCI is secondary to the pathological depositions of Aβ42 and/or tau pathology (Arriagada et al., 1992; Price and Morris, 1999; Näslund et al., 2000; Thal et al., 2002; de Leon et al., 2006). The present data suggest that CSF biomarkers only explain a fraction of the baseline differences in brain morphometry between NC and MCI/or AD, confirming previous findings with regard to cortical thickness differences in NC versus MCI (Fjell et al., 2008). Hence, CSF tau and Aβ42 as documented in CSF are unlikely to represent the main causal mechanism behind the brain morphometric effects seen in MCI and AD. Thus, it is possible that Aβ42 has a role in AD pathology without necessarily preceding brain atrophy (Lee et al., 2006). It is also interesting to note that the strongest relationship between tau and morphometry measures in MCI was found for the caudate, which is not specifically implicated in AD. Increased tau is also found in other conditions, including frontotemporal dementia, stroke, and healthy aging (Sjögren et al., 2001).
Stronger relationships between CSF biomarkers and morphometry in MCI were found longitudinally. Aβ42 was the most predictive of brain atrophy and was the only unique predictor in the surface-based analysis. This analysis indicated a mainly posterior pattern of effects of Aβ42, with strong correlations in lateral occipital, inferior parietal, lateral temporal, and entorhinal cortices. The ROI analyses showed moderate relationships for several areas implicated in AD, including mesial and lateral temporal areas. The relationships with rates of change in the temporal structures were in accordance with known distribution of CSF biomarker pathology in the brain and were probably partly attributable to larger atrophy rates here.
The relationships between CSF biomarkers and hippocampal atrophy are mainly in agreement with previous studies. High correlations between 2 year change in p-tau and Aβ42 and change in hippocampal volume in six MCI patients has been reported (de Leon et al., 2006). Others found correlations between baseline CSF levels of p-tau but not t-tau and longitudinal hippocampal atrophy in 22 AD patients (Hampel et al., 2005). In a recent publication using data from ADNI, a correlation was found between hippocampal atrophy and baseline levels of Aβ42 but not tau (Schuff et al., 2009). The relationships between change in hippocampal volume and both t- and p-tau in the present study may be related to the larger sample size. However, another study did not find any relationship of CSF Aβ42 or tau and whole-brain atrophy rate, whereas p-tau was mildly related to lower atrophy in AD (Sluimer et al., 2008a). However, no regional measures were included. The present study shows regional relationships beyond the medial temporal areas. Aβ42 was significantly related to rate of change in 10 ROIs, with the hippocampus showing the weakest relationship among these. A similar trend was observed for tau. This highlights the importance of using regional measures beyond global brain volumes and the hippocampus when relating AD brain pathology to biomarkers. The observed relationships between CSF biomarkers and ventricular expansion in the present study confirm the results of a previous study using ADNI participants, using different segmentation methods (Chou et al., 2009). APOE had an impact on atrophy for selected areas of importance in MCI and AD (hippocampus, amygdala, inferior lateral ventricles) but did not interact with the effects of CSF biomarkers on atrophy. This is in contrast to the hypothesis of APOE ε4 as a factor reducing the ability to cope with illness and damage in the brain, e.g., that ε4 with concurrent changes in CSF biomarkers increases the risk of conversion from MCI to AD (Herukka et al., 2007).
Although high levels of tau, especially p-tau, and low levels of Aβ42 were predictive of brain atrophy, MCI patients with lower p-tau and comparable Aβ42 levels with the controls still showed significantly more atrophy in several brain structures. Effects were especially strong in lateral and medial temporal as well as retrosplenial cortices, which are areas vulnerable to AD pathology. To our knowledge, this evaluation of MCI individuals with levels of CSF biomarkers similar to or better than controls has not been reported previously. An implication is that there are pathological processes associated with MCI and AD causing brain atrophy that cannot be explained by group differences in the CSF biomarkers. One explanation is that CSF biomarker levels are indexing processes that cause or are related to brain atrophy in MCI and AD but that separate processes exist, causing atrophic changes unrelated to p-tau or Aβ42. Thus, brain atrophy not related to p-tau and Aβ42 may be common in MCI, and additional atrophy is seen in those patients with elevated levels of p-tau or lowered levels of Aβ42. Another possibility is that the atrophy seen in the patients with higher than median levels of Aβ42 and below median levels of p-tau represents other disease mechanisms than the atrophy seen in patients with abnormal levels of p-tau and Aβ42. These patients may develop dementia of a non-AD type. This should be further tested with longitudinal CSF data and clinical follow-up data. An exception from the observed pattern was the lateral ventricles, in which most expansion over 2 years could be explained by baseline p-tau and Aβ42. It is likely that the ventricular expansion is related to mechanical pressure moving the borders of the deep WM, e.g., attributable to normal pressure hydrocephalus (NPH) and not brain atrophy per se, because there is some comorbidity of NPH and AD (Golomb et al., 2000).
Finally, baseline morphometry was more related to clinical change as indexed by CDR-sb than were CSF biomarkers. Previous results have been mixed, in which some find CSF biomarker levels to be predictive of future dementia in MCI patients (Craig-Schapiro et al., 2008). Interestingly, recent studies reported no association between MMSE change and baseline (Hampel et al., 2005) or change in levels of CSF biomarkers (Sluimer et al., 2008b), whereas brain atrophy was predictive of MMSE change. In the present study, baseline MR was more predictive of CDR-sb change than CSF biomarkers, suggesting a stronger association between brain atrophy and progression of clinical symptoms than between CSF levels and progression of clinical symptoms. It is possible that CSF biomarkers are more sensitive to transition from NC to MCI than to progression of clinical symptoms within MCI patients.
Conclusion
The results of the present study indicate that differences in CSF biomarker levels could not explain baseline morphometric differences between healthy elderly and patients with MCI or AD. In contrast, levels of CSF biomarkers were related to longitudinal atrophy in widespread areas, not restricted to hippocampus and medial temporal cortex. The relationship between CSF biomarker levels and longitudinal brain change was modest, indicating that other factors contribute to atrophy. Finally, baseline MR morphometry better predicted CDR-sb change than did CSF biomarkers.
Footnotes
This work was supported by Grant U24 RR021382 to the Morphometry Biomedical Informatics Research Network (http://www.nbirn.net), which is funded by the National Center for Research Resources at the National Institutes of Health (NIH) (United States) and by the National Institute on Aging/NIH under Grants U01 AG024904 and R01 AG031224. The work of K.B.W. and A.M.F. was supported by the Norwegian Research Council. Data collection and sharing was funded by the Alzheimer's Disease Neuroimaging Initiative (ADNI) (Principal Investigator, Michael Weiner; NIH Grant U01 AG024904). ADNI is funded by the National Institute on Aging, by the National Institute of Biomedical Imaging and Bioengineering, and through generous contributions from the following: Pfizer Inc., Wyeth Research, Bristol-Myers Squibb, Eli Lilly and Company, GlaxoSmithKline, Merck & Co. Inc., AstraZeneca AB, Novartis Pharmaceuticals Corporation, the Alzheimer's Association, Eisai Global Clinical Development, Elan Corporation, Forest Laboratories, and the Institute for the Study of Aging, with participation from the United States Food and Drug Administration. Industry partnerships are coordinated through the Foundation for the National Institutes of Health. The grantee organization is the Northern California Institute for Research and Education, and the study is coordinated by the Alzheimer's Disease Cooperative Study at the University of California, San Diego. ADNI data are disseminated by the Laboratory of Neuro Imaging at the University of California, Los Angeles. We thank Robin Jennings, Michele Perry, Chris Pung, and Elaine Wu for downloading and preprocessing the ADNI MRI data.
Data used in the preparation of this article were obtained from the Alzheimer's Disease Neuroimaging Initiative database (www.loni.ucla.edu/ADNI). As such, the investigators within the ADNI contributed to the design and implementation of ADNI and/or provided data but did not participate in analysis or writing of this report. A complete listing of ADNI investigators is available at http://www.loni.ucla.edu/ADNI/Data/ADNI_Authorship_List.pdf.
A.M.D. is a founder and holds equity in CorTechs Labs and also serves on the Scientific Advisory Board. The terms of this arrangement have been reviewed and approved by the University of California, San Diego in accordance with its conflict of interest policies.
References
- Arriagada PV, Marzloff K, Hyman BT. Distribution of Alzheimer-type pathologic changes in nondemented elderly individuals matches the pattern in Alzheimer's disease. Neurology. 1992;42:1681–1688. doi: 10.1212/wnl.42.9.1681. [DOI] [PubMed] [Google Scholar]
- Braak H, Braak E. On areas of transition between entorhinal allocortex and temporal isocortex in the human brain. Normal morphology and lamina-specific pathology in Alzheimer's disease. Acta Neuropathol. 1985;68:325–332. doi: 10.1007/BF00690836. [DOI] [PubMed] [Google Scholar]
- Buckner RL, Head D, Parker J, Fotenos AF, Marcus D, Morris JC, Snyder AZ. A unified approach for morphometric and functional data analysis in young, old, and demented adults using automated atlas-based head size normalization: reliability and validation against manual measurement of total intracranial volume. Neuroimage. 2004;23:724–738. doi: 10.1016/j.neuroimage.2004.06.018. [DOI] [PubMed] [Google Scholar]
- Chou YY, Leporé N, Avedissian C, Madsen SK, Parikshak N, Hua X, Shaw LM, Trojanowski JQ, Weiner MW, Toga AW, Thompson PM. Mapping correlations between ventricular expansion and CSF amyloid and tau biomarkers in 240 subjects with Alzheimer's disease, mild cognitive impairment and elderly controls. Neuroimage. 2009;46:394–410. doi: 10.1016/j.neuroimage.2009.02.015. [DOI] [PMC free article] [PubMed] [Google Scholar]
- Craig-Schapiro R, Fagan AM, Holtzman DM. Biomarkers of Alzheimer's disease. Neurobiol Dis. 2009;35:128–140. doi: 10.1016/j.nbd.2008.10.003. [DOI] [PMC free article] [PubMed] [Google Scholar]
- Dale AM, Sereno MI. Improved localization of cortical activity by combining EEG and MEG with MRI cortical surface reconstruction: a linear approach. J Cogn Neurosci. 1993;5:162–176. doi: 10.1162/jocn.1993.5.2.162. [DOI] [PubMed] [Google Scholar]
- Dale AM, Fischl B, Sereno MI. Cortical surface-based analysis. I. Segmentation and surface reconstruction. Neuroimage. 1999;9:179–194. doi: 10.1006/nimg.1998.0395. [DOI] [PubMed] [Google Scholar]
- de Leon MJ, DeSanti S, Zinkowski R, Mehta PD, Pratico D, Segal S, Rusinek H, Li J, Tsui W, Saint Louis LA, Clark CM, Tarshish C, Li Y, Lair L, Javier E, Rich K, Lesbre P, Mosconi L, Reisberg B, Sadowski M, DeBernadis JF, Kerkman DJ, Hampel H, Wahlund LO, Davies P. Longitudinal CSF and MRI biomarkers improve the diagnosis of mild cognitive impairment. Neurobiol Aging. 2006;27:394–401. doi: 10.1016/j.neurobiolaging.2005.07.003. [DOI] [PubMed] [Google Scholar]
- Desikan RS, Ségonne F, Fischl B, Quinn BT, Dickerson BC, Blacker D, Buckner RL, Dale AM, Maguire RP, Hyman BT, Albert MS, Killiany RJ. An automated labeling system for subdividing the human cerebral cortex on MRI scans into gyral based regions of interest. Neuroimage. 2006;31:968–980. doi: 10.1016/j.neuroimage.2006.01.021. [DOI] [PubMed] [Google Scholar]
- Du AT, Schuff N, Kramer JH, Rosen HJ, Gorno-Tempini ML, Rankin K, Miller BL, Weiner MW. Different regional patterns of cortical thinning in Alzheimer's disease and frontotemporal dementia. Brain. 2007;130:1159–1166. doi: 10.1093/brain/awm016. [DOI] [PMC free article] [PubMed] [Google Scholar]
- Dubois B, Feldman HH, Jacova C, Dekosky ST, Barberger-Gateau P, Cummings J, Delacourte A, Galasko D, Gauthier S, Jicha G, Meguro K, O'Brien J, Pasquier F, Robert P, Rossor M, Salloway S, Stern Y, Visser PJ, Scheltens P. Research criteria for the diagnosis of Alzheimer's disease: revising the NINCDS-ADRDA criteria. Lancet Neurol. 2007;6:734–746. doi: 10.1016/S1474-4422(07)70178-3. [DOI] [PubMed] [Google Scholar]
- Fennema-Notestine C, Hagler DJ, Jr, McEvoy LK, Fleisher AS, Wu EH, Karow DS, Dale AM. Structural MRI biomarkers for preclinical and mild Alzheimer's disease. Hum Brain Mapp. 2009;30:3238–3253. doi: 10.1002/hbm.20744. [DOI] [PMC free article] [PubMed] [Google Scholar]
- Fischl B, Dale AM. Measuring the thickness of the human cerebral cortex from magnetic resonance images. Proc Natl Acad Sci U S A. 2000;97:11050–11055. doi: 10.1073/pnas.200033797. [DOI] [PMC free article] [PubMed] [Google Scholar]
- Fischl B, Sereno MI, Dale AM. Cortical surface-based analysis. II. Inflation, flattening, and a surface-based coordinate system. Neuroimage. 1999a;9:195–207. doi: 10.1006/nimg.1998.0396. [DOI] [PubMed] [Google Scholar]
- Fischl B, Sereno MI, Tootell RB, Dale AM. High-resolution intersubject averaging and a coordinate system for the cortical surface. Hum Brain Mapp. 1999b;8:272–284. doi: 10.1002/(SICI)1097-0193(1999)8:4<272::AID-HBM10>3.0.CO;2-4. [DOI] [PMC free article] [PubMed] [Google Scholar]
- Fischl B, Salat DH, Busa E, Albert M, Dieterich M, Haselgrove C, van der Kouwe A, Killiany R, Kennedy D, Klaveness S, Montillo A, Makris N, Rosen B, Dale AM. Whole brain segmentation: automated labeling of neuroanatomical structures in the human brain. Neuron. 2002;33:341–355. doi: 10.1016/s0896-6273(02)00569-x. [DOI] [PubMed] [Google Scholar]
- Fischl B, van der Kouwe A, Destrieux C, Halgren E, Ségonne F, Salat DH, Busa E, Seidman LJ, Goldstein J, Kennedy D, Caviness V, Makris N, Rosen B, Dale AM. Automatically parcellating the human cerebral cortex. Cereb Cortex. 2004;14:11–22. doi: 10.1093/cercor/bhg087. [DOI] [PubMed] [Google Scholar]
- Fjell AM, Walhovd KB, Amlien I, Bjørnerud A, Reinvang I, Gjerstad L, Cappelen T, Willoch F, Due-Tønnessen P, Grambaite R, Skinningsrud A, Stenset V, Fladby T. Morphometric changes in the episodic memory network and tau pathologic features correlate with memory performance in patients with mild cognitive impairment. Am J Neuroradiol. 2008;29:1183–1189. doi: 10.3174/ajnr.A1059. [DOI] [PMC free article] [PubMed] [Google Scholar]
- Folstein MF, Folstein SE, McHugh PR. “Mini-mental state.” A practical method for grading the cognitive state of patients for the clinician. J Psychiatr Res. 1975;12:189–198. doi: 10.1016/0022-3956(75)90026-6. [DOI] [PubMed] [Google Scholar]
- Goedert M, Spillantini MG. A century of Alzheimer's disease. Science. 2006;314:777–781. doi: 10.1126/science.1132814. [DOI] [PubMed] [Google Scholar]
- Golomb J, Wisoff J, Miller DC, Boksay I, Kluger A, Weiner H, Salton J, Graves W. Alzheimer's disease comorbidity in normal pressure hydrocephalus: prevalence and shunt response. J Neurol Neurosurg Psychiatry. 2000;68:778–781. doi: 10.1136/jnnp.68.6.778. [DOI] [PMC free article] [PubMed] [Google Scholar]
- Hampel H, Bürger K, Pruessner JC, Zinkowski R, DeBernardis J, Kerkman D, Leinsinger G, Evans AC, Davies P, Möller HJ, Teipel SJ. Correlation of cerebrospinal fluid levels of tau protein phosphorylated at threonine 231 with rates of hippocampal atrophy in Alzheimer disease. Arch Neurol. 2005;62:770–773. doi: 10.1001/archneur.62.5.770. [DOI] [PubMed] [Google Scholar]
- Hampel H, Bürger K, Teipel SJ, Bokde AL, Zetterberg H, Blennow K. Core candidate neurochemical and imaging biomarkers of Alzheimer's disease. Alzheimers Dement. 2008;4:38–48. doi: 10.1016/j.jalz.2007.08.006. [DOI] [PubMed] [Google Scholar]
- Herukka SK, Helisalmi S, Hallikainen M, Tervo S, Soininen H, Pirttila T. CSF Abeta42, Tau and phosphorylated Tau, APOE epsilon4 allele and MCI type in progressive MCI. Neurobiol Aging. 2007;28:507–514. doi: 10.1016/j.neurobiolaging.2006.02.001. [DOI] [PubMed] [Google Scholar]
- Holland D, Hagler D, Fennema-Notestine C, Dale AM. Longitudinal nonlinear registration to quantitative analysis in whole brain and regions of interest. Presented at the Alzheimer's Association 2008 International Conference on Alzheimer's Disease; July; Chicago. 2008. [Google Scholar]
- Jack CR, Jr, Petersen RC, Xu YC, O'Brien PC, Smith GE, Ivnik RJ, Boeve BF, Waring SC, Tangalos EG, Kokmen E. Prediction of AD with MRI-based hippocampal volume in mild cognitive impairment. Neurology. 1999;52:1397–1403. doi: 10.1212/wnl.52.7.1397. [DOI] [PMC free article] [PubMed] [Google Scholar]
- Jack CR, Jr, Weigand SD, Shiung MM, Przybelski SA, O'Brien PC, Gunter JL, Knopman DS, Boeve BF, Smith GE, Petersen RC. Atrophy rates accelerate in amnestic mild cognitive impairment. Neurology. 2008;70:1740–1752. doi: 10.1212/01.wnl.0000281688.77598.35. [DOI] [PMC free article] [PubMed] [Google Scholar]
- Jovicich J, Czanner S, Greve D, Haley E, van der Kouwe A, Gollub R, Kennedy D, Schmitt F, Brown G, Macfall J, Fischl B, Dale A. Reliability in multi-site structural MRI studies: effects of gradient non-linearity correction on phantom and human data. Neuroimage. 2006;30:436–443. doi: 10.1016/j.neuroimage.2005.09.046. [DOI] [PubMed] [Google Scholar]
- Kuperberg GR, Broome MR, McGuire PK, David AS, Eddy M, Ozawa F, Goff D, West WC, Williams SC, van der Kouwe AJ, Salat DH, Dale AM, Fischl B. Regionally localized thinning of the cerebral cortex in schizophrenia. Arch Gen Psychiatry. 2003;60:878–888. doi: 10.1001/archpsyc.60.9.878. [DOI] [PubMed] [Google Scholar]
- Lee HG, Zhu X, Nunomura A, Perry G, Smith MA. Amyloid beta: the alternate hypothesis. Curr Alzheimer Res. 2006;3:75–80. doi: 10.2174/156720506775697124. [DOI] [PubMed] [Google Scholar]
- Leow AD, Yanovsky I, Parikshak N, Hua X, Lee S, Toga AW, Jack CR, Jr, Bernstein MA, Britson PJ, Gunter JL, Ward CP, Borowski B, Shaw LM, Trojanowski JQ, Fleisher AS, Harvey D, Kornak J, Schuff N, Alexander GE, Weiner MW, Thompson PM. Alzheimer's Disease Neuroimaging Initiative: a one-year follow up study using tensor-based morphometry correlating degenerative rates, biomarkers and cognition. Neuroimage. 2009;45:645–655. doi: 10.1016/j.neuroimage.2009.01.004. [DOI] [PMC free article] [PubMed] [Google Scholar]
- Makris N, Meyer JW, Bates JF, Yeterian EH, Kennedy DN, Caviness VS. MRI-Based topographic parcellation of human cerebral white matter and nuclei. II. Rationale and applications with systematics of cerebral connectivity. Neuroimage. 1999;9:18–45. doi: 10.1006/nimg.1998.0384. [DOI] [PubMed] [Google Scholar]
- McEvoy LK, Fennema-Notestine C, Roddey JC, Hagler DJ, Jr, Holland D, Karow DS, Pung CJ, Brewer JB, Dale AM. Alzheimer disease: quantitative structural neuroimaging for detection and prediction of clinical and structural changes in mild cognitive impairment. Radiology. 2009;251:195–205. doi: 10.1148/radiol.2511080924. [DOI] [PMC free article] [PubMed] [Google Scholar]
- Mesulam MM. Neuroplasticity failure in Alzheimer's disease: bridging the gap between plaques and tangles. Neuron. 1999;24:521–529. doi: 10.1016/s0896-6273(00)81109-5. [DOI] [PubMed] [Google Scholar]
- Morris JC. The Clinical Dementia Rating (CDR): current version and scoring rules. Neurology. 1993;43:2412–2414. doi: 10.1212/wnl.43.11.2412-a. [DOI] [PubMed] [Google Scholar]
- Mosconi L, Brys M, Glodzik-Sobanska L, De Santi S, Rusinek H, de Leon MJ. Early detection of Alzheimer's disease using neuroimaging. Exp Gerontol. 2007;42:129–138. doi: 10.1016/j.exger.2006.05.016. [DOI] [PubMed] [Google Scholar]
- Näslund J, Haroutunian V, Mohs R, Davis KL, Davies P, Greengard P, Buxbaum JD. Correlation between elevated levels of amyloid beta-peptide in the brain and cognitive decline. JAMA. 2000;283:1571–1577. doi: 10.1001/jama.283.12.1571. [DOI] [PubMed] [Google Scholar]
- Olsson A, Vanderstichele H, Andreasen N, De Meyer G, Wallin A, Holmberg B, Rosengren L, Vanmechelen E, Blennow K. Simultaneous measurement of beta-amyloid (1–42), total tau, and phosphorylated tau (Thr181) in cerebrospinal fluid by the xMAP technology. Clin Chem. 2005;51:336–345. doi: 10.1373/clinchem.2004.039347. [DOI] [PubMed] [Google Scholar]
- Petersen RC. Mild cognitive impairment as a diagnostic entity. J Intern Med. 2004;256:183–194. doi: 10.1111/j.1365-2796.2004.01388.x. [DOI] [PubMed] [Google Scholar]
- Petersen RC, Bennett D. Mild cognitive impairment: is it Alzheimer's disease or not? J Alzheimers Dis. 2005;7:241–245. doi: 10.3233/jad-2005-7307. discussion 255–262. [DOI] [PubMed] [Google Scholar]
- Pimplikar SW. Reassessing the amyloid cascade hypothesis of Alzheimer's disease. Int J Biochem Cell Biol. 2009;41:1261–1268. doi: 10.1016/j.biocel.2008.12.015. [DOI] [PMC free article] [PubMed] [Google Scholar]
- Price JL, Morris JC. Tangles and plaques in nondemented aging and “preclinical” Alzheimer's disease. Ann Neurol. 1999;45:358–368. doi: 10.1002/1531-8249(199903)45:3<358::aid-ana12>3.0.co;2-x. [DOI] [PubMed] [Google Scholar]
- Rosas HD, Liu AK, Hersch S, Glessner M, Ferrante RJ, Salat DH, van der Kouwe A, Jenkins BG, Dale AM, Fischl B. Regional and progressive thinning of the cortical ribbon in Huntington's disease. Neurology. 2002;58:695–701. doi: 10.1212/wnl.58.5.695. [DOI] [PubMed] [Google Scholar]
- Salat DH, Buckner RL, Snyder AZ, Greve DN, Desikan RS, Busa E, Morris JC, Dale AM, Fischl B. Thinning of the cerebral cortex in aging. Cereb Cortex. 2004;14:721–730. doi: 10.1093/cercor/bhh032. [DOI] [PubMed] [Google Scholar]
- Schönknecht P, Pantel J, Hartmann T, Werle E, Volkmann M, Essig M, Amann M, Zanabili N, Bardenheuer H, Hunt A, Schröder J. Cerebrospinal fluid tau levels in Alzheimer's disease are elevated when compared with vascular dementia but do not correlate with measures of cerebral atrophy. Psychiatry Res. 2003;120:231–238. doi: 10.1016/s0165-1781(03)00197-5. [DOI] [PubMed] [Google Scholar]
- Schuff N, Woerner N, Boreta L, Kornfield T, Shaw LM, Trojanowski JQ, Thompson PM, Jack CR, Jr, Weiner MW. MRI of hippocampal volume loss in early Alzheimer's disease in relation to ApoE genotype and biomarkers. Brain. 2009;132:1067–1077. doi: 10.1093/brain/awp007. [DOI] [PMC free article] [PubMed] [Google Scholar]
- Shaw LM, Korecka M, Clark CM, Lee VM, Trojanowski JQ. Biomarkers of neurodegeneration for diagnosis and monitoring therapeutics. Nat Rev Drug Discov. 2007;6:295–303. doi: 10.1038/nrd2176. [DOI] [PubMed] [Google Scholar]
- Shaw LM, Vanderstichele H, Knapik-Czajka M, Clark CM, Aisen PS, Petersen RC, Blennow K, Soares H, Simon A, Lewczuk P, Dean R, Siemers E, Potter W, Lee VM, Trojanowski JQ. Cerebrospinal fluid biomarker signature in Alzheimer's disease neuroimaging initiative subjects. Ann Neurol. 2009;65:403–413. doi: 10.1002/ana.21610. [DOI] [PMC free article] [PubMed] [Google Scholar]
- Silbert LC, Quinn JF, Moore MM, Corbridge E, Ball MJ, Murdoch G, Sexton G, Kaye JA. Changes in premorbid brain volume predict Alzheimer's disease pathology. Neurology. 2003;61:487–492. doi: 10.1212/01.wnl.0000079053.77227.14. [DOI] [PubMed] [Google Scholar]
- Sjögren M, Vanderstichele H, Agren H, Zachrisson O, Edsbagge M, Wikkelsø C, Skoog I, Wallin A, Wahlund LO, Marcusson J, Nägga K, Andreasen N, Davidsson P, Vanmechelen E, Blennow K. Tau and Abeta42 in cerebrospinal fluid from healthy adults 21–93 years of age: establishment of reference values. Clin Chem. 2001;47:1776–1781. [PubMed] [Google Scholar]
- Sled JG, Zijdenbos AP, Evans AC. A nonparametric method for automatic correction of intensity nonuniformity in MRI data. IEEE Trans Med Imaging. 1998;17:87–97. doi: 10.1109/42.668698. [DOI] [PubMed] [Google Scholar]
- Sluimer JD, Bouwman FH, Vrenken H, Blankenstein MA, Barkhof F, van der Flier WM, Scheltens P. Whole-brain atrophy rate and CSF biomarker levels in MCI and AD: a longitudinal study. Neurobiol Aging. 2008a doi: 10.1016/j.neurobiolaging.2008.06.016. Advance online publication. Retrieved March 1, 2009. [DOI] [PubMed] [Google Scholar]
- Sluimer JD, van der Flier WM, Karas GB, Fox NC, Scheltens P, Barkhof F, Vrenken H. Whole-brain atrophy rate and cognitive decline: longitudinal MR study of memory clinic patients. Radiology. 2008b;248:590–598. doi: 10.1148/radiol.2482070938. [DOI] [PubMed] [Google Scholar]
- Spires-Jones TL, Stoothoff WH, de Calignon A, Jones PB, Hyman BT. Tau pathophysiology in neurodegeneration: a tangled issue. Trends Neurosci. 2009;32:150–159. doi: 10.1016/j.tins.2008.11.007. [DOI] [PubMed] [Google Scholar]
- Thal DR, Rüb U, Orantes M, Braak H. Phases of A beta-deposition in the human brain and its relevance for the development of AD. Neurology. 2002;58:1791–1800. doi: 10.1212/wnl.58.12.1791. [DOI] [PubMed] [Google Scholar]
- Thompson PM, Hayashi KM, Sowell ER, Gogtay N, Giedd JN, Rapoport JL, de Zubicaray GI, Janke AL, Rose SE, Semple J, Doddrell DM, Wang Y, van Erp TG, Cannon TD, Toga AW. Mapping cortical change in Alzheimer's disease, brain development, and schizophrenia. Neuroimage. 2004;23(Suppl 1):S2–S18. doi: 10.1016/j.neuroimage.2004.07.071. [DOI] [PubMed] [Google Scholar]