

Abstract
Homodimers have a role in catalysis and regulation through the formation of stable interfaces. These interfaces are formed through different folding mechanisms such as 2-state without stable intermediate (2S), 3-state with monomer intermediate (3SMI) and 3-state with dimer intermediate (3SDI). Therefore, it is of interest to understand folding mechanism using structural features at the interfaces. Several studies have documented the significance of structural features for the understanding of homodimer folding mechanisms. However, the known features provide limited information for understanding homodimer folding mechanisms. Hence, we created an extended dataset of 47 homodimers (twenty eight 2S, twelve 3SMI and seven 3SDI) to examine the types of interfaces in protein homodimers. 2S are usually small sized, 3SMI are often medium sized and 3SDI often exist as large sized proteins. The ratio of interface to total (I/T) residue is large in 2S and small in 3SMI and 3SDI. Hence, we used I/T measure to group 2S, 3SMI and 3SDI into categories with large I/T (≫ 50%), moderate I/T (50 - 25%) and small I/T (≪ 25%) interfaces. The grouping is further sub-grouped based on the type of physical interaction visualized at the interface using representations in two dimensions (2D). 2D representation of the interface shows eight different forms of interactions in these homodimers. 2S homodimers frequently have large I/T and thus, utilize the entire protein structure in the formation of the interface where the individual subunits are heavily inter communicated with each other. This is not true in the case of 3SMI and 3SDI. 3SMI subunits usually interact with each other at the interface with a gentle touch-like contact and hence, they have low I/T ratio. 3SDI are often quite different in interaction compared to 3SMI and their subunits do deeply interact at the interface with only one part of the surface and hence also having low I/T ratio.
Keywords: homodimer, interface, structures, mode, interaction, types
Background
The role homodimers play in regulation is critical. The formation of homodimer interfaces is inspiring. Homodimer interfaces are formed through 3 folding mechanism (2state (2S), 3state with monomer intermediate (3SMI) and 3‐state with dimer intermediate (3SDI)). Neet and Timm (1994) reviewed 17 homodimers with known unfolding data (denatured species fraction measured by spectroscopic techniques such as fluorescence, CD, NMR and absorption) [1]. They noticed that some dimers unfold through a step forming intermediates (3 state ‐ 3S), while others do not (2 state ‐ 2S). Unfolding of desulfoferridoxin homodimer using GuHcl was shown by Apiyo and colleagues (2001) [2]. They observed a high thermodynamic stability of desulfoferridoxin indicating the formation of intermediates in unfolding (showing evidence for 3S folding mechanism). Mazzini and colleagues (2002) observed dimer dissociation before unfolding rather than the reverse in bovine odorant binding protein [3].
The role of homodimer structures in understanding homodimer folding mechanism is eminent. More than forty homodimer structures with known folding data have been compiled [4]. Therefore, it is of interest to identify and relate common structural features within known folding class of homodimers. Tsai and colleagues (1997) investigated 187 stable and 57 symmetry related oligomeric structural interfaces [4]. They observed that 2S interfaces are similar to protein cores and 3SMI interfaces resemble monomer surfaces in structural elements. Tiana and Broglia (2002) studied the evolution of two identical 20 letter residue chains (homodimer) within the framework of a lattice model using Monte Carlo simulation [5]. They proposed that 3S binds as it folds, while 2S folds and then binds. Levy and colleagues (2004) grouped 2S and 3SMI dimers based on the relationship between the intramolecular/intermolecular contacts ratio and interface hydrophobicity using information gleaned from 11 homodimers with known unfolding data [6]. They suggested that the native protein 3D structure is the major factor governing the choice of homodimer folding and binding mechanism.
Mei and colleagues (2005) reviewed 32 homodimer structures (class A ‐ 18 (potential 2S); class B ‐ 10 (potential 3SMI); class C ‐ 4 (potential 3SDI)) with known unfolding data [7]. They defined interface amino acid residue (IAR) and squared loop length (SLL) to illustrate 2S, 3SMI and 3SDI interfaces. IAR is the distance between the first and last amino acid that take part in the intersubunit interaction. SLL is the sum of the squared distances between two successive residues of the monomer. They described three models of interfaces:
large IAR and small SLL;
large IAR and large SLL; and
medium IAR and small SLL.
They suggest that class B structures mimic the second model with large IAR and larger SLL like the second model. Li and colleagues (2005) used 41 homodimer structures with known folding mechanism data to distinguish 2S from 3S [8]. Their analysis showed that small proteins with large interface area and high interface hydrophobicity are 2S (80%). However, 3S are large proteins with small interface area and low interface hydrophobicity (60%). Lulu and colleagues documented structural features to discriminate 2S and 3S homodimers in a dataset of 42 structures [9]. Here, we describe the analysis of 47 homodimers (twenty eight 2S, twelve 3SMI and seven 3SDI) to examine the types of inter subunit interactions at their interfaces.
Methodology
Dataset
We created a structural dataset 47 homodimers from Protein databank (PDB) with known corresponding folding data through literature survey (Table 1 in supplementary material). The dataset consists of twenty eight (28) 2S, twelve (12) 3SMI, and seven (7) 3SDI. The mean length of monomers for 2S is 122.6; 3SMI is 228.4 and 3SDI is 397.4 (Table 2 in supplementary material). Thus the mean length in the dataset is small for 2S, moderate for 3SMI and large for 3SDI. However, it should be noted that the standard deviation about the mean is small for 2S, moderate for 3SMI and high for 3SDI (Table 2 in supplementary material).
Interface area
Interface area in each homodimer structure is defined as the change in accessible surface area (delta ASA) from monomer to dimer formation. It is calculated as the mean difference in ASA of each monomer in un-complex state and complex state. The distribution of interface areas to monomer length for 2S, 3SMI and 3SDI complexes in the dataset is given in Figure 1. ASA was calculated using the software SURFACE RACER 5.0 [10].
Figure 1.
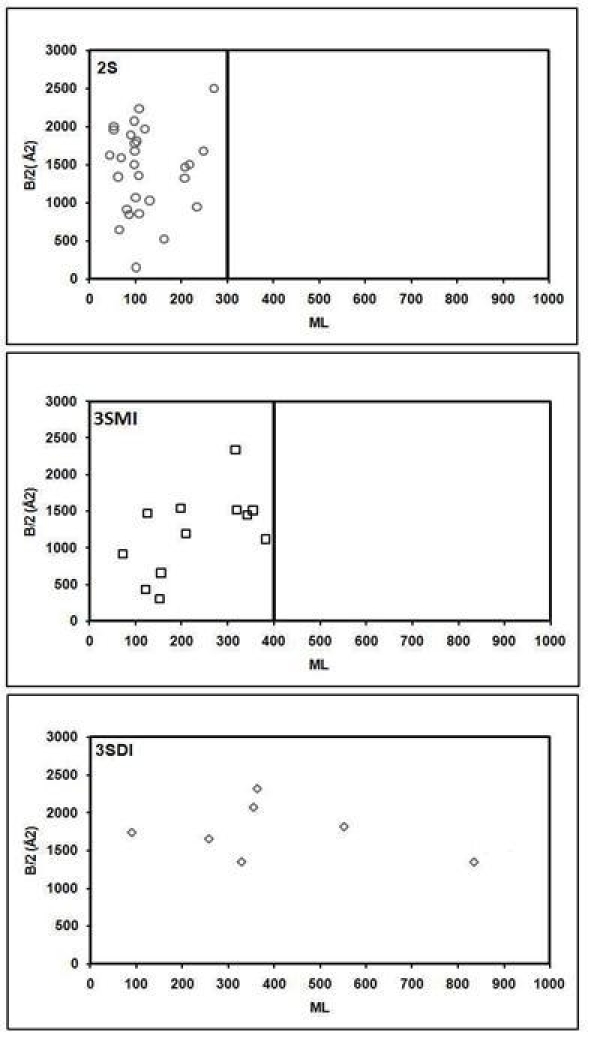
Distribution of Interface area along the Monomer length for 2S, 3SMI and 3SDI. According to monomer length, 2S proteins fall within the range of 300, 3SMI within 400 and 3SDI within 900. This implies that 2S proteins have a small ML, 3SMI have a moderate ML, and 3SDI have a larger ML.
Interface to total (I/T) ratio
The interface residues involved in homodimer binding are identified for each structure using delta ASA data (residues having delta ASA ≫ 0 are interface residues). Thus, i/t ratio was calculated as the ratio of the number of interface to total residues. The distribution of i/t ratio in 2S, 3SMI and 3SDI datasets are shown in Figure 2. The percent mean i/t ratio (Table 3 in supplementary material) for 2S is larger (38%) than 3SMI (18%) and 3SDI (17%). The grouping of 2S, 3SMI and 3SDI homodimers based on large (≫ 50%), moderate (50-25%) and small ( ≪ 25%) i/t ratio is given in Table 4 (see supplementary material).
Figure 2.

Distribution of I/T ratio for 2S, 3SMI and 3SDI. The figure implies that the I/T ratio for 2S is larger than 3SMI and 3SDI.
Representation of interface in 2-dimension
We represented the interface for each homodimer in 2-dimersion as a function of residue number (see Figure 5-7). We then grouped 2S, 3SMI and 3SDI interfaces based on I/T ratio and by the type of interface interaction based on visual inspection.
Figure 5.

Example of types of interfaces in 2S in accordance with large, moderate and small I/T ratios. The two vertical axes indicate residue numbers and the two horizontal axes indicate interface area.
Figure 7.

Example of types of interfaces in 3SDI in accordance with large, moderate and small I/T ratios. The two vertical axes indicate residue numbers and the two horizontal axes indicate interface area.
Types of interfaces
The 2-dimensional patterns of interfaces between monomers in homodimers are different. These patterns are
N type ‐ N terminal interaction;
C type ‐ C terminal interaction;
M type ‐ Middle interaction;
NAC type ‐ N and C terminal interaction;
CAM type ‐ C terminal and middle interaction;
NMC type ‐ N and C terminal and middle interaction;
FL type ‐ Full interaction
. Please see Figure 4 for examples of each type of interfaces. The distribution of the interface types in 2S, 3SMI and 3SDI is given in Table 5 (see supplementary material).
Figure 4.

Types of interface interactions that were resolved from the information gleaned by visual inspection. There are eight types of intersubunit interaction: N (interaction only at the N terminal); C (interaction only at the C terminal); M (interaction only in the middle); NAC (interaction at both the terminals); NAM (interaction at the N terminal and in the middle); CAM (interaction at the C terminal and in the middle); NMC (interaction at both the terminals and in the middle); FL (full interaction).
Results
Figure 1 shows the distribution of 2S, 3SMI and 3SDI with increase in monomer length (ML) and interface area (B/2). 2S proteins fall within 300, 3SMI within 400 and 3SDI within 900 residues. This implies that 2S proteins are small sized, 3SMI are moderate sized, and 3SDI are large in size. Figure 2 shows the distribution of 2S, 3SMI and 3SDI with respect to interface-to-total residues (I/T) ratio. The average percent I/T ratio for 2S, 3SMI and 3SDI is given in Table 3. Thus, Figure 2 implies that I/T ratio for 2S are considerably larger than 3SMI and 3SDI. Figure 3 illustrates the hypothetical scenario for representing interfaces with large (≫50%), moderate (25-50%), and small ( ≪ 25%) I/T ratios. Figure 4 gives the types of possible interactions at the homodimer interfaces. This illustrates the mode of interactions between subunits. Eight different modes of interactions are shown, namely, N (interaction only at the N terminal); C (interaction only at the C terminal); M (interaction only in the middle); NAC (interaction at both the terminals); NAM (interaction at the N terminal and in the middle); CAM (interaction at the C terminal and in the middle); NMC (interaction at both the terminals and in the middle); FL (full interaction). Figure 5 to Figure 7 shows the type of homo-dimer interfaces in 2S, 3SMI and 3SDI, respectively. Examples of different interface associations in 2S (Figure 8), 3SMI (Figure 9) and 3SDI (Figure 10) are shown.
Figure 3.

2 ‐ Dimensional representation of interfaces with large, moderate and small I/T ratio for both symmetric and asymmetric homodimers.
Figure 8.
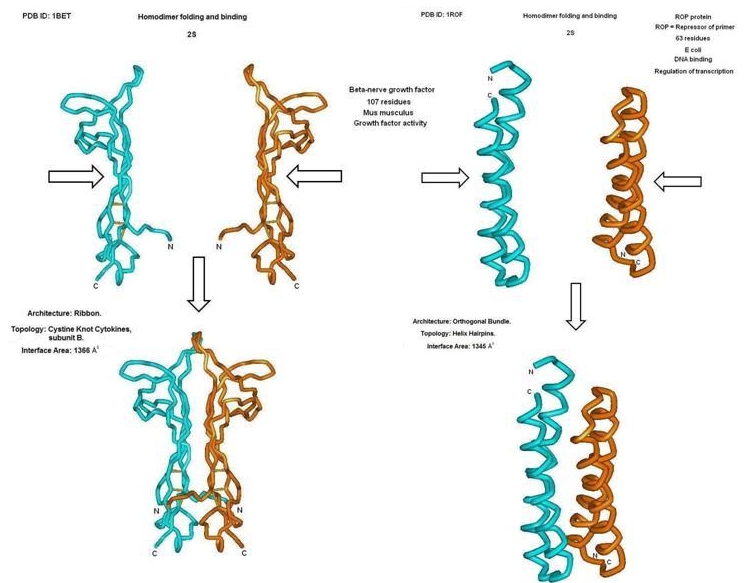
Example of 3 ‐ D representation of interactions by non-inverted (1BET) and inverted (1ROP) homodimers in 2S.
Figure 9.

Example of 3 ‐ D representation of interactions by non-inverted(1HQO) and inverted (1LUC) homodimers in 3SDI.
Figure 10.

Example of 3 ‐ D representation of interactions by non-inverted (1DFX) homodimers in 3SMI.
Discussion
The formation of homodimers through distinct folding mechanism and their role in regulation is intriguing for cell and molecular biologists. The relationship between homo-dimer folding mechanism and known homodimers structures have been investigated in recent studies using structural datasets [3–9]. Neet and Timm (1994) reviewed unfolding data for 17 homodimers and documented some homodimers having 3S mechanism while others with 2S mechanism [2]. Tsai and colleagues (1997) observed that 2S interfaces are similar to protein cores and 3SMI interfaces resemble monomer surfaces in structural elements among 187 stable and 57 symmetry related oligomeric structural interfaces [4]. Levy and colleagues (2004) suggested that the native protein 3D structure is the major factor governing the choice of homodimer folding and binding mechanism in 11 homodimers with known unfolding data [6]. Mei and colleagues (2005) defined interface amino acid residue (IAR - distance between the first and last amino acid that take part in the inter-subunit interaction) and squared loop length (SLL - sum of the squared distances between two successive residues of the monomer) in 32 homodimer structures and proposed that 3SMI models have large IAR and larger SLL [7]. Li and colleagues (2005) used 41 homodimer structures and showed that small proteins with large interface area and high interface hydrophobicity are 2S and 3S are large proteins with small interface area and low interface hydrophobicity. [8] Lulu and colleagues (2009) showed that interface to total (I/T) residues ratio is large for 2S than 3SMI and 3SDI in a dataset of 42 homodimers [9]. Thus, these studies provide structural insight to homodimers folding mechanism using structural data. However, the structural relevance of known homodimers to folding mechanism is not yet explicit. Hence, we created an extended dataset of 47 homodimers with known folding data (Table 1 in supplementary material). The monomer length characteristics of the dataset for 2S, 3SMI and 3SDI are given Table 2 (see supplementary material). The mean size for 2S (122.6) is smaller than 3SMI (228.4) and the mean size for 3SMI is smaller than 3SDI (397.4). It should be noted that small sized proteins of less than 100 residues are available in all the three categories of homodimers. However, large sized proteins (≫ 500 residues) are characteristics of 3SDI. The size of individual subunits in homodimers does influence the formation of interface area in each structural complex. The distribution of interface area in 2S, 3SMI and 3SDI with subunit size (monomer length) is given in Figure 1. Figure 1 shows that 2S are often small sized with small to large interface area, while 3SMI are small to medium sized with small to medium interface area. This is similar to the conclusions made by Li et al. (2005) [8] that small proteins with large interface area are 2S and 3S are large proteins with small interface area. The ratio of interface residues to total residues (I/T) is larger for 2S than 3SMI and 3SDI (Figure 2) similar to that shown by Lulu et al. (2009) [9]. The mean value for I/T ratio in all three categories is given in Table 3 (see supplementary material).
The significance of monomer subunit size, interface area and ratio of interface to total residues in 2S, 3SMI and 3SDI homodimers has been realized in this analysis and elsewhere [8,9] . However, the utilization of these features in further understanding the mode if homodimers interfaces has not yet been comprehended. Thus, we grouped 2S, 3SMI and 3SDI structures into three categories based on large (≫50%), moderate (25-50%) and small (≪ 25%) I/T ratio values (Table 4 in supplementary material). The grouping shows that 3SMI and 3SDI structures are with either moderate or small I/T ratio values unlike 2S with small to large I/T values. Thus, homodimer interfaces exist with small to large I/T ratio values in the dataset. Hence, the physical interface between subunits in them is subsequently formed in different ways as hypothetically illustrated in Figure 3. The interface formed between monomer subunits are either with inverted or non-inverted terminals as shown in Figure 3. A similar classification has been proposed earlier by Mei et al. (2005) using interface amino acid residue (IAR - distance between the first and last amino acid that take part in the inter-subunit interaction) and squared loop length (SLL - sum of the squared distances between two successive residues of the monomer) [7].
We represented the interface for each homodimer in 2-dimersion as a function of residue number (see Figures 5-7). We then grouped 2S, 3SMI and 3SDI interfaces based on I/T ratio and by the type of interface interaction based on visual inspection. The physical associations between interacting monomer subunits at the interface is hypothetically illustrated in Figure 4. Eight different modes of interactions are shown, namely, N (interaction only at the N terminal); C (interaction only at the C terminal); M (interaction only in the middle); NAC (interaction at both the terminals); NAM (interaction at the N terminal and in the middle); CAM (interaction at the C terminal and in the middle); NMC (interaction at both the terminals and in the middle); FL (full interaction). Figure 5 to Figure 7 shows the type of homodimer interfaces in 2S, 3SMI and 3SDI, respectively. Examples of different interface associations in 2S (Figure 8), 3SMI (Figure 9) and 3SDI (Figure 10) are shown. The distribution of types of different interfaces against I/T ratio is given for all homodimer structures in the dataset (Table 5 and Table 6 in supplementary material). Thus, data presented here provides a framework for understanding homodimer interactions and their folding mechanism using structures. However, the extrapolation of these observations to monomer subunit sequences for potential application in the prediction of homodimer folding and binding is not yet explicit. It should also be noted that relationship between homodimer folding with biological function is of interest in future.
Conclusion
The consideration of homodimers as potential drug targets has been recognized in recent years. Therefore, an understanding of their structure and mechanism of folding is of value. Homodimer folding is usually established using CD, NMR, adsorption and fluorescence techniques. This is generally time consuming and tedious. Determination of folding mechanism for known homodimer structures using structural features is of interest. Hence, we show here that 2S, 3SMI and 3SDI homodimers have distinct structural interfaces corresponding to their folding mechanisms. 2S are small, 3SMI are medium and 3SDI are large sized. We grouped 2S, 3SMI and 3SDI into categories with large I/T (≫ 50%), moderate I/T (50 - 25%) and small I/T (≪ 25%) interfaces. 2D representation of the interface shows eight different forms of interactions in these homodimers. 2S homodimers frequently have large I/T and thus, utilize the entire protein structure in the formation of the interface where the individual subunits are heavily inter communicated with each other. This is not true in the case of 3SMI and 3SDI. 3SMI subunits usually interact with each other at the interface with a gentle touch-like contact and hence, they have low I/T ratio. 3SDI are often quite different in interaction compared to 3SMI and their subunits do deeply interact at the interface with only one part of the surface and hence also having low I/T ratio. Data presented here finds utility in understating homodimer folding mechanism from known structures.
Author's contribution
PK conceived the idea and designed the experiment. VK and AS performed the analysis and summarized results. SL participated in the analysis and UK helped in manuscript preparation.
Supplementary material
Figure 6.

Example of types of interfaces in 3SMI in accordance with large, moderate and small I/T ratios. The two vertical axes indicate residue numbers and the two horizontal axes indicate interface area.
Acknowledgments
VK, AS and SL wish to express their sincere thanks to all members of Biomedical Informatics for providing necessary support and material for the analysis. SL is a visitor to Biomedical Informatics.
Footnotes
Citation:Karthikraja et al, Bioinformation 4(3): 101-111 (2009)
References
- 1.Neet KE, Timm DE. Protein Sci. 1994;3:2167. doi: 10.1002/pro.5560031202. [DOI] [PMC free article] [PubMed] [Google Scholar]
- 2.Apiyo D, et al. Biochemistry. 2001;40:4940. doi: 10.1021/bi002653y. [DOI] [PubMed] [Google Scholar]
- 3.Mazzini A, et al. Biochim Biophys Acta. 2002;1599:90. doi: 10.1016/s1570-9639(02)00404-1. [DOI] [PubMed] [Google Scholar]
- 4.Tsai CJ, et al. Protein Sci. 1997;6:1793. doi: 10.1002/pro.5560060901. [DOI] [PMC free article] [PubMed] [Google Scholar]
- 5.Tiana G, Broglia RA. Proteins. 2002;49:82. doi: 10.1002/prot.10196. [DOI] [PubMed] [Google Scholar]
- 6.Levy Y, et al. Proc Natl Acad Sci U S A. 2004;101:511. doi: 10.1073/pnas.2534828100. [DOI] [PMC free article] [PubMed] [Google Scholar]
- 7.Mei G, et al. Febs J. 2005;272:16. [Google Scholar]
- 8.Li L, et al. Bioinformation. 2005;1:42. doi: 10.6026/97320630001042. [DOI] [PMC free article] [PubMed] [Google Scholar]
- 9.Lulu S, et al. J Mol Graph Model. 2009 doi: 10.1016/j.jmgm.2009.04.002. [DOI] [PubMed] [Google Scholar]
- 10.Tsodikov OV, et al. J Comput Chem. 2002;23:600. doi: 10.1002/jcc.10061. [DOI] [PubMed] [Google Scholar]
Associated Data
This section collects any data citations, data availability statements, or supplementary materials included in this article.