

Abstract
The early and late components of the event-related potential (ERP) Old–New effect are well characterized with respect to long-term memory, and have been associated with processes of familiarity and recollection, respectively. Now, using a short-term memory paradigm with verbal and nonverbal stimuli, we explored the way that these two components respond to variation in recency and stimulus type. We found that the amplitude of the early component (or frontal N400, FN400) showed Old–New effects only for verbal stimuli and increased with recency. In contrast, the later component (or late positive component, LPC) showed Old–New effects across a range of stimulus types and did not scale with recency. These results are consistent with the way that these same ERP components have been characterized in long-term memory, supporting the idea that some of the same processes underlie long- and short-term item recognition.
Descriptors: Old-New effects, LPC, FN400, Short-term recognition, Verbal, Nonverbal
The substantial literature on stimulus repetition's effect on the event-related potential (ERP) shows that ERPs evoked by previously experienced stimuli are more positive going than ERPs evoked by new stimuli (for reviews, see Johnson, 1995; Rugg, 1995). This effect, referred to as the “ERP Old–New effect” in the context of long-term memory paradigms, has been divided into early and late factors, which correspond to the frontal N400 (FN400) and late positive component (LPC), respectively. This distinction between early and late factors is justified by evidence that these two components are sensitive to different experimental manipulations (Curran, 2000; Smith, 1993) and have distinct topographies at the scalp (Curran, 2000).
A variety of stimuli can elicit a robust ERP Old–New effect: words (Rugg & Nagy, 1989), orthographically legal nonwords (Beisteiner et al., 1996), and meaningful pictures (Rugg & Doyle, 1994). Studies using nonverbal stimuli have frequently failed to observe ERP Old–New effects. Such failures have been reported in the case of meaningless pictures (Crites, Delgado, Devine, & Lozano, 2000; Rugg & Doyle, 1994; Thomas, 1992), novel objects (Beisteiner et al., 1996; Rugg, 1995), and spatial locations (Mecklinger, 2000). A few studies have observed ERP Old–New effects for nonverbal stimuli such as novel stimuli trained for categorization (Curran, Tanaka, & Weiskopf, 2002) and faces (Nessler, Mecklinger, & Penney, 2005).1 These studies led us to hypothesize that verbalizability moderates the size of the ERP Old-New effect.
The dual-process model is one characterization of the ERP Old–New effect that has garnered substantial support. According to dual-process theorists, dissociations observed in recognition memory tasks can be explained by two distinct memory processes: recollection and familiarity (for a review, see Yonelinas, 2002). Dual-process theories generally define recollection as a process involving the retrieval of specific details, including source information, and describe familiarity as a feeling of knowing in the absence of source information. Recent studies suggest that the FN400 indexes familiarity and that the LPC indexes a recollective process (Curran, 2000, 2004; Curran & Cleary, 2003; Curran et al., 2002; Diana, Vilberg, & Reder, 2006; Duzel, Yonelinas, Mangun, Heinze, & Tulving, 1997). However, support for this mapping between ERP components on one hand and memory processes on the other has come almost exclusively from studies of long-term memory.
The FN400 and late positive components of the ERP Old–New effect have been well studied and characterized in tasks involving long-term memory, but their role, if any, in short-term memory is far less well understood. Evidence that these effects are present in short-term memory tasks (Crites, Devine, Lozano, & Moreno, 1998; Crites et al., 2000) and that dual processes may be at work during short-term recognition (McElree & Dosher, 1989) motivated us to explore the properties of these two effects in short-term memory. In doing so, we manipulated factors that have been explored in long-term recognition tasks, using five different stimulus types in a Sternberg (1966) short-term recognition paradigm. These stimulus types comprised letters, words, objects, spatial locations (Jonides et al., 1993), and sinusoidal gratings (Kahana & Sekuler, 2002; Kahana, Zhou, Geller, & Sekuler, 2007; Visscher, Kaplan, Kahana, & Sekuler, 2007; Zhou, Kahana, & Sekuler, 2004).
Two criteria governed our selection of the five stimulus types that were used in this study. First, several of the stimulus types (letters, words, drawings of familiar objects, and spatial locations) were chosen, in part, to replicate types of materials used in previous research on the ERP Old–New effect. As the four classes of stimuli previously produced partially divergent results, comparisons among the four here would be particularly informative. The second criterion influencing our choice of stimulus materials can be seen in Olsson and Poom's (2005) demonstration that stimulus categorizability is a powerful influence on short-term memory. They showed that when test stimuli are easily categorized, short-term memory's measured capacity is considerably higher than when test stimuli are likely to be confused with one another, that is, when they are less easily categorized. So, to manipulate the potential load on short-term memory, we chose three stimulus types (letters, names of familiar objects, and drawings of the corresponding objects) that would likely lend themselves to easy categorization and the generation of reliable, consistent verbal labels, and two stimulus types (spatial location and gratings) whose intratype similarity would lead to some interitem confusion and resist reliable categorization. To take some examples, subjects who are shown the word “fork” or a clear line drawing of a fork are virtually certain to code each in a consistent way on repeated presentations, just as they would if they saw the letter F several times; in contrast, subjects who see abstract visual patterns that are fairly similar to one another, as our gratings are, will sometimes mistake them for one another, and will not categorize them in a highly consistent fashion. Of course, spatial location and grating patterns, the materials we chose, are not the only kinds of stimuli whose interitem similarity could impact short-term recognition. In fact, it has long been recognized that even with verbal materials, similarity can play a special, significant role in the computations underlying episodic memory (e.g., Deese, 1959; Hintzman, 1988; Roediger & McDermott, 1995).
In summary, our aim was to examine the ways in which the FN400 and LPC responded to task manipulations during a short-term memory task. In so doing, we sought improved understanding of the function of the two components, and the processes they represent, in short-term memory and of the relationship between short-term and long-term memory.
Method
Participants
The participants were 12 right-handed volunteers (four female) ranging in age from 19 to 29 years. All participants had normal or corrected-to-normal vision. Participants received a base payment plus a performance-based bonus. Brandeis University's Committee for the Protection of Human Subjects approved this research and the informed consent that was provided to participants.
Stimuli
Five different pools of stimuli were employed: single letters, words, pictures of objects, dots at different spatial locations, and two-dimensional sinusoidal gratings. Each pool consisted of 16 unique visual stimuli. The letter pool contained lower case exemplars of the consonants b, c, d, f, g, h, j, k, l, m, n, p, q, r, t, and v. The word pool contained the nouns ball, bat, bed, bell, cake, car, chair, dog, ear, y, fork, hat, heart, key, kite, and shoe, all in lowercase text. The object pool comprised drawings, each of which corresponded to one noun in the word pool; the drawings were taken from Snodgrass and Vanderwart's (1980) set of black and white line drawings. With the exception of the drawing of a baseball bat, all object drawings had previously been shown to enjoy very high name agreement, that is, Snodgrass and Vanderwart's subjects agreed, on average, 92% of the time as to the single best name for each object picture. This high level of consistency supports the idea that each drawing was easily categorized and named. The pool of spatial position stimuli was generated by presenting a 1-cm–diameter white disc at 1 of 16 different, nonoverlapping, evenly spaced locations on the screen. All the locations were 10 cm equidistant from the center of the screen, that is, they were positioned on the circumference of a virtual circle centered on the screen's center. To reduce the differential ease with which particular, canonical positions (e.g., directly upward from center) could be remembered, locations were shifted by 10° away from those positions. Finally, the pool of grating stimuli comprised 16 different two-dimensional textures, similar to those used in some previous studies of short-term memory (e.g., Kahana & Sekuler, 2002; Visscher et al., 2007; Zhou et al., 2004). Each texture was a superposition of one horizontal and one vertical sinusoidal luminance grating, generating a luminance profile described by
| (1) |
where Lavg represents mean luminance (L), f and g represent the spatial frequency of the vertical and horizontal components, respectively, and A is defined by
| (2) |
The parameter values used to generate the 16 grating stimuli were A = 0.25; f = g = {0.8; 1.3; 2.1; 3.4} cycles/degree. The luminance of the monitor was linearized by calibration routines from the Psychtoolbox (Pelli, 1997). The 16 gratings used in our study are shown in Figure 1.
Figure 1.
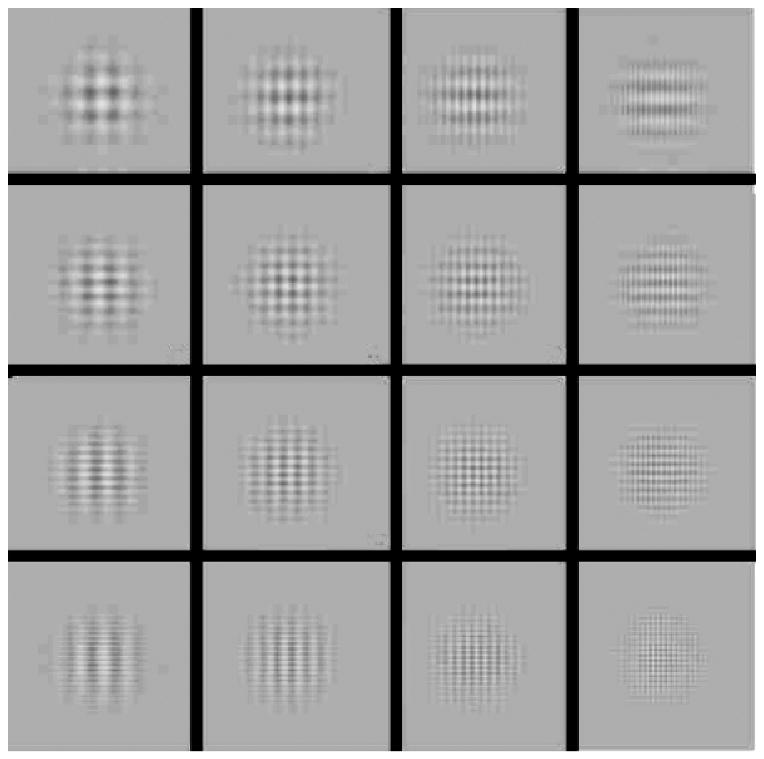
Schematic illustrating the 16 two-dimensional sinusoidal gratings in the grating stimulus pool. Stimuli are not presented to scale and contrast is increased for display purposes.
Stimuli were presented on a computer monitor positioned approximately 57 cm from the participant. The approximate visual angle subsumed by the letter, word, object, and grating stimuli was 5°; it was 10° for the spatial stimuli. Example stimuli from each pool are displayed in Figure 2.
Figure 2.
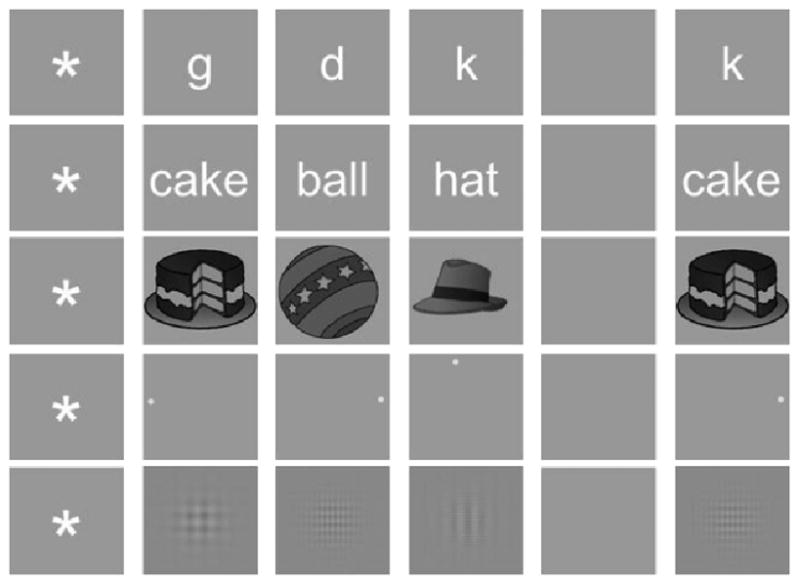
Schematic illustrating one trial from each stimulus pool. On any given trial, subjects were first shown a fixation marker, followed by three study items, a retention period, and a probe. Subjects were instructed to respond “yes” to an old item (a probe that matches one of the three study items) and “no” to a new item (a probe that does not match any of the study items). Note that images are not shown to scale.
Procedure
Participants indicated that they were ready to begin each trial with a key press. After the key press, a blank screen was presented for 400 ms, followed by a fixation cue that remained on screen for 1000 ± 200 ms. This fixation cue was followed by a set of three study stimuli and eventually a test probe. On a given trial, all stimuli were drawn from the same pool of items. Each study stimulus appeared on the screen for 700 ms. A blank screen lasting 275 ± 75 ms followed after the offset of the first and second study stimuli. After the offset of the third study stimulus, there was a blank screen lasting for 500 ± 75 ms. Participants were instructed to remember the contents of the study set during this retention interval. Finally, the probe stimulus was presented for 750 ms. Participants were instructed to determined as quickly and accurately as possible whether the probe stimulus had been among the study list or not. They were instructed to respond to an old item (one that had appeared in the study set) by pressing a key with their right index finger and to respond to a new item (one that had not appeared in the study set) by pressing a key with their left index finger. The participants initiated the next trial by pressing a key. The minimum interval between trials was 1500 ms. Figure 2 presents examples of items that might be presented on a trial with each stimulus pool. Feedback on accuracy and response time was given after a block of 30 trials.
Each participant completed five experimental sessions, and each experimental session consisted of 10 blocks of 30 trials, with 2 blocks drawn from each of the five stimulus pools. Each block comprised items from only one stimulus pool and an equal number of trials with old and new probes (15 trials each). In addition, each block contained an equal number of old probes appearing in the first, second, or third serial position in the study set. The resulting parametric design had a total of 1500 trials per participant, with 300 trials per stimulus type per participant, 150 old trials (50 from each serial position) and 150 new trials. Within any block, trials were constrained in several ways. First, stimuli presented in a given trial could not have appeared in either of the two preceding trials. Second, a study item could appear as a new probe only once per block. Finally, the sequence of old and new trials within a block was randomized.
Electroencephalographic (EEG) Recording
During EEG recording, participants were instructed to remain silent and to minimize all body and eye movements, particularly blinks. Participants were also encouraged to take as many breaks between self-paced trials as they needed to maintain concentration and optimize performance.
Recordings were obtained from 60 tin electrodes located in standard electrode positions embedded in an elastic cap (ElectroCap). EEG signals were amplified 10,000 times (Sensorium EPA6) with band limits between 0.03 and 50 Hz (12 dB/octave). Analog-to-digital signal conversion was implemented with a 12-bit data acquisition card (National Instrument PCI-6071E) with ± 5 V dynamic range. The overall system resolution was therefore 0.24 μV/bit. Digitization rate was set at 256 Hz. Amplified signals were then digitally notch-filtered to remove 60-Hz line noise.
Electrode impedances were brought to<50 kΩ, and interelectrode impedances were within 20 kΩ; skin impedances (ground and reference) were kept below 10 kΩ. All EEG signals were recorded referentially using the right mastoid. EEG signals were digitally re-referenced to the average EEG signal recorded from all electrically sound electrodes. On any given session, no more than 5% of all electrodes had poor electrical contact and/or high impedances.
Six electrodes were used to monitor electrooculogram (EOG) activity. Vertical eye movements were isolated with electrodes positioned above and below each eye. Horizontal eye movements were isolated with electrodes placed at the lateral canthus of each eye. Each pair of EOGs was recorded bipolarly. Raw signals from EOG were used for automatic eye movements and blink detection following Net Station's weighted running-average algorithm (EGI, 2004). If any one pair of EOG exceeded the combined rejection threshold of ± 100 μV, the event (i.e., the particular stimulus presentation) that corresponded to the EOG spike was excluded from analysis. Fewer than 6% of all trials were excluded.
Event-Related Potential Analysis
Probe-locked ERPs were calculated for correct trials with response times between 200 and 1300 ms. The ERP epoch ran from 0 to 1000 ms and ERPs were low–pass filtered at 40 Hz. To account for subject-to-subject signal uctuation, Z–transformed ERPs were calculated for each subject, stimulus type, probe type, and electrode, following
| 3 |
where j denotes the trial, t denotes the time across the epoch of the ERP, V denotes voltage (μV) μj denotes the mean over time for trial j, and σ denotes the standard deviation across trials and time. It is worth noting that μ is calculated over trials whereas σ is calculated over trials and time. This way, the variance across both time and trials is accounted for, but the resulting ERP maintains its characteristic shape over time. The Z-transformation included a baseline correction to the first time point of the ERP.
To account for multiple comparisons across electrodes and deviations from normality in our statistical analyses, we used a nonparametric resampling procedure for matched pairs (Howell, 2002). Essentially, this involved shuffling across electrodes and all factors in the statistical test (i.e., probe type and stimulus type). In an Old–New contrast, each resampling consisted of swapping the sign of the Old–New difference for each subject with a 50% probability as well as randomly shuffling the values across electrodes, and then calculating the corresponding t statistic at each electrode for this resampling. By repeating this resampling procedure 1000 times, we were able to generate an empirical distribution of t values for each electrode against which the t value from the original data set could be compared. This yielded a nonparametric p value that served as the basis for a statistical decision. It is worth emphasizing that this empirical distribution consisted of values from all electrodes, such that across electrodes an α of p = .05 would yield .05 × 60 = 3 significant electrodes by chance. Topographic visualization was done with the EEGLAB Matlab toolbox (Delorme & Makeig, 2004).
Results
Behavioral
Average discrimination scores for each serial position and stimulus type are presented in Figure 3. For consistency with the ERP analyses, only trials with response times between 200 and 1300 ms were included in the analysis. Figure 3a shows that participants had very high discrimination scores on letter, word, and object trials, but could not discriminate as well on spatial and grating trials. There also appeared to be a recency effect, with probes from the third serial position (O3) being recognized more accurately than probes from the first (O1) and second (O2) serial positions, especially for grating trials. To confirm these observations, a 5 (stimulus type) × 3 (serial position) repeated-measures ANOVA was performed with d′ as the dependent variable. There was a significant main effect of stimulus type on discriminability, F(4,44) = 49.05, MSE = 0.16, p<.01. Bonferroni-corrected pairwise comparisons showed no difference between letters and words, t(11) = 0.65, n.s., letters and objects, t(11) = −0.18, n.s., or words and objects, t(11) = −0.47, n.s., but significant differences between these stimulus types and spatial locations, t(11) = 10.93 (letter), 12.51 (word), 9.54 (object), p <.01, and gratings, t(11) = 16.20 (letter), 15.97 (word), 16.59 (object), p<.01. There was also a significant difference between spatial locations and gratings, t(11) = 6.47, p<.01. There was a significant effect of serial position on discriminability, F(2,22) = 5.47, MSE = 0.86, p<.05. A planned contrast confirmed that O3 probes were significantly more discriminable than O1 probes, F(1,11) = 7.58, MSE = 0.24, p<.05, and O2 probes, F(1,11) = 8.14, MSE = 0.28, p<.05. Furthermore, stimulus type significantly interacted with serial position, F(8,88) = 104.93, MSE = 0.15, p<.01. To establish which stimulus types showed significant recency effects, we performed Bonferroni-corrected t tests comparing O1 and O3 probes for each stimulus type. Letters, t = −3.08, p<.05, words, t = −3.78, p<.05, objects, t = −5.05, p<.01, and gratings, t = −4.34, p<.01, all showed significant recency effects in their discrimination scores, but spatial locations did not, t(11) = 0.47, n.s.
Figure 3.

The effect of stimulus type and probe type on behavior. a: The mean discrimination score is plotted for each of the three serial positions (O1, O2, O3) and each of the five stimulus types (letter, word, object, spatial, and grating). b: The mean response time for correct trials is plotted for each of the four probe types (N, O1, O2, O3) and each of the five stimulus types.
Average response times for correct trials for each probe type and serial position, along with new items, are presented in Figure 3b. Again, only trials with response times between 200 and 1300 ms were included to match with the ERP analyses. There was a clear recency effect for response time for all stimulus types, with O3 being answered faster than O1, O2, and new items (N). In addition, response time appeared to be the same for letter, word, object, and spatial trials, but substantially longer for grating trials. To confirm these observations, a 5 (stimulus type) × 3 (serial position) repeated-measures ANOVA was performed with response time as the dependent variable. There was a significant main effect of stimulus type on response time, F(4,44) = 49.81, p<.01. Bonferroni-corrected pairwise comparisons showed no difference between letters and words, t(11) = − 2.99, n.s., letters and objects, t(11) = −2.26, n.s., letters and spatial locations, t(11) = −2.11, n.s., words and objects, t(11) = −0.27, n.s., words and spatial locations, t(11) = −0.92, n.s., or objects and spatial locations, t(11) = − 0.71, n.s. There were significant differences between these four stimulus types and gratings, t(11) = − 11.63 (letter), − 11.43 (word), − 9.67 (object), − 9.05 (spatial location), p<.01. There was a significant main effect of serial position on response time, F(2,22) = 43.99, p<.01. A planned contrast confirmed that O3 probes elicited faster responses than either O1 probes, F(1,11) = 43.07, MSE = 8625.08, p<.01, or O2 probes, F(1,11) = 53.92, MSE = 6498.81, p<.01. In addition, there was a significant interaction between stimulus type and serial position for response time, F(8,88) = 4.00, p<.01. To establish which stimulus types showed significant recency effects for response time, we performed Bonferroni-corrected t tests comparing O1 and O3 probes for each stimulus types. Letters, t = 5.04, p<.01, words, t = 7.53, p<.01, objects, t = 10.68, p<.01, and gratings, t = 3.41, p<.05, all showed significant recency effects in their response times, but spatial locations did not, t(11) = 1.86, n.s.
Event-Related Potential
To investigate the effect of recognition on the probe ERP, items that were previously presented in the study list (O = old items) and items that were not presented in the study list (N = new items) were compared during the two canonical components that have been identified with the ERP Old–New effect: the FN400 (350–450 ms) and the LPC (500–700 ms). Letter, word, and object probe ERPs were averaged to obtain a “verbal probe ERP.” This aggregation was motivated by a theoretical interest in the commonalities among these stimulus types (i.e., their verbalizability). Using EEG oscillatory activity as their measure, Hwang et al. (2005) demonstrated the same commonalities among stimuli that could be verbally rehearsed. The decision to aggregate the verbal stimuli was also justified on empirical grounds, by the parallels in the behavioral data (no significant differences among these three stimulus types), and by the topography of the Old–New effect across stimulus types. The small topographic plots in Figures 4a and 5a show that the topographies of the Old–New effects across these stimulus types largely overlapped and did not differ significantly from each other at the electrodes encompassing these effects.
Figure 4.
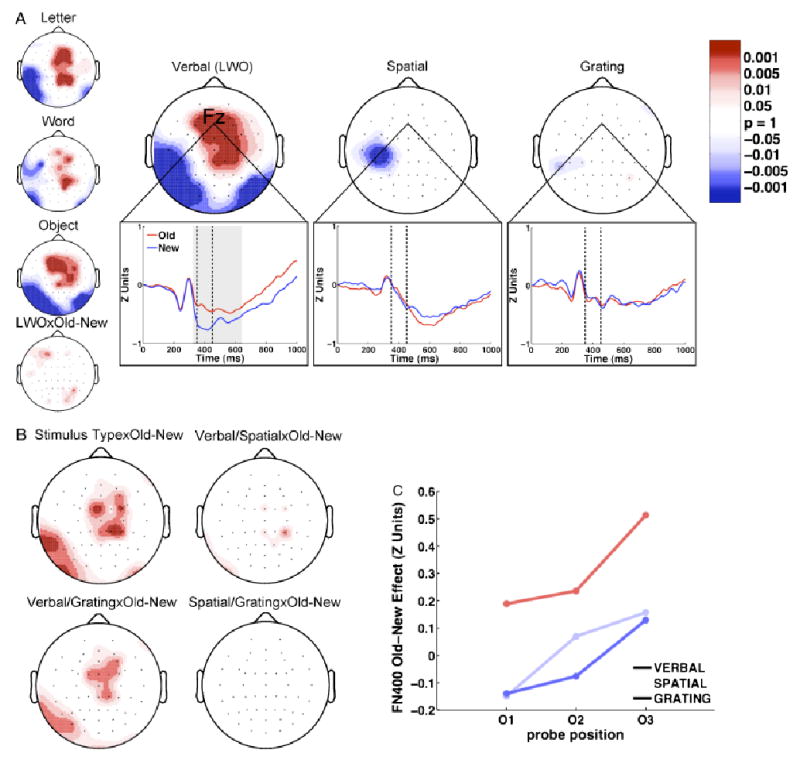
The ERP Old–New (O/N) effect: FN400 (350–450 ms). a: Large topoplots display the FN400 Old–New effect for verbal, spatial, and grating stimuli (red: O>N; blue: N>O). Small topoplots display the effects for the letter, word, and object stimuli, which are averaged to obtain the verbal plot, as well as the interaction between verbal stimulus type (LWO) and Old–New. The bottom plots are representative waveforms drawn from electrode Fz for O (red) and N (blue) probes. Dashed vertical lines represent the time period analyzed in the topographic plots. Gray shading indicates periods of significant Old–New effects. b: The topography of the interaction between stimulus type and Old–New, along with topography of the pairwise comparisons across stimulus types. c: The mean amplitude of the FN400 Old–New effect is plotted for each stimulus type and serial position at electrode Fz.
Figure 5.
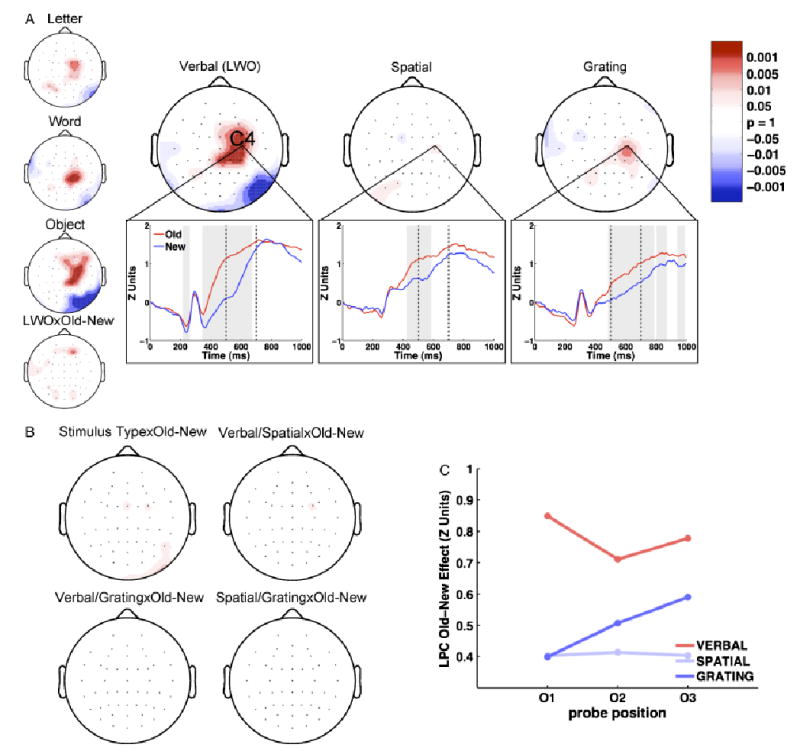
The ERP Old–New (O/N) effect: LPC (500–700 ms). a: Large topoplots display the LPC Old–New effect for verbal, spatial, and grating stimuli (red: O>N; blue: N>O). Small topoplots display the effects for the letter, word, and object stimuli, which are averaged to obtain the verbal plot, as well as the interaction between verbal stimulus type (LWO) and Old–New. The bottom plots are representative waveforms drawn from electrode C4 for O (red) and N (blue) probes. Dashed vertical lines represent the time period analyzed in the topographic plots. Gray shading indicates periods of significant Old–New effects. b: The topography of the interaction between stimulus type and Old–New, along with topography of the pairwise comparisons across stimulus types. c: The mean amplitude of the LPC Old–New effect is plotted for each stimulus type and serial position at electrode C4.
FN400 (350–450 ms). To visualize the topography of the FN400 component of the ERP Old–New effect separately for each stimulus type, we performed a resampled paired t test comparing O and N ERPs for each stimulus type and electrode. The p values from the t tests are displayed topographically in Figure 4a for verbal, spatial, and grating ERPs. Grand average waveforms from a representative electrode (Fz) are also displayed in Figure 4a for each of the stimulus types. The topography for verbal stimuli is representative of the canonical FN400 Old–New effect, with O ERPs being more positive at frontal recording sites and N ERPs being more positive in more posterior regions (Curran, 2000). In contrast, the corresponding Old–New significance plots for spatial and grating stimuli show no areas where O ERPs are more positive than N ERPs and show only scattered significance in the opposite direction. These results suggest that the FN400 Old–New effect occurs for verbal stimuli, but not for spatial or grating stimuli. To determine whether the variation in the FN400 Old–New effect across stimulus types comprised a significant interaction, a 3 (stimulus type) × 2 (Old–New resampled) repeated-measured ANOVA was performed at each electrode. A significant interaction would indicate that the size of the FN400 Old–New effect varies across stimulus types and would confirm the differences observed in Figure 4a. The p values for the interaction term from the ANOVAs are presented topographically in Figure 4b. It can be seen that there was a significant interaction between stimulus type and probe type at frontocentral locations overlapping with the FN400 Old–New effect, suggesting that O and N ERPs were different during this period for some stimulus types (i.e., verbal), but not others (i.e., spatial and grating). Bonferroni-corrected pairwise comparison plots displayed in Figure 4b confirm that this interaction is driven by the difference between verbal Old–New effects and spatial or grating Old–New effects.
To better characterize the relation between the FN400 Old–New effect and recency, we investigated how the FN400 Old–New effect varied with serial position. If this effect were indicative of recency, its amplitude should increase monotonically with serial position, mirroring the recency effect seen in the behavioral data. The FN400 Old–New difference at electrode Fz for each of the three serial positions (O1, O2, and O3) and stimulus types (verbal, spatial, and grating) is shown in Figure 4c. During the FN400 time window, the Old–New effect associated with all three stimulus types tended to increase with serial position. To test whether the trend in serial position was significant, a 3 (stimulus type) × 3 (serial position) repeated-measures ANOVA was performed at electrode Fz with Old–New difference as the dependent measure. There was a significant main effect of serial position on the amplitude of the FN400 Old–New effect, F(2,22) = 15.19, MSE = 0.06, p<.01. Consistent with our previous observations, there was a main effect of stimulus type on the FN400 Old–New effect, F(2,22) = 7.53, MSE = 0.16, p<.01. Stimulus type did not interact significantly with serial position, F(4,44) = 0.64, MSE = 0.06, n.s. This suggests that ERPs elicited by all three stimulus types show similar recency effects, with more recent stimuli exhibiting more positive FN400 waves. It is worth noting that the spatial and grating stimulus types show recency effects, but not Old–New effects. So, although the FN400 does not distinguish old and new items for spatial and grating stimuli, the FN400 is indicative of recency.
LPC (500-700 ms). To visualize the topography of the late positive component of the Old–New effect separately for each stimulus type, we did a resampled paired t test, comparing O and N ERPs for each stimulus type and electrode. Figure 5a shows the topographic significance plots for the Old–New effect during the LPC time window for verbal, spatial, and grating ERPs. Grand average waveforms from a representative electrode (C4) are also shown in Figure 5a for each of the stimulus types. O ERPs are more positive than N ERPs at centroparietal regions for verbal items, and this effect is lateralized to the right. Relative to the effect for verbal stimuli, the effect for grating stimuli is topographically more constrained and more lateralized to the right. The effect is particularly small for spatial stimuli, but an effect at electrode C4 is apparent for all stimulus types. Moreover, the spatial waveform shows that an effect is present at electrode C4 and that the effect may occur earlier than for verbal and grating stimuli. This might account for the lack of significance during the epoch of interest.
As with the FN400, we performed a 3 (stimulus type) × 2 (Old–New resampled) repeated-measured ANOVA at each electrode to determine whether the difference in the LPC Old–New effect across stimulus types comprised a significant interaction. The significance of this interaction is presented topographically in Figure 5b. There it can be seen that, although there is some significance in frontal locations, overall there is no interaction between stimulus type and probe type at centroparietal locations comprising the LPC. This suggests that although spatial and grating stimuli appear to evoke a weaker LPC Old–New effect than verbal stimuli, this does not constitute a significant difference. This means the amplitude of the LPC Old–New effect does not differ statistically across stimulus types. Bonferroni-corrected pairwise comparison plots displayed in Figure 5b confirm that there is no difference in the LPC Old–New effect between stimulus types.
Next we decided to explore the possibility that, like the FN400, the LPC is indicative of recency. We did this by exploring the effect of serial position on the LPC. The late positive Old–New effect at electrode C4 for each of the three serial positions (O1, O2, and O3) and stimulus types (verbal, spatial, and grating) is shown in Figure 5c. Although a monotonic increase in LPC at electrode C4 with serial position is apparent for grating stimuli, it can be seen that overall this effect did not increase in amplitude as serial position increased. A 3 (stimulus type) × 3 (serial position) repeated ANOVA showed no significant main effect of serial position on the LPC Old–New effect, F(2,22) = 0.18, MSE = 0.13, n.s. Consistent with our previous observations, there was no main effect of stimulus type on the LPC Old–New effect, F(2,22) = 2.31, MSE = 0.59, n.s. Furthermore, serial position did not interact significantly with stimulus type, F(4,44) = 0.60, MSE = 0.12, n.s., demonstrating that the pattern for grating stimuli did not differ significantly from those for verbal and spatial stimuli. This indicates that, although the LPC differentiates old from new stimuli across a variety of stimulus types, it fails to differentiate old items based on their recency. That the FN400 shows a recency effect and the LPC does not is supported statistically by an interaction between serial position and component, F(2,22) = 3.84, MSE = 0.08, p<.05.
Discussion
Our study explored ERP correlates of recognition memory during a short-term memory task (Sternberg, 1966). We focused on the FN400 and the LPC, two components of the ERP that have been implicated in recognition memory (for reviews, see Johnson, 1995; Rugg, 1995). The FN400 and LPC together comprise what is commonly referred to as the ERP Old–New effect, an effect whereby stimuli correctly identified as old elicit more positive-going ERPs than stimuli correctly identified as new. Although this effect has been best characterized in long-term memory paradigms, it is not unusual for these two components to be explored in short-term memory tasks similar to the one we employed here (e.g., Crites et al., 1998, 2000). Justification for dividing the effect into two components comes from evidence that the two components are associated with different psychological processes in long-term memory (Curran, 2000; Smith, 1993) and have distinct topographies at the scalp (Curran, 2000). We were motivated to explore these components of the ERP Old–New effect in the context of a short-term memory paradigm and to characterize their behavior along several dimensions, including stimulus type and recency. Consistent with findings in long-term memory paradigms, we found that the FN400 and LPC responded differentially to task manipulations.
The FN400 Old–New Effect
We found that the FN400 distinguished old from new items for verbal stimuli, but not for spatial and grating stimuli (Figure 4a). This is consistent with the proposition that the FN400 Old–New effect is restricted to stimuli whose retrieval involves unitization (Mecklinger, 1998; Rugg & Doyle, 1994). Unitization is the process by which a stimulus' attributes or associates are integrated into a single conceptual unit and would promote ease of categorization and verbalization. In contrast with those three stimulus types, our spatial position and grating stimuli, which were designed to thwart categorization and verbalization, seem not to distinguish the FN400 component from old and new stimuli.
In addition, the FN400 showed a dependence on serial position that was consistent with the dependence seen in our behavioral data, with more recent stimuli being better remembered and eliciting more positive-going FN400s (Figure 4c). The idea that better remembered stimuli exhibit more positive-going FN400s is consistent with previous findings associating the FN400 with memory strength in studies of long-term (Finnigan, Humphreys, Dennis, & Geffen, 2002) and short-term (Crites et al., 2000) memory. For verbal items, the amplitude of the FN400 fits nicely onto a continuum of memory strength, with new items showing the most negative FN400, followed by items that have been seen more and more recently. In contrast, whereas spatial and grating stimuli show the same graded recency effect, there is no difference apparent between old items and items that are new. It is interesting that spatial stimuli show a recency effect in the FN400 component but not the behavioral data, suggesting that there is some other process at work contributing to the behavioral outcome.
In studies of long-term memory, accumulating evidence suggests that the FN400 may be an index of familiarity (Curran, 2000, 2004; Curran & Cleary, 2003; Curran et al., 2002; Diana et al., 2006; Duzel et al., 1997). In dual-process models of recognition memory, familiarity is conceptualized as a feeling of knowing in absence of source information (for a review, see Yonelinas, 2002). This offers a novel perspective on our FN400 findings. When a dual process perspective is adopted, the recency effect can be conceptualized as being associated with the amount of familiarity evoked by a given item. This is consistent with findings that familiarity is a graded process that decreases rapidly with time (Yonelinas, 2002), with more recent items evoking stronger feelings of familiarity than less recent items.
The dual-process perspective may also shed light on the differences in the FN400 Old–New effect across our stimulus types. The lack of an FN400 Old–New effect in spatial and grating stimuli suggests that with such stimuli, participants tended to confuse new items with old items, as we expected when we made our stimulus choices. This possibility is bolstered by the relatively poor behavioral performance in these two tasks, in terms of both discrimination and response time (Figure 3). This interpretation is consistent with findings that the FN400 Old–New effect is attenuated when new items' similarity to old items is increased (Curran, 2000; Curran & Cleary, 2003). This suggests that, although familiarity may help participants make their Old–New decision for verbal or other stimuli that can be unitized, it may be less helpful for grating and spatial stimuli, in which perceptual similarity between old and new items reduces performance. This points to an avenue of theoretically valuable, new research. By strategically manipulating the similarity between new items and the items in the study set, one would expect familiarity (and the amplitude of the FN400) to increase monotonically as a function of similarity. Furthermore, one would expect to see an FN400 Old–New effect when looking at new items that are very dissimilar from the items in the study set. This could be done with stimuli similar to the gratings adopted in the current study or, alternatively, with auditory analogs to gratings (Visscher et al., 2007). Another possibility is that spatial and grating stimuli are more difficult to rehearse verbally than the other stimuli (Hwang et al., 2005), thus making studied stimuli less familiar.
The LPC Old–New Effect
Figure 5a shows that across a range of stimulus types, particularly verbal and grating stimuli, the LPC distinguished old and new items. Substantial evidence suggests that the LPC represents recollection, the part of recognition that dual-process theorists claim involves remembering source information like episodic details (Curran, 2000; Duzel et al., 1997; Smith, 1993). In agreement with studies by Mecklinger and colleagues (Bosch, Mecklinger, & Friederici, 2001; Mecklinger, 1998, 2000), we found that, unlike the FN400, the late positive component of the ERP Old–New effect is associated with a variety of different stimulus types. Whereas Mecklinger demonstrated this for object and location stimuli, we have demonstrated that the effect occurs across a broader range of stimulus types, including letters, words, objects, spatial locations, and sinusoidal gratings.
Although the LPC Old–New effect did not differ significantly across stimulus types, the differences apparent in Figure 5a warrant some discussion. The spatial stimuli show a weak effect only at one electrode, whereas verbal and grating stimuli show stronger effects across a broader range of electrodes. The smaller effects for spatial and grating stimuli are consistent with findings that abstract stimuli are difficult to recollect (Reder et al., 2006), but the lack of a significant interaction between the LPC Old–New effect and stimulus type (Figure 5b) precludes strong assertions on this front. Spatial stimuli are more difficult to encode or recollect, but the fact that behavioral performance was significantly better for spatial stimuli than grating stimuli suggests that some other process (e.g., visuospatial working memory) may be enhancing recognition of the spatial stimuli.
Conclusions
We found that during a short-term memory task the FN400 and late positive components of the ERP Old–New effect respond very differently to study manipulations. These results illuminate how the processes reflected in these components may contribute to the recognition of different kinds of stimuli. The process reflected by the FN400 appears to contribute to recognition of our verbal stimuli more so than our spatial and grating stimuli. The process reflected by the LPC appears to reflect a more general recognition process. Furthermore, the FN400 but not the LPC increased as a function of recency. These results are consistent with the correspondence, seen in the literature on long-term memory, between the FN400 component and the graded process of familiarity, on one hand, and the LPC and the threshold process of recollection, on the other hand. It is particularly interesting that these two ERP components, which have been much studied and differentiated in the context of long-term memory, produce parallel patterns of results in a short-term recognition task. These parallels support the assertion that some of the same cognitive processes may underlie short- and long-term recognition.
Acknowledgments
Support was provided by NIH grants MH068404 and MH61975.
Footnotes
It has been argued that face recognition is unique (McKone & Kanwisher, 2005). So although face recognition is theoretically very interesting, it may be inherently different from recognition of other kinds of nonverbal stimuli.
References
- Beisteiner R, Hutler D, Edward V, Koch G, Franzeb P, Egkher A, et al. Brain potentials with old/new distinction of nonwords and geometric figures. Electroencephalography & Clinical Neurophysiology. 1996;99:517–526. doi: 10.1016/s0013-4694(96)94737-9. [DOI] [PubMed] [Google Scholar]
- Bosch V, Mecklinger A, Friederici AD. Slow cortical potentials during retention of object, spatial, and verbal information. Cognitive Brain Research. 2001;10:219–237. doi: 10.1016/s0926-6410(00)00040-9. [DOI] [PubMed] [Google Scholar]
- Crites SL, Delgado P, Devine JV, Lozano DI. Immediate and delayed stimulus repetitions evoke different ERPs in a serial-probe recognition task. Psychophysiology. 2000;37:850–858. [PubMed] [Google Scholar]
- Crites SL, Devine JV, Lozano DI, Moreno S. Event-related potentials and serial position effects in a visual probe recognition task. Psychophysiology. 1998;37:850–858. doi: 10.1017/s0048577298970457. [DOI] [PubMed] [Google Scholar]
- Curran T. Brain potentials of recollection and familiarity. Memory & Cognition. 2000;28:923–938. doi: 10.3758/bf03209340. [DOI] [PubMed] [Google Scholar]
- Curran T. Effect of attention and confidence on the hypothesized ERP correlates of recollection and familiarity. Neuropsychologia. 2004;42:1088–1106. doi: 10.1016/j.neuropsychologia.2003.12.011. [DOI] [PubMed] [Google Scholar]
- Curran T, Cleary AM. Using ERPs to dissociate recollection and familiarity in picture recognition. Cognitive Brain Research. 2003;15:191–205. doi: 10.1016/s0926-6410(02)00192-1. [DOI] [PubMed] [Google Scholar]
- Curran T, Tanaka JW, Weiskopf DM. An electrophysiological comparison of visual categorization and recognition memory. Cognitive, Affective, & Behavioral Neuroscience. 2002;28:1–18. doi: 10.3758/cabn.2.1.1. [DOI] [PubMed] [Google Scholar]
- Deese J. On the prediction of occurrence of particular verbal intrusions in immediate recall. Journal of Experimental Psychology. 1959;58:17–22. doi: 10.1037/h0046671. [DOI] [PubMed] [Google Scholar]
- Delorme A, Makeig S. EEGLAB: An open source toolbox for analysis of single-trial EEG dynamics. Journal of Neuroscience Methods. 2004;134:9–21. doi: 10.1016/j.jneumeth.2003.10.009. [DOI] [PubMed] [Google Scholar]
- Diana RA, Vilberg KL, Reder LM. Identifying the ERP correlate of a recognition memory search attempt. Cognitive Brain Research. 2006;24:674–684. doi: 10.1016/j.cogbrainres.2005.04.001. [DOI] [PMC free article] [PubMed] [Google Scholar]
- Duzel E, Yonelinas AP, Mangun GR, Heinze H, Tulving E. Event-related brain potential correlates of two states of conscious awareness in memory. Proceedings of the National Academy of Sciences, USA. 1997;94:5973–5978. doi: 10.1073/pnas.94.11.5973. [DOI] [PMC free article] [PubMed] [Google Scholar]
- EGI. Net station waveform tools technical manual S-MAN-200-WFTR-001 (Tech Rep) Eugene, OR: Electrical Geodesies, Inc.; 2004. [Google Scholar]
- Finnigan S, Humphreys MS, Dennis S, Geffen G. ERP ‘old/new’ effects: Memory strength and decisional factor(s) Neuropsychologia. 2002;40:2288–2304. doi: 10.1016/s0028-3932(02)00113-6. [DOI] [PubMed] [Google Scholar]
- Hintzman DL. Judgments of frequency and recognition memory in a multiple-trace memory mode. Psychological Review. 1988;95:528–551. [Google Scholar]
- Howell DC. Statistical methods in psychology. Pacific Grove, CA: Duxbury Thomas Learning; 2002. [Google Scholar]
- Hwang G, Jacobs J, Geller A, Danker J, Sekuler R, Kahana M. EEG correlates of verbal and nonverbal working memory. Behavioral and Brain Functions. 2005;1(20):1–13. doi: 10.1186/1744-9081-1-20. [DOI] [PMC free article] [PubMed] [Google Scholar]
- Johnson R. Event-related potential insights into the neurobiology of memory systems. In: Boller F, Grafman J, editors. Handbook of neuropsychology. Vol. 10. New York: Elsevier; 1995. pp. 135–163. [Google Scholar]
- Jonides J, Smith EE, Koeppe RA, Awh E, Minoshima S, Mintun MA. Spatial working memory in humans as revealed by PET. Nature. 1993;363:623–625. doi: 10.1038/363623a0. [DOI] [PubMed] [Google Scholar]
- Kahana MJ, Sekuler R. Recognizing spatial patterns: A noisy exemplar approach. Vision Research. 2002;42:2177–2192. doi: 10.1016/s0042-6989(02)00118-9. [DOI] [PubMed] [Google Scholar]
- Kahana MJ, Zhou F, Geller A, Sekuler R. Lure-similarity affects visual episodic recognition: Detailed tests of a noisy exemplar model. Memory & Cognition. 2007;35:1222–1232. doi: 10.3758/bf03193596. [DOI] [PMC free article] [PubMed] [Google Scholar]
- McElree B, Dosher B. Serial position and set size in short-term memory: The time course of recognition. Journal of Experimental Psychology: General. 1989;118:346–373. [Google Scholar]
- McKone E, Kanwisher N. Does the human brain process objects of expertise like faces? A review of the evidence. In: Dehaene S, Duhamel J, Hauser M, Rizzolatti G, editors. From monkey brain to human brain. Cambridge, MA: MIT Press; 2005. [Google Scholar]
- Mecklinger A. On the modularity of recognition memory for object form and spatial location: A topographic ERP analysis. Neuropsychologia. 1998;36:441–460. doi: 10.1016/s0028-3932(97)00128-0. [DOI] [PubMed] [Google Scholar]
- Mecklinger A. Interfacing mind and brain: A neurocognitive model of recognition memory. Psychophysiology. 2000;37:565–582. [PubMed] [Google Scholar]
- Nessler D, Mecklinger A, Penney T. Perceptual fluency, semantic familiarity and recognition-related familiarity: An electrophysiological exploration. Cognitive Brain Research. 2005;22:265–288. doi: 10.1016/j.cogbrainres.2004.03.023. [DOI] [PubMed] [Google Scholar]
- Olsson H, Poom L. Visual memory needs categories. Proceedings of the National Academy of Sciences, USA. 2005;102:8776–8780. doi: 10.1073/pnas.0500810102. [DOI] [PMC free article] [PubMed] [Google Scholar]
- Pelli D. The videotoolbox software for visual psychophysics: Transforming numbers into movies. Spatial Vision. 1997;10:437–442. [PubMed] [Google Scholar]
- Reder L, Oates J, Thornton E, Quinlan J, Kauder A, Sauer J. Drug-induced amnesia hurts recognition, but only for memories that can be unitized. Psychological Science. 2006;17:562–567. doi: 10.1111/j.1467-9280.2006.01744.x. [DOI] [PMC free article] [PubMed] [Google Scholar]
- Roediger HL, McDermott KB. Creating false memories: Remembering words not presented in lists. Journal of Experimental Psychology: Learning, Memory and Cognition. 1995;21:803–814. [Google Scholar]
- Rugg MD. ERP studies of memory. In: Rugg MD, Coles MGH, editors. Electrophysiology of mind: Event-related brain potentials and cognition. New York: Oxford University Press; 1995. pp. 132–170. [Google Scholar]
- Rugg MD, Doyle MC. Event-related potentials and stimulus repetition in direct and indirect tests of memory. In: Heinze HJ, Munte T, Mangun GR, editors. Cognitive electrophysiology. Boston: Birkhauser; 1994. pp. 124–148. [Google Scholar]
- Rugg MD, Nagy ME. Event-related potentials and recognition memory for words. Electroencephalography & Clinical Neurophysiology. 1989;72:395–406. doi: 10.1016/0013-4694(89)90045-x. [DOI] [PubMed] [Google Scholar]
- Smith ME. Neurophysiological manifestations of recollective experience during recognition memory judgments. Journal of Cognitive Neuroscience. 1993;5:1–13. doi: 10.1162/jocn.1993.5.1.1. [DOI] [PubMed] [Google Scholar]
- Snodgrass J, Vanderwart M. A standardized set of 260 pictures: Norms for name agreement, image agreement, familiarity, and visual complexity. Journal of Experimental Psychology: Human Learning and Memory. 1980;6:174–215. doi: 10.1037//0278-7393.6.2.174. [DOI] [PubMed] [Google Scholar]
- Sternberg S. High-speed scanning in human memory. Science. 1966;153:652–654. doi: 10.1126/science.153.3736.652. [DOI] [PubMed] [Google Scholar]
- Thomas S. Unpublished doctoral dissertation. University of St. Andrews; 1992. Visual processing of pictorial and facial images in human and monkey. [Google Scholar]
- Visscher KM, Kaplan E, Kahana MJ, Sekuler R. Auditory short-term memory behaves like visual short-term memory. Public Library of Science - Biology. 2007;5(3):e56. doi: 10.1371/journal.pbio.0050056. [DOI] [PMC free article] [PubMed] [Google Scholar]
- Yonelinas AP. The nature of recollection and familiarity: A review of 30 years of research. Journal of Memory and Language. 2002;46:441–517. [Google Scholar]
- Zhou F, Kahana MJ, Sekuler R. Short-term episodic memory for visual textures: A roving probe gathers some memory. Psychological Science. 2004;15:112–118. doi: 10.1111/j.0963-7214.2004.01502007.x. [DOI] [PubMed] [Google Scholar]