

Abstract
Resistance to TGF-β is frequently observed in ovarian cancer, and disrupted TGF-β/SMAD4 signaling results in aberrant expression of downstream target genes in the disease. Our previous study showed that ADAM19, a SMAD4 target gene, is down-regulated through epigenetic mechanisms in ovarian cancer with aberrant TGF-β/SMAD4 signaling. In this study, we investigated the mechanism of down-regulation of FBXO32, another SMAD4 target gene, and the clinical significance of loss of FBXO32 expression in ovarian cancer. Expression of FBXO32 was observed in normal ovarian surface epithelium but not in ovarian cancer cell lines. FBXO32 methylation was seen in ovarian cancer cell lines displaying constitutive TGF-β/SMAD4 signaling, and epigenetic drug treatment restored FBXO32 expression in ovarian cancer cell lines regardless of FBXO32 methylation status, suggesting that epigenetic regulation of this gene in ovarian cancer may be a common event. In advanced stage ovarian tumors, significant (29.3%; P<0.05) methylation frequency of FBXO32 was observed and the association between FBXO32 methylation and shorter progression-free survival was significant, as determined by both Kaplan-Meier analysis (P<0.05) and multivariate Cox regression analysis (hazard ratio 1.003, P<0.05). Re-expression of FBXO32 markedly reduced proliferation of a platinum-resistant ovarian cancer line both in vitro and in vivo, due to increased apoptosis of the cells, and resensitized ovarian cancer cells to cisplatin. In conclusion, the novel tumor suppressor FBXO32 is epigenetically silenced in ovarian cancer cell lines with disrupted TGF-β/SMAD4 signaling and FBXO32 methylation status predicts survival in patients with ovarian cancer.
Keywords: Ovarian cancer, epigenetics, TGF-β, FBXO32
Introduction
Ovarian cancer is the fifth leading cause of death in women and the most deadly of the gynecological malignancies.1 The lifetime risk of ovarian cancer in women is ~ 1.5%.2 As ovarian cancer has few symptoms early in its course, the majority of patients are diagnosed with advanced-stage disease. Despite advances in chemotherapy, the poor prognosis for ovarian cancer patients is reflected in the <20% 5-year survival rate after initial diagnosis for patients with stage III and IV disease, whereas survival of patients with stage I or II disease is >80% for the same period.3 Current prognostic indicators using clinicopathological variables, including stage and grade, neither accurately predict clinical outcomes nor provide biological insight into the disease. Thus, a better understanding of the molecular carcinogenesis of ovarian cancer is needed for developing more reliable prognostic markers.
The transforming growth factor-β signaling pathway has an important role in controlling proliferation, differentiation and other cellular processes including the growth of ovarian surface epithelial cell (OSE).4 With each ovulation, the OSE covering the ovary undergoes rupture followed by proliferation-mediated repair. 5 The growth inhibitory effect of TGF-β on the OSE may have a key role in preventing overproliferation of OSE,5 and dysregulation of TGF-β signaling may be crucial to the development of epithelial ovarian cancer. In addition, resistance to TGF-β signaling is commonly observed in ovarian cancer,6,7 suggesting that diminished responsiveness to TGF-β is a key event. However, few studies have examined the consequences of disrupted TGF-β signaling in ovarian cancer.
Ovarian tumorigenesis is a multistep process that includes the accumulation of acquired (somatic) epigenetic changes in critical genes.8 Epigenetic alterations, including DNA methylation and histone modifications, has important roles in gene regulation, 9–11 and we along with others12–16 have previously shown that tumor suppressor genes can be transcriptionally silenced by epigenetic modifications in ovarian cancer. We have also shown that epigenetically modified genes can be used for both ovarian cancer diagnosis and prognosis.17,18
Our previous study using chromatin immunoprecipitation microarray (ChIP-Chip) identified FBXO32 as a TGF-β/SMAD target gene in OSE19. FBXO32 (also known as atrogin-1) is a member of the F-box protein family and constitutes one of the four subunits of the ubiquitin protein ligase complex.20,21 The FBXO32 protein has been reported to play a role in muscle atrophy,22 and recent findings suggest that FBXO32 is a novel apoptosis regulator23 and is negatively regulated by a pro-survival signal.24 Interestingly, Tan et al. also showed that FBXO32 was transcriptionally silenced by epigenetic mechanisms in MCF-7 breast cancer cells.23 In this study, we found that FBXO32 was down-regulated in a panel of ovarian cancer cell lines. Promoter hypermethylation of FBXO32 was observed in ovarian cancer cells showing constitutive SMAD4 nuclear translocation,15. Restoration of FBXO32 suppressed ovarian cancer cell growth in vitro and xenografts in vivo; this suppression was due to increased apoptosis. FBXO32 resensitized drug resistant ovarian cancer cells to cisplatin. Importantly, ovarian cancer patients with high FBXO32 methylation had significantly shorter progression free survival than patients with no or low methylation. These results suggest that dysregulation of TGF-β/SMAD4 signaling may lead to aberrant DNA methylation of FBXO32 in ovarian cancer. FBXO32 may be a novel tumor suppressor and the methylation status of FBXO32 may predict survival in ovarian cancer.
Materials and Methods
Patient samples
A total of 96 ovarian cancer samples were obtained from the Tri-Service General Hospital (Taipei, Taiwan) (Supplementary Table S1). Five normal OSE (NOSE) cells were acquired from patients during surgery for benign gynecological disease at the Indiana University as described previously.17,25 All studies involving human ovarian epithelial samples were approved by the Institutional Review Boards of the Tri-Service General hospital (Taiwan) and the Indiana University.
Cell culture and epigenetic treatment
Immortalized OSE (IOSE) cells were derived by transducing the catalytic subunit of human telomerase and the papilloma virus subunit E7 into primary ovarian epithelial cells, as described previously.26 Cells were maintained in a 1:1 mixture of medium 199 (Sigma, St Louis, MO) and 105 (Sigma) supplemented with 10% fetal bovine serum (FBS) (Invitrogen, Carlsbad, CA), 400 ng/ml hydrocortisone (Sigma), 10 ng/ml EGF, and 50 units/ml of penicillin/streptomycin (Invitrogen).26 Ovarian cancer celllines, namely A2780, CP70, MCP2, MCP3 were propagated with RPMI 1640 (Invitrogen) containing 10% fetal bovine serum. HeyC2 cell was cultured with DMEM containing 5% FBS, 1% NEAA, 1% Gln, and 1% HEPES. SKOV3 cell was cultured with McCoy’s 5A containing 10% FBS, 1% NEAA, 1% Gln, and 1% HEPES. For epigenetic treatment, 1 × 10⁶ cells were seeded onto 90-mm plates and treated with 5μM 5′-aza-2′-deoxycytidine (5-azaDC; Sigma, St. Louis, MO) for 72 hours or with trichostatin A (TSA, 0.5μM; Sigma) for 12 hours. For 5-azaDC treatment, media was changed and a new drug was added every 24 hr.
DNA extraction
DNA was extracted by the Tissue and Cell Genomic DNA Purification Kit (Genemark, Taiwan). DNA was eluted in 50 μL distilled water and stored at −20°C until use.
Bisulfite conversion and Combined Bisulfite Restriction Analysis (COBRA)
Genomic DNA (0.5μg) was bisulfite-modified using the EZ DNA MethylationKit (Zymo Research, Orange, CA) according to manufacturer’s protocol. For COBRA analysis, bisulphite-modified DNA was first amplified using FBXO32 specific primer followed by digested with 20 U of AciI (GGCG) or Hinp1I (GCGC) (New England Biolabs, Ipswich, MA). FBXO32 specific primers were: forward primer, 5′ATTGGTTAGTGATAGTTAAGGGGT reverse primer, 5′ GGGATAACGGTGTTTTGG, (369bp). After bisulfite-conversion of methylated original genomic sequence, multiple sites for each of these enzymes were present; however, no sites were present in the bisulfite-converted original unmethylated genomic sequence. The digested PCR products were separated by gel electrophoresis using 3% GenePure high-resolution agarose (ISC BioExpress, Kaysville, UT) and stained with ethidium bromide.
Methylation specific PCR (MSP) and real time quantitative methylation-specific PCR (qMSP)
The bisulfite-modified DNA was subjectedto methylation specific PCR (MSP) and real-time quantitative methylation-specific PCR (qMSP) as described previously.27 Primers targeting promoter region of FBXO32 were as follows: forward, 5′TTAGTTTTGCGGACGGTTC, and reverse, 5′ CGGGGCGTATTTTTTTAAGC, (187bp). For qMSP, β-actin (ACTB) or collagen (COL2A1) were used to normalize for the input DNA. A region devoid of any CpG dinucleotide, was amplified using the following primer sequences: ACTB forward primer, 5′ TGGTGATGGAGGAGGTTTAGTAAGT, and reverse primer, 5′ AACCAATAAAACCTACTCCTCCCTTAA (133 bp); COL2A1 forward primer, 5′ TCTAACAATTATAAACTCCAACCACCAA, and reverse primer, 3′ GGGAAGATGGGATAGAAGGGAATAT. The amount of methylated FBXO32, ACTB, and COL2A1 were determined by the threshold cycle number (Ct) for each sample against a standard curve generated by SssI-treated DNA-MSP cloned fragment. The percentage of FBXO32 methylation was calculated as the FBXO32: ACTB or COL2A1 ratio of a sample divided by the same ratio of SssI-treated sperm DNA (Millipore, Billerica, MA) and multiplying by 100.
RNA extraction and quantitative reverse transcription-PCR
Total RNA from cell lines was extracted using Trizol(Invitrogen) as previously described.28 In brief, 1μg of total RNA was treated with DNase I (amplificationgrade, Invitrogen) before first-strand cDNA synthesis using reverse transcriptase (Superscript II RT, Invitrogen). PCR reactionswere carried out using ABI 7500 real-time PCR system (AppliedBiosystems, Foster city, CA). FBXO32 and GAPDH cDNA were amplifiedwith the following primer sequences: FBXO32 forward, 5′AAGTCTGTGCTGGTCGGGAA, and reverse, 5′AGTGAAGGTGAGGCCTTTGAAG; GAPDH forward, 5′ CCCCTTCATTGACCTCAACTACAT, and reverse, 5′TCACCATCTTCCAGGAGCG. Relative expression of FBXO32 was calculated using comparative Ct method.
Plasmid construction and colony formation assay
The full length human FBXO32 cDNA was cloned from IOSE cells. The fragment was inserted, into the XhoI–BamHII sites of the vectors pIRES_EGFP (Promega, Madison, WI) or pcDNA3.1 (Invitrogen). The plasmid constructs were verified by sequencing. Approximately 1.5 μg of FBXO32 expression vector or empty vector were transfected into CP70 or HeyC2 cells using Transfectam Reagent (Promega) according to the manufacturer’s protocol. Twenty four hours after transfection, cells were replated in triplicate and cultured for 3 weeks in RPMI 1640 containing 10% fetal bovine serum supplemented with 400μg/ml G418 (Invitrogen, Paisley, UK). The surviving colonies were stained with 0.4% crystal violet (Sigma) in 50% methanol, and visible colonies were counted. Experiments were repeated twice and the average number of colonies from 6 plates for each plasmid was obtained.
Cell proliferation assay
Cell growth was assessed by counting cell numbers or by MTS assay, as described previously 15. In brief, for cell number counts, 5×10⁴ cells were seeded into 35-mm plate, and cell numbers were determined daily using a hemacytometer. For MTS assays, approximately 1000 cells were seeded in 96-well plates for 4 days with or without various concentrations of cisplatin (Sigma, St. Louis, MO). Cell growth was determined by using CellTiter 96 Aqueous One Solution Cell Proliferation Assay kit (Promega, Madison, WI), according to the protocol provided by the manufacture. Relative cell numbers were assessed by using a 96-well ELISA plate reader with an absorbance set at 490 nM.
Flow cytometry analysis
Cells were cultured with or without cisplatin (1μg/ml) for 24hr, collected after brief trysinization, washed with PBS, and fixed in 70% ethanol for 24hr at −20°C. Cells were then treated with 0.1mg/ml RNase, stained with 10μg/ml propidium iodide (PI; Sigma, St. Louis, MO) at 37°C for 30min and analyzed by FACScan flow cytometer (Becton Dickinson, Franklin Lakes, NJ). The percentage of apoptotic cells in sub-G1 area was analyzed using the software cell quest (Becton Dickinson). The cell cycle distribution was quantified by the software ModFit LT (Becton Dickinson).
In vivo tumorigenicity assay
A total of four, 8-week-old, athymic nude mice (BALB/cByJNarl) were obtained from National Laboratory Animal Center, Taiwan. All mice were kept under specific pathogen free conditions using a laminar airflow rack with free access to sterilized food and autoclaved water. All experiments were performed under license from Animal Experimentation Ethics Committee of the National Chung Cheng University. 1×10⁵ cells of CP70 stably transfected with pcDNA3.1/FBXO32 or empty vector were resuspended in 0.1ml of medium and Matrigel (BD Bioscience, San Jose, CA) mixture (1:1). The cell suspension was then injected subcutaneously into the flank of each mouse (day 0). Tumor size was measured daily with calipers in length (L) and width (W). Tumor volume was calculated using the formula (L × W2/2). At the end of experiment, all mice were sacrificed by cervical dislocation.
Immunohistochemistry
Paraffin-embedded tissues of the above-mentioned patient samples were retrieved from the Department of Pathology, Tri-Service General Hospitals, Taiwan. Tissue sections were dewaxed in xylene, rehydrated in alcohol, and immersed in 3% hydrogen peroxide for 10 min to suppress endogenous peroxidase activity. Antigen retrieval was performed by heating each section at 100 °C for 30 min in 0.01 mol/l sodium citrate buffer (pH 6.0). After 3×5 min rinses in phosphate-buffered saline (PBS), sections were incubated for 1 hr at room temperature with a mouse polyclonal anti-FBX32 antibody (ab67866, Abcam, Cambridge, UK) diluted 1:100 in PBS, and bound antibodies were detected with a streptavidin–biotin–peroxidase system (Dako, Glostrup, Denmark) and 3,3′-diaminobenzidine substrate-chromogen solution (Dako). Slides were counterstained with hematoxylin and examined by an experienced pathologist (T.K. Chao).
Statistical analysis
Multivariate survival analysis was determined using Cox proportional hazards model with DNA methylation levelas a continuous variable. The multivariate Cox proportional hazards model was performed to determine the independent prognostic value of DNA methylation level, stage, and age. Progression-free survival (PFS) and overall survival (OS) were assessed by Kaplan-Meieranalysis using log-rank test. Progression-free survival was defined as the duration from day of diagnosis or chemotherapy to detection of new lesions or progression of residual lesions. Overall survival was defined as the duration from day of diagnosisto death. A DNA methylation level at 30% (level of methylation in OSE cells) was used as a cutoff. It is also noted that there were 37 patients with low methylation level (< 15%) and low overall survival (< 36 months). This extreme group of patients was excluded from some analysis as specified (Fig S4). Fisher’s exact test or Mann-Whitney U test was also used to compare parameters of different groups. All statistical calculations were done using statistical package SPSS version 13.0 for windows(SPSS, Inc., Chicago, IL). P < 0.05 was considered significant.
Results
FBXO32 expression correlates with promoter methylation in ovarian cancer cell lines
On the basis of our recent ChIP-Chip experiment identifying FBXO32 as a candidate TGF-β/SMAD4 target in IOSE (Supplementary Fig. S1)19, it was of interest to examine the expression of FBXO32 in a panel of ovarian cancer cell lines (HeyC2, SKOV3, MCP3, MCP2, A2780 and CP70). Low or no expression of FBXO32 mRNA was observed in all ovarian cancer cell lines as compared to IOSE cells (Fig. 1). As a previous study demonstrated that downregulation of FBXO32 correlated with promoter hypermethylation in breast cancer MCF-7 cells,23 we examined whether FBXO32 was silenced by a similar mechanism in ovarian cancer. Combined bisulfite restriction analysis (COBRA) was first conducted to determine the methylation status of a 400-bp region of the promoter. Digestion with two different restriction enzymes consistently showed that FBXO32 was methylated in HeyC2 cells (Fig. 2A). High resolution bisulphite sequencing of 32 CpG sites revealed that HeyC2 was densely methylated in this region. About 30% of methylation was observed in IOSE cells, while the rest of the cells were essentially free of methylation (Fig. 2B).
Figure 1.
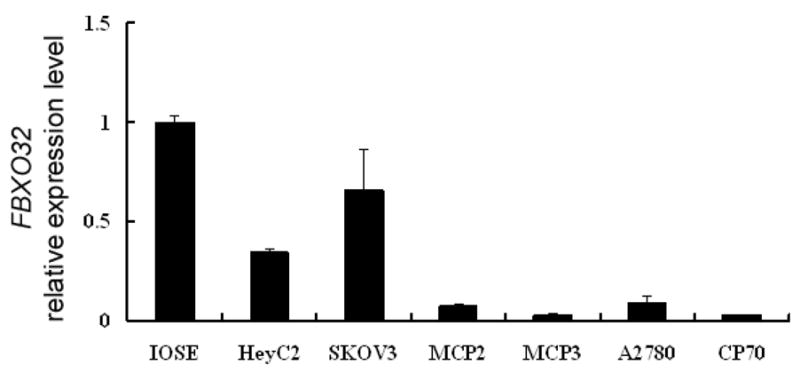
FBXO32 expression in IOSE and ovarian cancer cell line. Total RNA was isolated from ovarian cells and converted into cDNA for amplification with specific primers for FBXO32. Relative level of expression after quantitative real time RT-PCR were compared to IOSE (set as 100%). Each bar represents mean ± SD.
Figure 2.

Methylation status of FBXO32 in ovarian cell lines. (A) The methylation status of FBXO32 promoter region was analyzed by COBRA assay. Bisulphite modified DNA was PCR amplified and digested with AciI and Hinp1I. C: digested by restriction enzyme; UC: undigested control. (B) Bisulfite sequencing analysis of the FBXO32 promoter in 4 ovarian cell lines. Each vertical bar represents a CpG site in the promoter region and the methylation status of the corresponding site is indicated in the circle below. Open and filled circle represents unmethylated and methylated CpG sites respectively, and each row represents a single clone. The locations of the primers for subsequent methylation specific PCR (MSP) reaction are also indicated by arrows. (C) Quantitative real-time methylation specific PCR (qMSP) of FBXO32 in ovarian cell lines. The DNA of ovarian cancer cell lines was bisulphite converted and percentage of FBXO32 methylation was determined by qMSP. The amount of methylated FBXO32 was normalized by the amount of ACTB and expressed as percent of IVD (in vitro methylated DNA). Each bar represents mean ± SD of duplicate experiments.
Reexpression of FBXO32 after epigenetic drug treatment of ovarian cancer cells
To quantify the methylation level of FBXO32, we designed a new set of primers for real time quantitative MSP assay (qMSP) based on the basis of the previously described bisulphite sequencing. Consistent with the COBRA and bisulphite sequencing results, a significantly higher level methylation of FBXO32 in HeyC2 cells compared to the other cancer (Fig. 2C) or normal (Supplementary Fig. S2) ovarian cells was observed using qMSP. Treatment with either the demethylating agent 5azaDC (Fig. 3A) or HDAC inhibitor TSA (Fig. 3B) lead to partial reexpression of FBXO32 in all ovarian cancer cells and prominent FBXO32 reactivation was observed in HeyC2, which had highest level of FBXO32 methylation. Interestingly, cells without FBXO32 methylation (MCP2, MCP3, CP70, and A2780) showed higher levels of FBXO32 reactivation after TSA treatment compared to 5azaDC. To exclude the possibility that high dose 5azaDC treatment had additional effects (other than DNA demethylation) in the HeyC2 line, cells were treated with 0.5μM of the DNMT inhibitor. Although the lower drug concentration had no obvious effect on reexpression of FBXO32 (Supplementary Fig. S3A), bisulfite sequencing revealed that 0.5μM of 5azaDC resulted in partial FBXO32 demethylation as compared with complete demethylation at 5μM of the treatment (Supplementary Fig. S3B). Taken together, these results further showed that FBXO32 is silenced by promoter hypermethylation in HeyC2 cells and suggest that chromatin histone modifications rather than DNA methylation contribute to FBXO32 gene silencing in MCP2, MCP3, CP70, and A2780 ovarian cancer cell lines.
Figure 3.

Expression level of FBXO32 in ovarian cancer cell lines treated with 5-aza-2′-deoxycytidine (5azaDC) or trichostatin A (TSA). Ovarian cancer cells were either treated with (A) 0.5 μM 5-azaDC for 72 hours or (B) TSA for 12 hours. Expression FBXO32 was determined by quantitative real time RT-PCR and compared to the DMSO treated control. Each bar represents mean ± SD of relative expression level of duplicate experiments.
Restoration of FBXO32 inhibits growth of ovarian cancer cells
Although a previous study showed that FBXO32 is a tumor suppressor in breast cancer, 23 the role of FBXO32 in ovarian cancer has not been investigated. To examine the effect of restoring FBXO32 expression in ovarian cancer cells, cell proliferation MTS assays and colony forming assays were performed. Transient transfection of two different vectors expressing FBXO32 cDNA into CP70 (Fig. 4A, B), Hey C2 (Fig. 4D, E) and SKOV3 cells (Supplementary Fig. S4) resulted in a reduction of size and number of colony formed. RT-PCR analysis confirmed the expression of FBXO32 in these transient transfected cells (Fig. 4C). Interestingly, transfection with the pcDNA3.1 vector showed a higher level of FBXO32 expression corresponding to a more than 20 fold growth suppression as compared to the pIRES_EGFP vector which showed a lower level of FBXO32 expression and a 3-fold growth suppression (based on number of colonies formed). Similar results were observed in FBXO32 stable transfectants using MTS assays (Fig. 5A, B).
Figure 4.

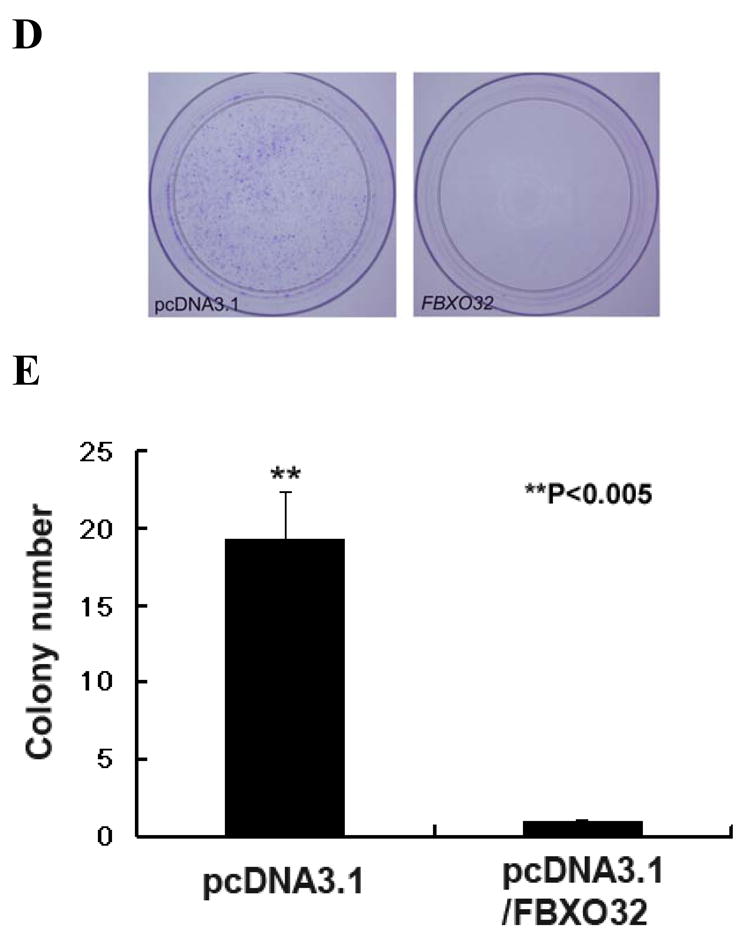
Effects of FBXO32 on the colony formation of ovarian cancer cells. (A) CP70 cells were transiently transfected with either pIRES2_EGFP (mock transfection, left) or plasmid expressing FBXO32 (pIRES2_EGFP/FBXO32, right). The fluorescence of EGFP was detected by fluorescence microscopy at the first week of the experiment (upper panel). FBXO32 transfectants showed significantly smaller and fewer colonies after G418 selection for 3 weeks (lower panel). (B) Quantitative analysis of the number of colonies formed by colony forming assay. Cells transfected with either pcDNA3.1- or pIRES_EGFP expressing FBXO32 vector showed a significant reduction in the number of colonies. The number of colonies formed using pcDNA3.1 (left) or pIRES2_EGFP (right) are: mock vs FBXO32, 46.5 ± 6.36 vs 1.5 ± 0.7, P< 0.001; 90.5 ± 9.19 vs 30.5 ± 2.12; P<0.001 respectively. (C) Expression analysis of FBXO32 in CP70 transfected cells. In the upper panel, RT-PCR was performed to examine the expression status of FBXO32 in CP70 cells transiently transfected with various plasmid. Lane 1: CP70 parental cells; lane 2: pcDNA 3.1; lane 3: pIRES2_EGFP; lane 4: pcDNA3.1/FBXO32 and lane 5: pIRES2_EGFP/FBXO32; M, 100bp marker. Expression of FBXO32 was only detected in cells transfected with FBXO32 expression vector (lane 4 & 5). Expression of GAPDH (lower panel) was also performed as internal control. (D) Similar experiment was performed in HeyC2 ovarian cancer cells. Transfection of FBXO32 expression vector leads to significant reduction in the number of colonies in HeyC2 cells. (E) Quantitative analysis of colony forming assay showed that the number of colonies formed were greater (P<0.005) in mock vs FBXO32 (19.33 ± 3.06 vs 1 ± 0).
Figure 5.

Effects of FBXO32 on growth of ovarian cancer cells. The effect of FBXO32 on growth of CP70 (A) and HeyC2 (B) cells in vitro was determined by MTS assay. FBXO32 stable transfectants were seeded onto 96-well plates for 4 days. The number of cells at the end of the experiment was determined by colorimetric MTS assay assays. The results showed that restoration of FBXO32 significantly inhibited growth of CP70 and HeyC2 cells in vitro. (C) The effect of FBXO32 on tumor growth in vivo was also determined by nude mice model. CP70 cells stably transfected with FBXO32 or empty vector (pcDNA3.1) were injected subcutaneously into athymic nude mice. Tumor volumes were measured daily. From day 14 onwards, the volume of tumors with FBXO32 was significantly reduced compared to vector controls (**P < 0.005, *P < 0.05 and Supplementary Fig. S5). Data were expressed as mean ± SD (n=4).
Restoration of FBXO32 inhibits tumor growth in vivo
To further examine the effect of FBXO32 in CP70 cells in vivo, cells that were stably transfected with either FBXO32 cDNA or control vector (pcDNA3.1) were injected subcutaneously into nude mice. Tumor growth from cells injected with control vector was first observed at day 9 after injection of CP70 cells (Fig. 5C). From day 14 onwards, there was a significant difference in the tumor volume between cells transfected with FBXO32 and control vector (D14: 0.05 cm3 ± 0.037 cm3 vs 0.174 cm3 ± 0.056 cm3, P < 0.005; Supplementary Fig. S5). Taken together, results from in vitro and in vivo indicate that FBXO32 might be a tumor suppressor in ovarian cancer.
FBXO32 induces apoptosis and enhances chemosensitivity to cisplatin
Having shown that FBXO32 inhibited the growth of ovarian cancer, it was of interest to examine the mechanism associated with this inhibition. As a previous study demonstrated that FBXO32 plays a critical role in regulating apoptosis in breast cancer 23, we investigated whether FBXO32 induces apoptosis in ovarian cancer. Results from the FACS analysis showed that transfection of FBXO32 enhanced apoptosis in CP70 cells as compared with vector control (apoptotic cell%, control: 2.55 ± 0.17; FBXO32: 10.72 ± 1.07, P<0.05; Fig 6A, B). We then investigated whether FBXO32 can enhance the activity of a known apoptotic agent, cisplatin, in CP70 cells.
Figure 6.

Effect of FBXO32 on apoptosis and chemosensitivity of CP70 ovarian cancer cells. Cells were treated with or without cisplatin (1μg/ml) for 24 hrs. DNA fragmentation was measured by FACS analysis. (A) DNA fluorescence histogram of propidium iodide-stained cells. FBXO32 enhances apoptosis in CP70 cells as determined by sub-G1 area (marked by M1 in the histogram). This effect is more prominent in cells treated with cisplatin. (B) Percentage of apoptotic cells in sub-G1 area. Data are expressed as mean ± SD (n=3) (*P < 0.05). (C) The effect of FBXO32 on chemosensitivity of CP70 to cisplatin was also determined by MTS cytotoxicity assay. Cells seeded on 96-well plate were treated with various concentrations of cisplatin for 4 days. At the end of the experiment, cell numbers (expressed as survival%) were determined by colorimetric MTS assay. The mean ± SD on each concentration of cisplatin were shown (*P<0.05).
As expected, CP70 demonstrated chemoresistance to this agent (Fig 6B) as reported previously29. Interestingly, FBXO32 markedly enhanced apoptosis of CP70 at the same dose of cisplatin (apoptotic cell%, control: 3.28 ± 0.24; FBXO32: 16.94 ± 0.25, P<0.05). Furthermore, MTS cytotoxicity assay revealed that transfection of FBXO32 induced an ~ twofold increase in cisplatin sensitivity of CP70 cells (IC50, control: 1.447μg/ml; FBXO32-1: 0.892μg/ml, and Fig 6C). Surprisingly, the same effect was not observed in HeyC2 cells which have much higher drug-resistance than CP70 cells (IC50, HeyC2: 5.6μg/ml, CP70: 2.2μg/ml, and Supplementary Fig. S6). However, an increase in the G1 cell population was observed in FBXO32-transfected HeyC2 cells (Supplementary Table S2), suggesting that decreased cell cycle progression may be responsible for the slower cell growth rate observed in those cells (Fig 5B).
FBXO32 methylation predicts survival in ovarian cancer patients
To investigate the clinical relevance of our in vitro findings, we used qMSP and immunohistochemistry to examine FBXO32 methylation and expression in tumor samples (n=96) from ovarian cancer patients (Supplementary Table S1). The median age at the time of diagnosis for this cohort was 52 years (range, 18–90 years). Fifty-eight cases (60.4%) were at high stage (FIGO stage III & IV) and 38 cases (39.6%) were at low stage (FIGO stage I & II). A 30% methylation level was used as a cut-off to discriminate between clinicopathological parameters, based on the level of methylation determined in the NOSE cells. The methylation level of FBXO32 was significantly associated with high stage patients (P=0.024; Fig. 7A and Table 1). No association between FBXO32 methylation and age or grade was observed. On the other hand, samples with higher methylation had lower expression of FBXO32, although heterogeneous FBXO32 staining was observed (Supplementary Fig. S7). Kaplan-Meier survival curves showed that patients with high FBXO32 methylation had significantly shorter progression-free survival (PFS, P=0.027) than patients with low FBXO32 methylation (Fig. 7B), indicating that FBXO32 methylation may serve as a prognostic indicator. Although FBXO32 methylation was not significantly associated with overall survival (OS), the high methylation group tended to have shorter survival (Fig 7C, P=0.096).
Figure 7.

Association between methylation level of FBXO32 and survival in 96 ovarian cancer patient samples. (A) Histogram showing the methylation level of FBXO32 in 96 ovarian cancer samples detected by qMSP. Samples with methylation level ≥30% was considered as methylated and was indicated. The red and green bar indicates samples of high and low stage tumor respectively. It is interesting to note that most of the methylated samples are of high stage tumor (p<0.05, table 1). Kaplan-Meier analysis for progression-free survival (B) and overall survival (C) in 96 ovarian cancer samples was shown. Patients were grouped according to the FBXO32 methylation level of 30% which is based on the methylation level of NOSE cells. Patients with high FBXO32 methylation have significant shorter progression free survival. Log-rank P-values are shown.
Table 1.
Association between methylation of FBXO32 and clinicopathological features of 96 ovarian cancer patients
| All cases | Extreme cases removed | |||
|---|---|---|---|---|
| Methylation% | p | Methylation% | p | |
| Age | ||||
| ≧60 | 22.6 (7/31) | 35.0 (7/20) | ||
| < 60 | 21.5 (14/65) | 0.552 | 35.8 (14/39) | 0.590 |
| Stage3 | ||||
| high | 29.3 (17/58) | 50.0 (17/34) | ||
| low | 10.5 (4/38) | 0.024 | 16.0 (4/25) | 0.007 |
| Grade4 | ||||
| high | 25.0 (19/76) | 42.2 (19/45) | ||
| low | 10.5 (2/19) | 0.146 | 14.3 (2/14) | 0.052 |
mean ± SD;
Extreme cases are removed from analysis (see material and methods).
High and low stage are defined as FIGO III & IV and I & II respectively.
High and low grade are defined as grade 2–3 and 1 respectively. Grade information was not available for one patient.
Interestingly, there was a group of patients displaying low FBXO32 methylation (methylation <15%) and also low overall survival (<36 months) (Supplementary Fig. S8), indicating that tumorigenesis in this group of patients may be independent of FBXO32 methylation. Exclusion of this extreme group from the analysis resulted in a significant association of FBXO32 methylation with stage (P=0.007), and marginally with grade (P=0.052; Table 1).
Because the above approaches used a cut-off value and may have biased the data analysis, a multivariate analysis was performed to analyze FBXO32 methylation (on a continuous scale) and age for their predictive values on OS and PFS. The results from Cox proportional hazards model are shown in Table 2. FBXO32 methylation was predictive of PFS (Hazard Ratios (HR) of 1.003, P=0.028) but not OS (P=0.095). As expected, age was also a significant prognostic factor for OS (P=0.011). Exclusion of the extreme group also resulted in a significant association of FBXO32 methylation with PFS (P=0.008) as well as OS (P=0.008), which is similar to the Kaplan-Meier analysis demonstrating that high FBXO32 methylation levels were associated with shorter survival.
Table 2.
Multivariate analysis of survival by Cox proportional hazards model
| Variable | Overall survival | Progression-free survival | ||
|---|---|---|---|---|
| HR(95% CI) | p | HR(95% CI) | p | |
| FBXO32 methylation | 1.002 (1.000–1.005) | 0.095 | 1.003 (1.000–1.006) | 0.028 |
| Age | 1.034 (1.008–1.062) | 0.011 | 1.018 (0.994–1.042) | 0.137 |
| FBXO32 methylation* | 1.004 (1.001–1.008) | 0.008 | 1.004 (1.001–1.007) | 0.008 |
| Age* | 1.029 (0.997–1.061) | 0.073 | 1.016 (0.989–1.044) | 0.256 |
Extreme cases were removed from analysis (see Material and Methods)
Discussion
Dysregulation of TGF-β signaling pathway is a common event in ovarian cancer and crucial for ovarian cancer carcinogenesis.4 Recent studies have further demonstrated that disruption of an upstream signaling pathway regulator may result in transcriptional repression of a downstream target gene through epigenetic mechanisms,15,30 and our previous study showed that dysregulation of TGF-β/SMAD4 signaling lead to epigenetic silencing of its downstream target, ADAM19 in ovarian cancer cells with impaired SMAD4 nuclear translocation.15
In this study, our investigation of another TGF-β/SMAD4 downstream target, FBXO32, further supports this hypothesis. We found that FBXO32 is expressed in normal ovarian surface epithelial cells but down-regulated in ovarian cancer cells. While this down-regulation was mediated through DNA methylation in HeyC2 cells showing constitutive SMAD4 nuclear translocation15 (Supplementary Fig. S9), downregulation of FBXO32 in ovarian cancer cells with impaired SMAD4 nuclear translocation (MCP2, MCP3, A2780 and CP70) was independent of DNA methylation.15 Methylation of FBXO32 in HeyC2 cells may be due to long term, constitutive activation of SMAD4, however the role of SMAD4 in the methylation of FBXO32 warrants further investigation. Furthermore, we observed downregulation of another TGF-β/SMAD4 target, RunX1T1, by promoter hypermethylation in HeyC2 cells (data not shown). Although our studies on the role of TGF-β in RUNX1T1 hypermethylation are currently ongoing, this result suggests that dysregulation of the TGF-β signaling pathway may contribute to concurrent methylation of tumor suppressor genes in cancer, a phenomenon known as CpG Island Methylator phenotype, CIMP.31 In contrast, silencing of FBXO32 in ovarian cancer cells with impaired SMAD4 nuclear translocation appears to be mediated by chromatin histone changes (Fig. 3B), as we have observed for another TGF-β downstream target, ADAM19.15 In support of this possibility, a previous study reported that inhibition of the polycomb-repressive complex 2 (PRC2) by DZNep restored expression of FBXO32 in MCF7 cells. We observed that treatment with TSA, which has been shown to remove repressive histone marks, restored FBXO32 expression in cells without FBXO32 methylation (MCP2, MCP3, A2780, and CP70). In contrast, treatment with the DNMT inhibitor 5azaDC did not result in re-expression of FBXO32 in MCF7 cells, although partial demethylation was observed.23 This discrepancy may be due to the fact that low dose 5azaDC (0.5μM) leads to only partial demethylation of FBXO32, while complete demethylation is required for the re-activation of this gene (Supplementary Fig. S3). However, it is possible that the mechanism of FBXO32 silencing in breast cancer cells may be different than in ovarian cancer, and off-target effects of 5azaDC cannot be overlooked. In support of this latter possibility, inhibition of G9A histone methyltransferase decreased histone H3 K9 dimethylation, 32 and 5azaDC can up-regulate genes without causing detectable demethylation,33,34 perhaps explaining partial reactivation of FBXO32 by 0.5μM of 5azaDC in MCP2, MCP3 cells (data not shown).
FBXO32 belongs to the F-box protein family of the SCF ubiquitin protein ligase complex involved in muscle atrophy.22 However, a previous study showed that the AKT signaling pathway negatively regulates FBXO3224 thus implying that it may also be involved in regulating cell survival.23 More recently, FBXO32 has been shown to be up-regulated by tumor necrosis factor (TNF), a signaling which is known to be involved in regulating apoptosis.35 In this study, we found that restoration of FBXO32 reduced tumor growth in vitro and in vivo, perhaps due to increased cellular apoptosis. To further investigate this possibility, we restored FBXO32 expression in drug-resistant ovarian cancer cells and examined the ability of cisplatin to induce apoptosis. Interestingly, FBXO32 resensitized CP70 cells to cisplatin and markedly enhanced apoptosis. On the contrary, FBXO32 rexpression only caused decrease cell cycle progression in HeyC2 cells, which have a much higher drug resistance than CP70, suggesting that the mechanism of FBXO32-mediated growth suppression differs in the two ovarian cancer cell lines. Together with recent findings that two other members of F-Box protein FBXW7 and FBX4 can function as tumor suppressors,36,37 FBXO32 may be a novel tumor suppressor in ovarian cancer, and down-regulation of FBXO32 may impair TGF-β-mediated growth inhibition in ovarian cancer as observed in our previous study.15
To explore the relationship between clinicopathological features and methylation of FBXO32, we performed qMSP on ovarian carcinomas. A high level of FBXO32 methylation was significantly associated with higher stage and shorter PFS, suggesting that silencing of FBXO32 may be crucial to ovarian cancer progression and may have the potential to serve as a new prognostic marker for the disease. It is important to note that a group of patients displayed low FBXO32 methylation and low overall survival. Removal of that group from the analysis resulted in a further significant association of stage, grade and survival (both OS and PFS). It is unclear why survival of this group of patients was independent of FBXO32 methylation but one possibility could be that TGF-β signaling pathway was disrupted in those tumors, as we have observed in ovarian cancer cell lines (impaired SMAD4 nuclear translocation was seen in MCP3, MCP2, A2780 and CP70 cell lines; ref 15; Fig. 2).
In conclusion, we show that FBXO32 is epigenetically silenced in ovarian cancer cells with impaired TGF-β/SMAD4 signaling and may be a novel tumor suppressor in ovarian cancer. As a high level of FBXO32 methylation predicts survival in ovarian cancer patients, we suggest that FBXO32 may serve as a methylation biomarker for the disease.
Supplementary Material
Acknowledgments
The authors would like to thank Drs Yeu-Wei Leu and Hau-Ren Chen for their technical assistance. This work was supported by research grant from National Science Council, Republic of China: NSC97-2320-B-194-002-MY3, NSC96-2314-B-194-002 and National Health Research Institute, Republic of China: NHRI-EX98-9717NC.
Abbreviations
- ChIP-chip
chromatin immunoprecipitation coupled to microarray chips
- 5azaDAC
5-aza-2′-deoxycytidine
- TSA
trichostatin A
- HDAC
histone deacetylase
- OSE
ovarian surface epithelium
- TGF-β
transforming growth factor-beta
- RT-PCR
reverse transcription followed by polymerase chain reactions
- qMSP
quantitative methylation specific polymerase chain reactions
- COBRA
combine bisulphite restriction analysis
References
- 1.Wakabayashi MT, Lin PS, Hakim AA. The role of cytoreductive/debulking surgery in ovarian cancer. J Natl Compr Canc Netw. 2008;6:803–810. doi: 10.6004/jnccn.2008.0060. quiz 811. [DOI] [PubMed] [Google Scholar]
- 2.Sogaard M, Kjaer SK, Gayther S. Ovarian cancer and genetic susceptibility in relation to the BRCA1 and BRCA2 genes. Occurrence, clinical importance and intervention. Acta Obstet Gynecol Scand. 2006;85:93–105. doi: 10.1080/00016340500324621. [DOI] [PubMed] [Google Scholar]
- 3.Nossov V, Amneus M, Su F, et al. The early detection of ovarian cancer: from traditional methods to proteomics. Can we really do better than serum CA-125? Am J Obstet Gynecol. 2008;199:215–223. doi: 10.1016/j.ajog.2008.04.009. [DOI] [PubMed] [Google Scholar]
- 4.Nilsson EE, Skinner MK. Role of transforming growth factor beta in ovarian surface epithelium biology and ovarian cancer. Reprod Biomed Online. 2002;5:254–258. doi: 10.1016/s1472-6483(10)61828-7. [DOI] [PubMed] [Google Scholar]
- 5.Wong AS, Leung PC. Role of endocrine and growth factors on the ovarian surface epithelium. J Obstet Gynaecol Res. 2007;33:3–16. doi: 10.1111/j.1447-0756.2007.00478.x. [DOI] [PubMed] [Google Scholar]
- 6.Yamada SD, Baldwin RL, Karlan BY. Ovarian carcinoma cell cultures are resistant to TGF-beta1-mediated growth inhibition despite expression of functional receptors. Gynecol Oncol. 1999;75:72–77. doi: 10.1006/gyno.1999.5535. [DOI] [PubMed] [Google Scholar]
- 7.Hu W, Wu W, Nash MA, Freedman RS, Kavanagh JJ, Verschraegen CF. Anomalies of the TGF-beta postreceptor signaling pathway in ovarian cancer cell lines. Anticancer Res. 2000;20:729–733. [PubMed] [Google Scholar]
- 8.Balch C, Fang F, Matei DE, Huang TH, Nephew KP. Minireview: epigenetic changes in ovarian cancer. Endocrinology. 2009;150:4003–4011. doi: 10.1210/en.2009-0404. [DOI] [PMC free article] [PubMed] [Google Scholar]
- 9.Simon JA, Lange CA. Roles of the EZH2 histone methyltransferase in cancer epigenetics. Mutat Res. 2008;647:21–29. doi: 10.1016/j.mrfmmm.2008.07.010. [DOI] [PubMed] [Google Scholar]
- 10.Mulero-Navarro S, Esteller M. Epigenetic biomarkers for human cancer: the time is now. Crit Rev Oncol Hematol. 2008;68:1–11. doi: 10.1016/j.critrevonc.2008.03.001. [DOI] [PubMed] [Google Scholar]
- 11.McKenna ES, Roberts CW. Epigenetics and cancer without genomic instability. Cell Cycle. 2009;8:23–26. doi: 10.4161/cc.8.1.7290. [DOI] [PubMed] [Google Scholar]
- 12.Caslini C, Capo-chichi CD, Roland IH, Nicolas E, Yeung AT, Xu XX. Histone modifications silence the GATA transcription factor genes in ovarian cancer. Oncogene. 2006;25:5446–5461. doi: 10.1038/sj.onc.1209533. [DOI] [PMC free article] [PubMed] [Google Scholar]
- 13.Yu Y, Fujii S, Yuan J, et al. Epigenetic regulation of ARHI in breast and ovarian cancer cells. Ann N Y Acad Sci. 2003;983:268–277. doi: 10.1111/j.1749-6632.2003.tb05981.x. [DOI] [PubMed] [Google Scholar]
- 14.Chan MW, Wei SH, Wen P, et al. Hypermethylation of 18S and 28S ribosomal DNAs predicts progression-free survival in patients with ovarian cancer. Clin Cancer Res. 2005;11:7376–7383. doi: 10.1158/1078-0432.CCR-05-1100. [DOI] [PubMed] [Google Scholar]
- 15.Chan MW, Huang YW, Hartman-Frey C, et al. Aberrant transforming growth factor beta1 signaling and SMAD4 nuclear translocation confer epigenetic repression of ADAM19 in ovarian cancer. Neoplasia. 2008;10:908–919. doi: 10.1593/neo.08540. [DOI] [PMC free article] [PubMed] [Google Scholar]
- 16.Su HY, Lai HC, Lin YW, Chou YC, Liu CY, Yu MH. An epigenetic marker panel for screening and prognostic prediction of ovarian cancer. Int J Cancer. 2009;124:387–393. doi: 10.1002/ijc.23957. [DOI] [PubMed] [Google Scholar]
- 17.Wei SH, Chen CM, Strathdee G, et al. Methylation microarray analysis of late-stage ovarian carcinomas distinguishes progression-free survival in patients and identifies candidate epigenetic markers. Clin Cancer Res. 2002;8:2246–2252. [PubMed] [Google Scholar]
- 18.Wei SH, Balch C, Paik HH, et al. Prognostic DNA methylation biomarkers in ovarian cancer. Clin Cancer Res. 2006;12:2788–2794. doi: 10.1158/1078-0432.CCR-05-1551. [DOI] [PubMed] [Google Scholar]
- 19.Qin H, Chan MW, Liyanarachchi S, et al. An integrative ChIP-chip and gene expression profiling to model SMAD regulatory modules. BMC Syst Biol. 2009;3:73. doi: 10.1186/1752-0509-3-73. [DOI] [PMC free article] [PubMed] [Google Scholar]
- 20.Bodine SC, Latres E, Baumhueter S, et al. Identification of ubiquitin ligases required for skeletal muscle atrophy. Science. 2001;294:1704–1708. doi: 10.1126/science.1065874. [DOI] [PubMed] [Google Scholar]
- 21.Li HH, Kedar V, Zhang C, et al. Atrogin-1/muscle atrophy F-box inhibits calcineurin-dependent cardiac hypertrophy by participating in an SCF ubiquitin ligase complex. J Clin Invest. 2004;114:1058–1071. doi: 10.1172/JCI22220. [DOI] [PMC free article] [PubMed] [Google Scholar]
- 22.Hanai J, Cao P, Tanksale P, et al. The muscle-specific ubiquitin ligase atrogin-1/MAFbx mediates statin-induced muscle toxicity. J Clin Invest. 2007;117:3940–3951. doi: 10.1172/JCI32741. [DOI] [PMC free article] [PubMed] [Google Scholar]
- 23.Tan J, Yang X, Zhuang L, et al. Pharmacologic disruption of Polycomb-repressive complex 2-mediated gene repression selectively induces apoptosis in cancer cells. Genes Dev. 2007;21:1050–1063. doi: 10.1101/gad.1524107. [DOI] [PMC free article] [PubMed] [Google Scholar]
- 24.Stitt TN, Drujan D, Clarke BA, et al. The IGF-1/PI3K/Akt pathway prevents expression of muscle atrophy-induced ubiquitin ligases by inhibiting FOXO transcription factors. Mol Cell. 2004;14:395–403. doi: 10.1016/s1097-2765(04)00211-4. [DOI] [PubMed] [Google Scholar]
- 25.Ahluwalia A, Hurteau JA, Bigsby RM, Nephew KP. DNA methylation in ovarian cancer. II. Expression of DNA methyltransferases in ovarian cancer cell lines and normal ovarian epithelial cells. Gynecol Oncol. 2001;82:299–304. doi: 10.1006/gyno.2001.6284. [DOI] [PubMed] [Google Scholar]
- 26.Gillan L, Matei D, Fishman DA, Gerbin CS, Karlan BY, Chang DD. Periostin secreted by epithelial ovarian carcinoma is a ligand for alpha(V)beta(3) and alpha(V)beta(5) integrins and promotes cell motility. Cancer Res. 2002;62:5358–5364. [PubMed] [Google Scholar]
- 27.Chan MW, Chu ES, To KF, Leung WK. Quantitative detection of methylated SOCS-1, a tumor suppressor gene, by a modified protocol of quantitative real time methylation-specific PCR using SYBR green and its use in early gastric cancer detection. Biotechnol Lett. 2004;26:1289–1293. doi: 10.1023/B:BILE.0000044922.43572.2d. [DOI] [PubMed] [Google Scholar]
- 28.Cheng AS, Jin VX, Fan M, et al. Combinatorial analysis of transcription factor partners reveals recruitment of c-MYC to estrogen receptor-alpha responsive promoters. Mol Cell. 2006;21:393–404. doi: 10.1016/j.molcel.2005.12.016. [DOI] [PubMed] [Google Scholar]
- 29.Henkels KM, Turchi JJ. Induction of apoptosis in cisplatin-sensitive and -resistant human ovarian cancer cell lines. Cancer Res. 1997;57:4488–4492. [PubMed] [Google Scholar]
- 30.Bagnyukova TV, Tryndyak VP, Muskhelishvili L, Ross SA, Beland FA, Pogribny IP. Epigenetic downregulation of the suppressor of cytokine signaling 1 (Socs1) gene is associated with the STAT3 activation and development of hepatocellular carcinoma induced by methyl-deficiency in rats. Cell Cycle. 2008;7:3202–3210. doi: 10.4161/cc.7.20.6816. [DOI] [PubMed] [Google Scholar]
- 31.Issa JP. CpG island methylator phenotype in cancer. Nat Rev Cancer. 2004;4:988–993. doi: 10.1038/nrc1507. [DOI] [PubMed] [Google Scholar]
- 32.Tachibana M, Sugimoto K, Fukushima T, Shinkai Y. Set domain-containing protein, G9a, is a novel lysine-preferring mammalian histone methyltransferase with hyperactivity and specific selectivity to lysines 9 and 27 of histone H3. J Biol Chem. 2001;276:25309–25317. doi: 10.1074/jbc.M101914200. [DOI] [PubMed] [Google Scholar]
- 33.Wozniak RJ, Klimecki WT, Lau SS, Feinstein Y, Futscher BW. 5-Aza-2′-deoxycytidine-mediated reductions in G9A histone methyltransferase and histone H3 K9 di-methylation levels are linked to tumor suppressor gene reactivation. Oncogene. 2007;26:77–90. doi: 10.1038/sj.onc.1209763. [DOI] [PubMed] [Google Scholar]
- 34.Guilleret I, Benhattar J. Demethylation of the human telomerase catalytic subunit (hTERT) gene promoter reduced hTERT expression and telomerase activity and shortened telomeres. Exp Cell Res. 2003;289:326–334. doi: 10.1016/s0014-4827(03)00281-7. [DOI] [PubMed] [Google Scholar]
- 35.Moylan JS, Smith JD, Chambers MA, McLoughlin TJ, Reid MB. TNF induction of atrogin-1/MAFbx mRNA depends on Foxo4 expression but not AKT-Foxo1/3 signaling. Am J Physiol Cell Physiol. 2008;295:C986–993. doi: 10.1152/ajpcell.00041.2008. [DOI] [PMC free article] [PubMed] [Google Scholar]
- 36.Lin DI, Barbash O, Kumar KG, et al. Phosphorylation-dependent ubiquitination of cyclin D1 by the SCF(FBX4-alphaB crystallin) complex. Mol Cell. 2006;24:355–366. doi: 10.1016/j.molcel.2006.09.007. [DOI] [PMC free article] [PubMed] [Google Scholar]
- 37.Fujii Y, Yada M, Nishiyama M, et al. Fbxw7 contributes to tumor suppression by targeting multiple proteins for ubiquitin-dependent degradation. Cancer Sci. 2006;97:729–736. doi: 10.1111/j.1349-7006.2006.00239.x. [DOI] [PMC free article] [PubMed] [Google Scholar]
Associated Data
This section collects any data citations, data availability statements, or supplementary materials included in this article.